CO-bandhead spectroscopy of IC 342:
mass and age of the
nuclear star cluster11affiliation: Based on observations obtained with the Infrared Telescope
Facility, which is operated by the University of Hawaii under contract
to the National Aeronautics and Space Administration.
Abstract
We have used the NASA Infra-Red Telescope Facility (IRTF) to observe the nuclear stellar cluster in the nearby, face-on, giant Scd spiral IC 342. From high resolution () spectra at the 12CO (2-0) bandhead at we derive a line-of-sight stellar velocity dispersion .
To interpret this observation we construct dynamical models based on the Jeans equation for a spherical system. The light distribution of the cluster is modeled using an isophotal analysis of an HST V-band image from the HST Data Archive, combined with new ground-based K-band imaging. Under the assumption of an isotropic velocity distribution, the observed kinematics imply a K-band mass-to-light ratio , and a cluster mass . We model the mass-to-light ratio with the ‘starburst99’ stellar population synthesis models of Leitherer and collaborators, and infer a best-fitting cluster age in the range years. Although this result depends somewhat on a number of uncertainties in the modeling (e.g., the assumed extinction along the line-of-sight towards the nucleus, the IMF of the stellar population model, and the velocity dispersion anisotropy of the cluster), none of these can be plausibly modified to yield a significantly larger age. Also, the inferred age is consistent with that found in our previous study based on the near-infrared absorption line equivalent widths of the cluster (Böker, Förster-Schreiber & Genzel 1997).
Recent HST observations of large samples of spiral galaxies have shown that nuclear stellar clusters are very common in intermediate to late-type spirals. The cluster in IC 342 is more luminous than the clusters found in most other nearby spiral galaxies. If the nuclear stellar clusters in spiral galaxies all have a mass similar to that of the cluster in IC 342, then stellar population synthesis models indicate a median age for these clusters of several Gyrs. This may be consistent with a scenario in which each spiral galaxy has only one episode of nuclear star cluster formation. On the other hand, the incidence of young nuclear star clusters may be high enough to indicate that the formation of these clusters is a recurring phenomenon. Age and population studies for a larger sample of galaxies are necessary to distinguish between these scenarios, and to determine how these nuclear stellar clusters are related to the secular evolution of their environment.
As a byproduct of our analysis, we infer that IC 342 cannot have any central black hole more massive than . This is times less massive than the black hole inferred to exist in our Galaxy, consistent with the accumulating evidence that galaxies with less massive bulges harbor less massive black holes.
1 Introduction
The central regions of spiral galaxies have traditionally been well studied at scales using ground-based observations. Results from such studies have shown that spiral galaxies have bulges, and these bulges diminish progressively in prominence from early-type spirals to late-type spirals (e.g., Wyse, Gilmore & Franx 1997). This has formed one of the central ideas behind the Hubble sequence classification. Recently, however, observations with the Hubble Space Telescope (HST) have revealed that the morphological and photometric properties of the centers of spiral galaxies at – scales are more complicated than was previously assumed (Carollo et al. 1997; Carollo, Stiavelli & Mack 1998; Carollo & Stiavelli 1998). The majority of early-type spirals (S0a–Sab) show smooth bulge-like structures with brightness profiles that follow an law. Such bulges have traditionally been viewed as ‘small ellipticals’. By contrast, most intermediate (Sb–Sc) type spirals have bulges that follow an exponential profile, and are of lower surface brightness and density than their counterparts. In late type spirals (Scd and later type) virtually all bulges are of this exponential type. This transition from to exponential bulges along the Hubble sequence had been inferred from ground-based work as well (Andredakis & Sanders 1994; Andredakis, Peletier & Balcells 1995; Courteau, de Jong & Broeils 1996), but only the HST observations revealed that a compact, photometrically distinct nuclear star cluster is almost always present in the centers of exponential bulges (e.g., Carollo et al. 1998; Böker et al. 1999). Ground-based spectroscopic observations had already demonstrated the existence of such clusters (e.g., Ho, Filippenko & Sargent 1997), but with HST they could now be resolved for the first time. Nuclear star clusters may play an important role in the secular evolution of intermediate and late-type spirals (Carollo 1999). In order to better understand the origin of these clusters and the influence they have on their surroundings, more detailed information is now needed on their properties, including their masses and the ages of their stellar populations.
In this paper we present a detailed study of the nuclear star cluster in IC 342, a nearby, face-on giant Scd spiral. The distance to IC 342, (1′′= 8.7 pc) as advocated by McCall (1989), makes it the nearest giant spiral after M31 and M33 (although it has recently been suggested that the distance may be larger, –; see §3.4 below). As a result of its small distance and face-on orientation, the nuclear star cluster in IC 342 is better resolved, apparently brighter, and less obscured by disk material than in nearly all other spiral galaxies. The only difficulty with observations of IC 342 is its proximity to the Galactic plane, which results in several magnitudes of foreground extinction (McCall 1989; Madore & Freedman 1992). This explains the paucity of previous optical studies of this nearby galaxy (as well as its absence from the Messier and NGC Catalogs). However, it is not a major drawback for infrared studies; the extinction in the K-band is nearly 10 times smaller than in the V-band (e.g., Rieke & Lebofsky 1985), and near-infrared observations can therefore almost completely penetrate the dust.
Because of its enhanced star formation rate (e.g., Becklin et al. 1980), IC 342 has previously been a popular target for infrared and sub-mm observations. In Böker, Förster-Schreiber & Genzel (1997, hereafter BFG97) we obtained medium-spectral resolution two-dimensional near-infrared spectroscopy in the H and K-bands for the central 12′′ of IC 342. While part of this study focused on the 7′′ diameter ring of molecular gas and star-formation in IC 342 (Turner & Ho 1983; Ishizuki et al. 1990), we also addressed the nature of the star cluster seen at the very center of the galaxy. The observations used to constrain the latter were: (i) the equivalent widths of several prominent absorption lines; and (ii) an estimate of the mass-to-light ratio () of the cluster. From stellar population synthesis models we inferred that the cluster is presumably young ( years) and dominated by a population of red supergiants.
Our previous analysis of the nuclear cluster remained somewhat tentative, however. In particular, the estimate of the cluster was based on the molecular gas rotation curve obtained by Turner & Hurt (1992). There are several reasons why the resulting could be highly uncertain. For example, hydrodynamical forces may cause the gas rotation speed to deviate from the circular velocity, and the limited spatial resolution ( 5′′) of the gas kinematic observations may yield an underestimate of the rotation velocity. We therefore set out to obtain a more direct and more accurate determination of the .
The velocity dispersion of the nuclear star cluster in IC 342 provides a direct measure of its mass, and hence its . In this paper we report on high-resolution spectroscopy of the cluster around the infrared 12CO (2-0) bandhead at . This spectral region is relatively insensitive to dust absorption, and has been demonstrated to be well-suited for the determination of the velocity dispersion of stellar systems (e.g., Gaffney, Lester & Doppmann 1995). To facilitate the interpretation of the spectroscopic data we also obtained a new K-band image of IC 342.
The outline of the paper is as follows. In §2 we describe the observations, the data reduction and the kinematic analysis from which we infer the velocity dispersion of the nuclear star cluster. In §3 we analyze a V-band image of IC 342 from the HST Data Archive, as well as the new K-band ground-based image. We then present dynamical models for the cluster from which we derive the mass-to-light ratio, and we interpret the results with stellar-population synthesis models. In §4 we we present some concluding remarks, and we discuss the results of our analysis in the context of our general understanding of the properties and evolution of spiral galaxy nuclei and bulges.
2 Observations, data reduction and kinematic analysis
2.1 K-band imaging
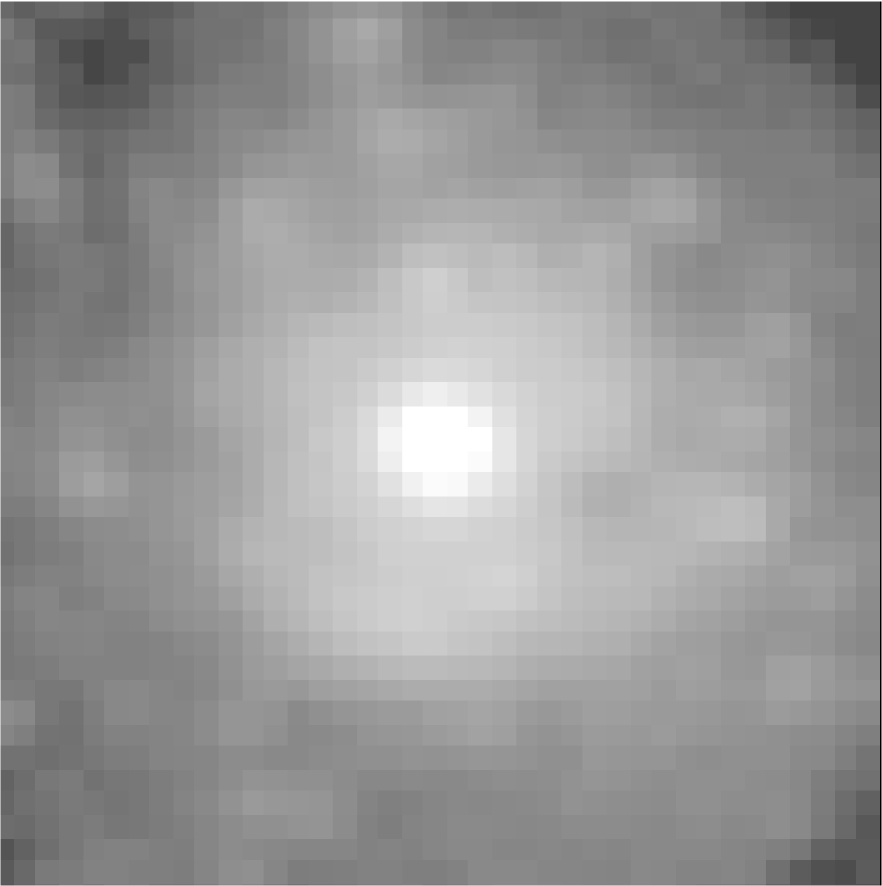
We obtained a K-band image of the central region of IC 342 at the NASA Infrared Telescope Facility (IRTF) on Mauna Kea, Hawaii, on the night of 29 November 1998 (UT) using the NSFCam 256x256 InSb array camera (Shure et al. 1994) with the 0.3′′/pixel plate scale. Conditions were photometric and the seeing was estimated to be 0.5′′–0.6′′ FWHM. Seven images of IC 342, each consisting of 50 coadds of individual frames with integration times of 0.4s, were acquired at different positions on the array. Exposures of an offset sky position 200′′ east of the galaxy were obtained immediately after each galaxy image and with identical integration times. The offset frames were combined to construct a sky image and a sky flat, which were used to process (sky subtract and flat-field) the galaxy images. The dark current is negligible for these short integration times and did not have to be subtracted from the sky frames before constructing the flat field. The individual galaxy images were then shifted to a common reference frame (registered) and combined into a single mosaic. The final image is shown in Figure 2a. The stellar images on the mosaic reveal a slight degradation of the image quality by the mosaic process to about 0.7′′ FWHM.
We also acquired images of several UKIRT faint standard stars during the night in order to derive photometric calibrations. The images were obtained and reduced in a manner similar to that for the galaxy images. Separate sky frames were not acquired, however; rather, the standard star fields were dithered on the array and were used to generate the sky frames and flat fields. Photometry was performed using DAOPHOT in IRAF with a 12 pixel radius aperture and the photometric zero point and K-band extinction coefficient were determined. These coefficients were applied to the aperture photometry of the K-band mosaic discussed in §3.1 below.
2.2 Spectroscopic Observations and Data Reduction
We obtained high resolution spectra of IC 342 centered on the CO bandhead with the CSHELL spectrograph on the IRTF, during parts of the nights of 1998 October 14, November 29, and December 31. CSHELL is a long-slit spectrograph which uses a 31.6 lines/mm echelle with narrow-band circular variable filters (CVFs) that isolate a single order (Tokunaga et al. 1990; Greene et al. 1993). It operates from –. The detector is a pixel Hughes SBRC InSb array with a pixel scale of 0.2′′ in the spatial direction and in the wavelength direction; the corresponding free spectral range is . The slit length is 30′′ or 150 spatial pixels. The grating was set to position the CO bandhead on the array center, and the corresponding order was isolated with the circular variable filter. The systemic velocity of IC 342 is only (Turner & Hurt 1992) and we did not compensate for it in the grating positioning. The seeing during the observations varied from 0.7–1.2′′ (FWHM). All observations were obtained with a 1.0′′ slit width, which corresponds to 5 pixels on the detector, or in the spectral direction. The resulting resolving power is , with a Gaussian dispersion of the instrumental line-spread-function of (as measured from arc-lamp spectra).
Our observing procedure was the same on each of the three nights. After moving the telescope to IC 342, we obtained an image of the slit using an internal calibration lamp in order to determine the position of the slit on the detector. We then moved the slit out of the beam and acquired a direct image of IC 342 through the CVF (centered at ) using the imaging mode of CSHELL (in which a plane mirror substitutes for the grating). This image was used to accurately position the peak of IC 342 on the slit. Another image of the slit was acquired to insure that the object was positioned correctly. The adopted strategy of positioning the target using its near-IR light avoids possible pointing errors due to differential atmospheric refraction. Subsequent guiding was usually done using the visible light from the target, as observed with a CCD detector that is mounted behind a dichroic in the beam.
The CSHELL slit was rotated to a position angle of degrees (i.e, North-South) and the galaxy spectra were acquired at two different positions along the slit, separated by 12′′. Exposures of the nucleus of IC 342 were alternated with equal length exposures of an offset sky position (blank field) located 100–200′′ east. In this manner, we obtained 17 galaxy spectra during the course of the three nights with typical exposure times of 240–300s each, for a total of 4740s on-source. Flat field frames (obtained using the internal continuum lamp) and dark frames were acquired immediately after the exposures of IC 342 and at the same sky position. We also observed several A0 stars to allow correction for telluric absorption features, and four giant stars of spectral types K and M, for comparison to the galaxy spectrum in the kinematic analysis. At several times during each night we obtained spectra of internal Ar and Kr arc lamps, for use in wavelength calibration.
The data processing was carried out with standard two-dimensional spectral reduction routines in IRAF. We built flat-fields from the normalized, dark-subtracted continuum lamp spectra. These were used to flat-field all external-target exposures. The dark and sky contributions were then removed from each galaxy exposure by subtraction of the associated blank-field exposure. Before doing so, we had to scale each blank-field exposure to the sky level observed in the associated galaxy spectrum, to correct for temporal sky brightness variations. For the star observations we did not obtain blank field spectra, but instead, each star was observed at two different positions along the slit. Dark- and sky-contribution removal for these observations was achieved by differencing the two spectra for each star, with additional scaling where necessary. All star and galaxy exposures were then rebinned simultaneously in two dimensions, to calibrate the scales in both the wavelength and spatial directions; the wavelength rebinning was done linearly in , as appropriate for the kinematic analysis. The wavelength scale was calibrated using the known wavelengths of the emission lines in the arc lamp exposures, while the spatial tilt of the spectra on the detector was removed using the observations of stars at the various positions along the slit.
To correct the resulting calibrated spectra for telluric absorption features, we used observations of A0 stars at similar airmasses as those of the galaxy and velocity standards. The spectra of these stars are virtually featureless over the small spectral range available with CSHELL. Division of their spectra by the normalized spectrum of a black-body with a temperature of 9500 K, gives a good measure of the atmospheric absorption. The results were divided into the galaxy and template star spectra. All individual galaxy and star exposures were then co-added with cosmic-ray removal, and all resulting spectra were subsequently collapsed in the spatial direction to yield final one-dimensional spectra. In the latter step we co-added the central 5–7 spatial rows (1.0–1.4′′) of each two-dimensional spectrum (corresponding roughly to the seeing FWHM for the observations). The nuclear cluster of IC 342 is smaller than the seeing disk of the spectroscopic observations (cf. §3.1 and Figure 2b below), and collapsing its spectrum spatially therefore does not lead to loss of information. We did not perform a flux calibration on any of the spectra, since this is not required for the kinematic analysis.
Figure 1 shows the final reduced spectrum of the nuclear cluster of IC 342 (top), as well as the spectra of the four template stars that we observed for the kinematic analysis (bottom). The galaxy spectrum has a signal-to-noise ratio per spectral pixel, and that of the template spectra is several times higher. Whereas the of the galaxy spectrum is limited primarily by sky-noise, the of the template spectra is limited primarily by the noise in the observations of the atmospheric calibrators. Residual telluric absorption due to imperfect matches in airmass are present at levels up to 10 per cent. However, this is not critical for the kinematic analysis, since broadening of the template spectra with the modeled velocity distribution of the galaxy automatically smoothes away possible residual telluric features. We verified explicitly that the inferred velocity dispersion of IC 342 (see below) does not change significantly if galaxy spectra from individual nights are analyzed, or if the galaxy spectra are modeled with different template spectra. The results of this exercise confirmed that residual telluric absorption is not an important limiting factor in the analysis.
2.3 Kinematic analysis
Methods for stellar kinematic analysis assume that an observed galaxy spectrum is the convolution of a suitable template spectrum with the galaxy’s line-of-sight velocity distribution. Various methods exist to determine the best-fitting velocity distribution for given galaxy and template spectra (reviewed in, e.g., Binney & Merrifield 1998). Here we have used the ‘Gauss-Hermite Pixel Fitting Software’ of van der Marel (1994)111This software is available at http://www.stsci.edu/marel/software.html.. It parameterizes the velocity distribution as a Gauss-Hermite series (van der Marel & Franx 1993), and determines the best-fitting parameters using direct chi-squared minimization in pixel-space. The formal errors in the fit parameters follow from the shape of the chi-squared surface near its minimum. This method has been well tested, and its results agree with those from other methods for extracting stellar kinematics from galaxy spectra.
Our spectroscopic data on IC 342 have insufficient to determine the higher-order Gauss-Hermite moments of the velocity distribution, and we have therefore restricted the analysis to the determination of the parameters of the best-fitting Gaussian broadening function. The quantity measures the velocity difference between the galaxy and the template star. This can be used to infer the systemic velocity of the galaxy (if the template star velocity is known a priori), but this is of little interest here. The quantity is the ‘line-strength’ of the galaxy, or equivalently, the average ratio of the absorption line equivalent widths in the galaxy and those in the template star. For the four template stars that we have observed we find . This result, in principle, yields some information on the stellar population of the nuclear star cluster in IC 342. However, stellar population analyses from absorption line strengths are more suitably performed using lower spectral-resolution observations of a wider range of absorption systems, as was done in BFG97. We therefore restrict ourselves in the present paper to the quantity , which measures the line-of-sight velocity dispersion of the stars in the cluster. The chi-squared fit to the spectrum yields . The heavy solid curve in Figure 1 shows the corresponding best fit to the galaxy spectrum. For comparison, a heavy dashed curve shows the (unacceptable) fit when the velocity dispersion of the nuclear cluster is fixed to , whereas the stellar template spectra themselves correspond to (the instrumental dispersion). It is clear that the observed gradient at the (2–0) 12CO bandedge provides a sensitive measure of the stellar velocity dispersion broadening (as discussed previously in detail by, e.g., Gaffney, Lester & Doppmann 1995). Differences in the inferred obtained with different template stars were found to be at the level of . This is less than the random error on the inferred dispersion, and template mismatch is therefore not an important source of error in the analysis. In particular, we found no significant difference in the inferred for either a red supergiant or a red giant as the template star.
3 Modeling and Interpretation
3.1 HST surface brightness profile and ground-based photometry
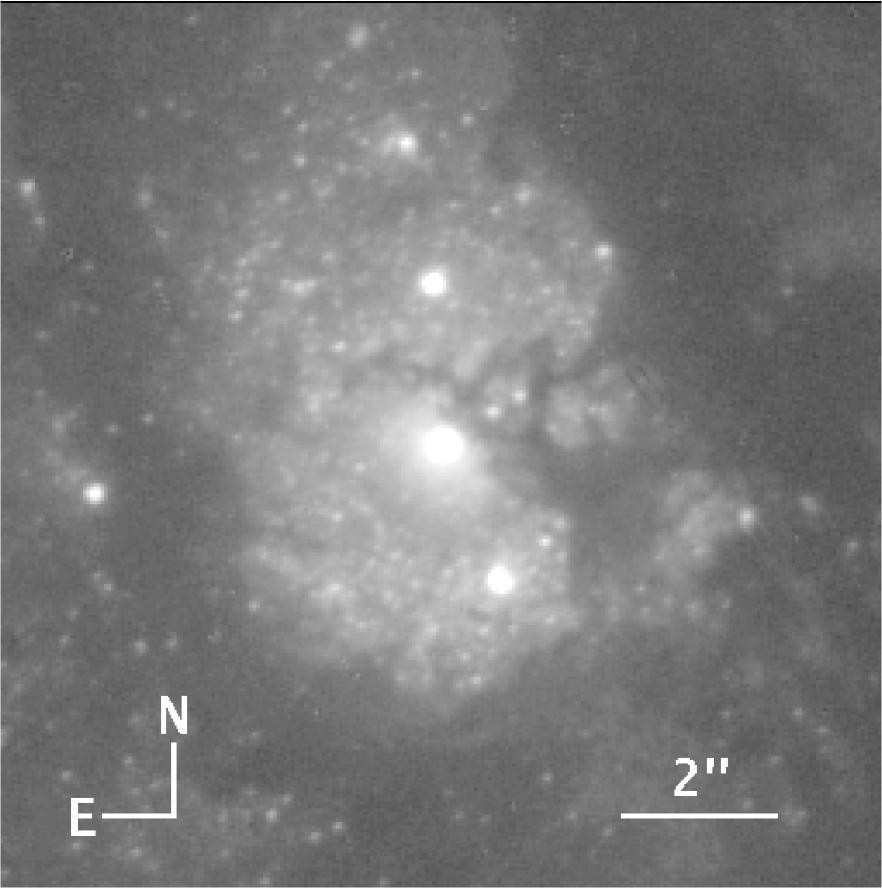
To properly interpret the velocity dispersion of the nuclear cluster, we also need to measure its spatial structure. We searched the HST Data Archive for images of IC 342, and found that broad-band images have been obtained with the Second Wide Field and Planetary Camera (WFPC2) in the filters F555W, F606W, F675W and F814W. Unfortunately, in all images the central parts of the nuclear cluster were found to be saturated. Of the images obtained with the PC chip which, with a pixel scale of 0.046′′, yields the highest spatial resolution, the ones least affected by saturation are two 80s exposures in the F606W filter. We concentrate on these images here. They were obtained by Illingworth and collaborators as part of Cycle 4 program GO-5446. We downloaded the pipeline-calibrated images, registered them, and combined them with cosmic-ray rejection. The resulting image of the nuclear region is shown in Figure 2b.
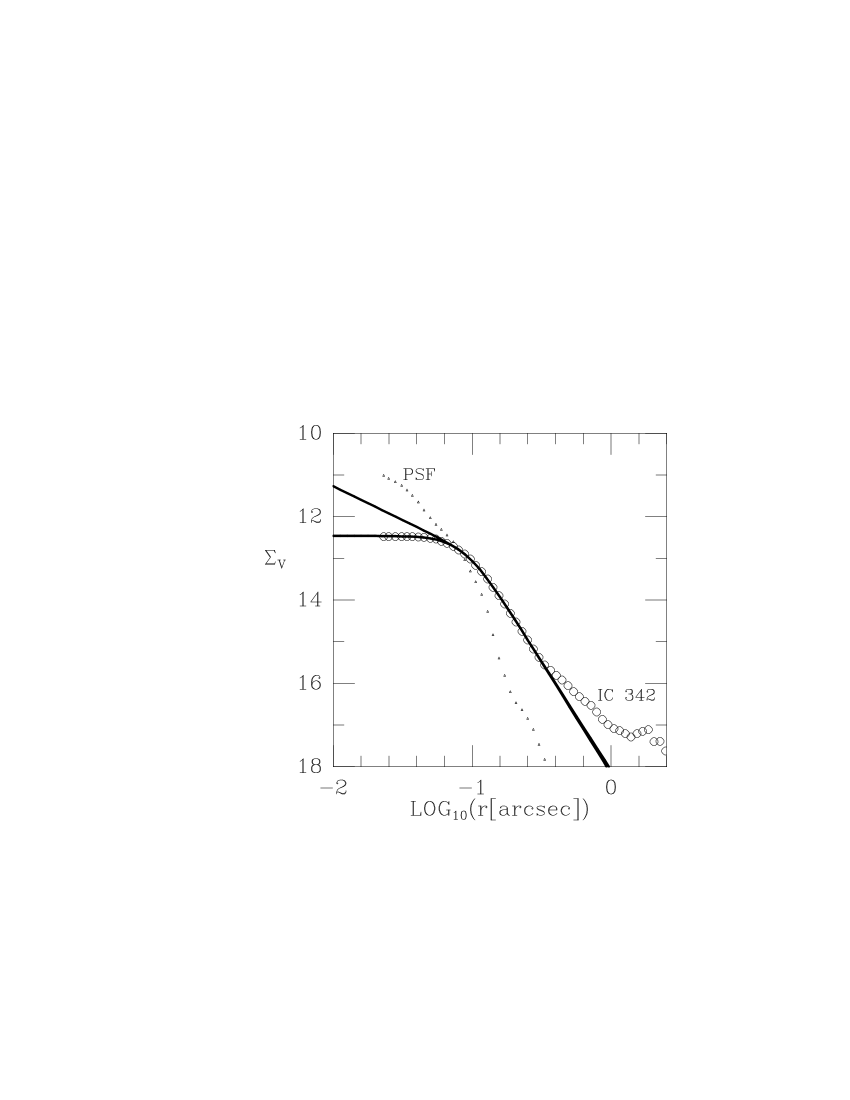
Figure 3 shows the major axis surface brightness profile of the nuclear star cluster as inferred by ellipse fitting to the observed isophotes. The fitting was performed using software found in the IRAF package STSDAS, which is based on the algorithm of Jedrzejewski (1987). Image counts were transformed to V-band magnitudes using the procedures described by Holtzman et al. (1995). Pixels at 0.08′′ are saturated at a level that corresponds to a surface brightness of mag/arcsec2, which causes an apparent flattening of the surface brightness profile at these radii. The figure also shows the PSF profile. Outside the radii affected by saturation, the galaxy profile is clearly more extended than the PSF. The nuclear cluster is therefore resolved.
For use in the dynamical modeling we fitted the observed surface brightness profile with a so-called ‘nuker-law’ parametrization (Lauer et al. 1995; Byun et al. 1996). Two fits are shown as heavy solid curves in Figure 3. The lower curve is a fit to the data at 0.3′′, including the saturated pixels. The upper curve is a fit over the same range, but excluding the saturated pixels at 0.08′′. The former model has a homogeneous core, whereas the latter model has a power-law surface brightness cusp similar to those typically found in the centers of elliptical galaxies (e.g., Faber et al. 1997). Both provide an acceptable fit to the available data.
Inspection of the ground-based K-band image (Figure 2a) at different stretches reveals that it shows most of the same features as the HST V-band image (Figure 2b), including the two clusters 2′′ to the North and South-South-West of the nuclear cluster. However, the lower spatial resolution of the K-band image makes all features more difficult to discern. The morphology of the diffuse background light in the K-band image is more symmetric than in the HST image, due to the smaller influence of dust absorption in the K-band.
From the NSFCam image we measured a total magnitude in a 1.2′′ diameter aperture centered on the nuclear cluster. To obtain the optical-infrared color of the nuclear cluster we convolved the HST image with a 0.7′′ FWHM Gaussian, and found that in a 1.2′′ diameter aperture at the same position. This implies for the average color of the nuclear cluster. The saturation of the HST image in the central few pixels does not provide a significant uncertainty in this measurement; use of the cusped nuker-law profile shown in Figure 3 (instead of the actual image) yields a value that is only modestly different, . In the remainder we adopt the average of these measurements, . In BFG97 we presented a K-band image of IC 342 obtained in 1′′ FWHM seeing. The K-band photometry and color inferred from our new image are completely consistent with the absolute photometry from that paper.
3.2 Dynamical modeling
We use our data to estimate the mass-to-light ratio of the nuclear stellar cluster in the K-band. The K-band light of the cluster is less sensitive to dust absorption than the V-band light, and can therefore be more accurately determined than . This is important, because the sightline towards IC 342 suffers from a considerable amount of extinction. In BFG97 we estimated , based on the observed color of the nucleus. With the Galactic interstellar extinction law of Rieke & Lebofsky (1985) this implies , which we will assume for the moment. In §3.3 we will discuss the extinction and its influence on our results in more detail.
We assume that the observed color of the cluster does not vary significantly over its (small) spatial extent. The combination of the V-band surface brightness profile inferred from the HST data, combined with and then yields the intrinsic unextinguished K-band surface brightness profile. The analysis then proceeds as in van der Marel (1994). The surface brightness profile is deprojected under the assumption of spherical symmetry, and the three-dimensional velocity dispersion profile is calculated by solving the Jeans equation for a spherical isotropic system. The results are then projected along the line of sight and convolved with the IRTF observational setup, to yield a prediction for the observed velocity dispersion. This dispersion scales as , and we determine the that produces the observed . For the homogeneous-core model in Figure 3 we infer , and for the cusp model (all mass-to-light ratios are given in units of ). Both results assume a distance to IC 342 of (McCall 1982; Madore & Freedman 1992; more on this in §3.4 below). The models show that the inferred is not particularly sensitive to the assumed behavior of the surface brightness profile at small radii, so the saturation of the HST images is not a great limitation in our analysis. In the following we adopt the average of the two inferred values as our best estimate: , where the error is the formal error in the determination due to the formal error in the velocity dispersion .
The mass-to-light ratio of the cluster is well-determined by the observations. However, this is less true for either the total light or the total mass of the cluster, given that the cluster blends smoothly into a diffuse background (cf. Figure 3). We have used two approaches to obtain rough estimates for these quantities. In the first approach, we start from the observed in a 1.2′′ diameter aperture. If the cluster were a point source then in 0.7′′ FWHM Gaussian seeing, the flux contained in a 1.2′′ aperture would be 86%. This is a strict upper limit, because the cluster is more extended than a point source. However, the HST data do show the cluster to be very compact, so 86% may be a reasonable estimate. Taking into account an extinction of , we find for the intrinsic cluster luminosity. At this corresponds to . Multiplication by yields . In the second approach, we have calculated the total luminosity (integrated out to infinity, and corrected for extinction) of the spherical model clusters that generate the model surface brightness profiles shown as solid curves in Figure 3. This yields for both the core and the cusp model. Multiplication by yields . It is likely that these estimates bracket the true cluster mass, which is therefore .
3.3 Population synthesis
The inferred of the nuclear stellar cluster yields a constraint on its age. Figure 4 shows the relation between and age for several model stellar clusters, as calculated with the ‘Starburst99’ software of Leitherer et al. (1999)222This software is available at http://www.stsci.edu/science/starburst99/.. Curves are shown for the same three standard assumptions for the initial mass function (IMF) used by Leitherer et al. All curves assume solar metallicity, and star formation in a single, instantaneous burst (continuous star formation models are discussed and dismissed below). Curves for different metallicities do not look markedly different (Leitherer et al. 1999). A general property of all these models is that increases strongly with time after years. The low value of inferred for the cluster in IC 342 therefore indicates that it must be rather young, .
The three IMF models in Figure 4 all have a lower-mass cutoff at . Stars with masses lower than this contribute little to the light output of clusters younger than Gyr. However, low-mass () stars may constitute a significant fraction of the total mass of the cluster. The curves in Figure 4 should therefore be regarded as lower limits. Given our observed constraint on the of the cluster, any addition of low-mass stars to the IMF will lower the inferred age. Since it is our aim here to confirm that the cluster is young, the neglect of low-mass stars is conservative.
The observed optical-infrared color of the nuclear cluster, , provides an additional constraint on stellar population models for the nuclear cluster. However, this constraint is more difficult to interpret, because of the large extinction-induced reddening in IC 342. The extinction towards IC 342 (galactic + internal) has previously been estimated to be magnitudes (McCall 1982; Madore & Freedman 1992). These estimates were obtained for regions between and 10 arcmin from the galaxy center. However, the dust absorption towards IC 342 is very patchy, and variable on scales as small as a fraction of an arcsecond (cf. Figure 2b). These previous extinction measurements can therefore not be confidently used to estimate the extinction of the light from the nuclear star cluster. Instead, we can estimate the extinction from the observed color , if we assume that the intrinsic color is known from stellar population models. One has . For the Galactic interstellar extinction law of Rieke & Lebofsky (1985), . Hence, . Figure 5 shows for the same stellar population models as in Figure 4. The predicted values range from to . This constrains to the range –, independent of the cluster age.
A more complete treatment involves simultaneous fitting of the observed and , as function of the two independent variables age and . This is done in Figure 6. Each panel corresponds to one of the three population models in Figures 4 and 5. The dotted curve in each panel shows, as function of cluster age, the value of for which the predicted of the population model matches the observations. The solid curve in each panel shows, again as function of cluster age, the value of for which the predicted of the population model matches the observations (i.e., , cf. §3.2). The points in the panels where the solid and dotted curves intersect indicate combinations of age and that fit both the observed color and mass-to-light ratio. The allowed combinations have ages in the range years, and in the range –. The latter range includes the value (i.e., ) from BFG97 that was adopted in §3.2.
In BFG97 we presented the equivalent widths of three prominent absorption lines in the H- and K-band spectra of the nucleus of IC 342, namely Si(), CO(6–3) at and CO(2–0) at . From these measurements we argued previously that the nucleus must be quite young. For completeness, we compare in Figure 7 the observed equivalent widths to the predictions for the same stellar population models as in Figures 4 and 5. The cluster ages implied by each of these measurements are fully consistent with those inferred from the observed and .
Figures 4–7 all show the evolution of stellar populations that formed in an instantaneous burst at . However, the star formation rate of the cluster in IC 342 need not necessarily have been a delta-function . Figure 8a shows the predicted for a model that has had a constant star-formation rate since (also from Leitherer et al. 1999). In such a model increases monotonically with cluster age after years, but much more gently than for an instantaneous burst model. As a consequence, the observed places a less stringent constraint on the cluster age. However, models with constant star-formation rate are ruled out for IC 342, because of the large observed equivalent width of the CO bandhead at . The measured value is so high that it can only barely be fit by any instantaneous burst population (cf. Figure 7c). Any extended star formation history mixes populations of different ages, and therefore predicts a lower maximum CO bandhead strength. This is illustrated in Figure 8b, which shows the predicted CO bandhead strength for a continuous burst model. The models cannot reproduce the observed value for any age. This argument can also be turned around: since an instantaneous burst model fits the observed value only for a range of ages that is years, the star formation in IC 342 must have occurred over a timescale shorter than this. Since the suspected cluster age ( years) exceeds this timescale by a large factor, the use of instantaneous burst models for IC 342 is justified.
3.4 Uncertainties and additional considerations
In this section we elaborate on the analysis presented in the preceding sections, and we highlight some of the sources of uncertainty in our conclusions.
Our dynamically inferred mass-to-light ratio for IC 342 is inversely proportional to the assumed galaxy distance. Historical distance estimates for IC 342 have ranged 1.5 to (Ables 1971; Sandage & Tammann 1974), due to differences in the assumed extinction. Detailed work by McCall (1989) convincingly supported a short distance of , and his results were supported by subsequent work (e.g., Madore & Freedman 1992; Karachentsev & Tiknonov 1993). However, IC 342 is a member of a nearby group that also includes Maffei 1 and 2, and at least 9 other galaxies (e.g., Tully 1988; Karachentsev et al. 1993). The surface brightness fluctuation method was used to determine a distance to Maffei 1 of (Luppino & Tonry 1993), while the Tully-Fisher relation was used to determine distances to the group members NGC 1560 and UGCA 105 of and , respectively (Krismer, Tully & Gioia 1995). The latter authors used this to argue for a distance of for the entire IC 342/Maffei group. If this is true, than our for IC 342 must be reduced by a factor 2. Figure 4 shows that this would imply an even younger age than inferred above.
It is likely that some uncertainty remains in our results due to dust extinction towards IC 342. However, we have minimized these uncertainties by performing our spectroscopic observations in the near-infrared. Also, the luminosity of the nucleus, which enters into the denominator of the inferred mass-to-light ratio, is based on our K-band image. The V-band HST image of Figure 2b was used in the mass-to-light ratio determination only to obtain the spatial distribution of the light, but not its total flux (which in the V-band is very sensitive to extinction). Nonetheless, even in the K-band there is some extinction, which affects the inferred and hence the implied age. The use of foreground screen models for the extinction law seems to be justified by the face-on orientation of IC 342 and the fact that most of the extinction is due the the disk of the Milky Way. Nonetheless, part of the extinction is likely to be intrinsic to IC 342, and may follow another extinction law. The extinction law for starburst galaxies inferred by Calzetti (1997) does not have the same as the Galactic value from Rieke & Lebofski (1985) used in Figure 6. However, errors in the inferred for IC 342 can not cause the inferred to be too low by more than a factor (corresponding to the case ). Figure 4 shows that this is too small to significantly affect the estimated age.
The fact that the HST image on which we base our analysis is saturated at small radii causes some uncertainty. However, as demonstrated in §3.2, the inferred differs by only 12% for the homogeneous-core and the cusp model in Figure 3. In principle, the real cluster profile could be even steeper at small radii than in our cusp model; it could be as steep as the PSF. This would decrease the from the derived value, because an increased cusp slope implies that there is more light (higher ), while the cluster also becomes more compact, which decreases ( according to the virial theorem). Therefore, a steeper cusp slope of the cluster would imply an even younger age than derived above.
So far we have assumed that the velocity distribution of the nuclear stellar cluster is isotropic. This is plausible, given that two-body relaxation in a cluster as dense as this will tend to remove any velocity anisotropy. However, if the cluster is indeed very young, then two-body relaxation may not have had sufficient time to operate. Therefore, we have also constructed models with anisotropic velocity distributions, to assess the influence of this on the inferred . As in §3.2, we have constructed the models by solving the Jeans equations. We find that the inferred increases monotonically with the ratio of the velocity dispersions in the tangential and radial directions (assumed to be independent of radius). However, the dependence on anisotropy is not large. A rather extreme radial anisotropy of decreases by 10% with respect to the isotropic model, whereas a similarly extreme tangential anisotropy increases by 10%. From Figure 4 it is clear that these uncertainties in due to the unknown velocity dispersion anisotropy are small enough to not significantly affect the inferred age. We note also that the nuclear star cluster may not be spherical. However, deviations from spherical symmetry are expected to influence the inferred only at the same (insignificant) level as does velocity anisotropy. We have therefore not attempted to construct axisymmetric dynamical models, which are significantly more complicated than the spherical models used here (e.g., Cretton et al. 1999).
The observed velocity dispersion of IC 342 also yields an upper limit on the mass of a possible central black hole. The largest possible black hole mass is obtained under the assumption that the stars themselves contribute no mass at all. In this case our isotropic Jeans models indicate that the observed requires for the homogeneous-core model in Figure 3 and for the cusp model. Therefore, any black hole in IC 342 must be less massive than these limits.
It is interesting to note in this context that the total luminosity of IC 342 is not much different than that of our own Galaxy (McCall 1979). However, our Galaxy harbors a black hole of (Eckart & Genzel 1997; Ghez 1998). IC 342 is an Scd spiral whereas our Galaxy is an Sbc spiral, so this is consistent with the accumulating evidence that galaxies with less massive bulges harbor less massive black holes (e.g., Kormendy & Richstone 1995; van der Marel 1999). If IC 342 does have a central black hole, then the of the stellar population would have to be smaller than inferred above, implying a younger age (cf. Figure 4).
4 Discussion and Conclusions
We have obtained high-resolution CO-bandhead spectra of the nuclear stellar cluster in IC 342 with the IRTF, from which we derive a velocity dispersion . To interpret this result we have constructed dynamical models for the cluster in which the light distribution is derived from an HST V-band image from the HST Data Archive, combined with new ground-based K-band imaging. The models yield for the mass-to-light ratio of the cluster, and for the cluster mass. Stellar population models for the observed , the observed color, and the observed near-infrared absorption line equivalent widths from BFG97 all consistently indicate that the cluster age is in the range years. The K-band extinction towards the nucleus is inferred to be in the range –. A variety of minor uncertainties in our observations and analysis cannot significantly alter these conclusions.
In §1 we discussed the recent changes in our understanding of the structural properties of the centers of spiral galaxies. We now know that many/most intermediate and late type spirals have exponential bulges with nuclear stellar clusters in their centers. Carollo (1999) suggests that both these components could have formed through secular evolution within pre-existing disks. The nuclear stellar clusters in particular could have formed as a result of gas flow to the nucleus, initiated by torques from a nuclear bar. Once formed, the nuclear stellar clusters observed in spirals are massive enough to disrupt any existing nuclear bar, and also to prevent any new bars from forming. In this picture, the formation of a nuclear stellar cluster itself shuts off any further gas flow into the center. As a result, nuclear cluster formation happens only once. One consequence of this scenario is that the nuclear clusters in spiral galaxies would have to display a large range of ages, given that at least some spiral galaxies are several Gyrs old (as structural entities), and assuming that we are not viewing all spiral galaxies at a special epoch. Carollo (1999) finds that the most luminous nuclear star clusters () are found in galaxies that display a HII-region-like or AGN-like spectrum at ground-based resolution, whereas the less luminous clusters () do not generally show these characteristics in their spectra. Although the mass function of nuclear clusters is as of yet unconstrained, and although dust extinction and non-thermal emission are likely to affect their optical light, it is plausible that, in general, bright clusters are younger than faint clusters. This is consistent with the fact that typical stellar populations fade by several magnitudes in V as they age (Bruzual & Charlot 1993). IC 342 provides a unique opportunity to break the age-mass degeneracy, since it is the one galaxy for which an explicit age determination is now available.
Figure 9 presents a histogram of nuclear stellar cluster luminosities for the combined galaxy sample of Carollo, Stiavelli & Mack (1998), kindly provided to us by Marcella Carollo. The absolute cluster magnitudes range approximately from to (, cf. Holtzmann et al. 1995). Our best-fitting extinction-corrected models for IC 342 indicate , under the assumption that . IC 342 has an enhanced star formation rate (e.g., BFG97), consistent with Carollo’s finding that this is generally the case in galaxies with nuclear clusters for which . Figure 9 shows that IC 342 clearly falls at the high end of the luminosity distribution of the nuclear clusters detected in other galaxies (and even more so if IC 342 is more distant than assumed here). The results from our detailed study indicate that the cluster in IC 342 is young, and stellar population models predict that clusters fade in luminosity as they grow older. Therefore, if the nuclear clusters in this sample all have similar masses, then most clusters would have to be older than the one in IC 342. To get a more quantitative estimate of the age distribution we have used the single-burst, Salpeter IMF stellar population models of Bruzual & Charlot (1993). Under the (very simplifying) assumption that all observed nuclear clusters have the same mass as the one in IC 342, and differ only in age, the age can be calculated directly from the observed luminosity. The labels at the top of Figure 9 indicate the ages thus calculated for each luminosity bin. Under these simple assumptions most clusters are inferred to be several Gyrs old, which seems entirely plausible. This is an interesting result, but is of course not a unique interpretation of the observed cluster luminosity histogram. The faint clusters could just be less massive than the cluster in IC 342, instead of being older. This must in fact be the case for the very low-luminosity clusters with , which are too faint to be faded analogs of the IC 342 cluster for any assumed age.
The results from Figure 9 indicate that the nuclear clusters in spiral galaxies need not all be as young as the one in IC 342. This is what one would expect if spiral galaxies do indeed have only one episode of nuclear cluster formation, unless we are viewing all spiral galaxies at the same special time in their evolution. Nonetheless, we may be seeing too many young clusters for this scenario to be acceptable. If nuclear cluster formation in spirals is a Poisson process with fixed probability per unit time, we would expect to see clusters with ages of , and years in the ratio . The results in Figure 9 suggest that this is not the case, and that there is a higher fraction of young clusters than expected in this scenario. This is consistent also with an inspection of just the four closest spiral galaxies. Our Galaxy has a young central cluster that is just years old (Krabbe et al. 1995; Najarro et al. 1997), M31 and M33 have blue nuclei when viewed at HST resolution that are quite possibly young star clusters (Lauer et al. 1998), and IC 342 has a cluster that is years old.
To explain the high incidence of young star clusters we may have to invoke scenarios in which nuclear cluster formation is a recurrent process. Unfortunately, our observations do not provide any strong arguments for or against this possibility. The equivalent width (EW) of the CO bandhead at provides some constraints on the presence of an old underlying population (see also the discussion on continuous star formation at the end of §3.3), but these are not very strong. For example, if another instantaneous burst happened in the nucleus of IC342 with the same stellar mass content, but yrs ago, its K-band light would be about 3 magnitudes fainter than that of the currently observed young population (Bruzual & Charlot 1993). Because of the small contribution to the K-band continuum, the old cluster does not significantly dilute the CO equivalent width: , where is the fraction of the total light contributed by the old cluster. For the example above, this yields only a 6% decrease in the observed equivalent width, which is not inconsistent with the observations. Under these assumptions, the young cluster’s mass and hence its mass-to-light ratio plotted in Figure 4 would be lower by a factor of two, still consistent with the models.
To make progress along these lines, it will be necessary to perform detailed studies of the nuclear star clusters in many more spiral galaxies. A direct determination of the age and mass distribution of the nuclear clusters will be required to determine whether the formation of the nuclear clusters in spiral galaxies is a recurring phenomenon or not, and how, if at all, these clusters are related to the secular evolution of the exponential bulges in which they reside.
References
- Ables (1971) Ables, H. D. 1971, Publ. U.S. Naval Obs., 20, Part IV, 1
- Andredakis & Sanders (1994) Andredakis, Y. C., & Sanders, R. H., 1994, MNRAS, 267, 283
- Andredakis, Peletier & Balcells (1995) Andredakis, Y. C., Peletier, R. F., & Balcells, M., 1995, MNRAS, 275, 874
- Becklin et al. (1980) Becklin, E. E., Gatley, I., Matthews, K., Neugebauer, G., Sellgren, K., Werner, M. W., Wynn-Williams, C. G. 1980, ApJ, 236, 441
- Binney & Merrifield (1998) Binney, J. J., & Merrifield, M. R. 1998, Galactic Astronomy (Princeton: Princeton University Press)
- Böker et al. (1999) Böker, T., et al. 1999, ApJS, in press
- Böker et al. (1997) Böker, T., Förster-Schreiber, N. M., & Genzel, R. 1997b, AJ, 114, 1883 (BFG97)
- Bruzual & Charlot (1993) Bruzual, A., Charlot, S. 1993, ApJ, 405, 538
- Byun et al. (1996) Byun, Y.-I., et al. 1996, AJ, 111, 1889
- Calzetti (1997) Calzetti, D. 1997, AJ, 113, 162
- Carollo et al. (1997) Carollo, C. M., Stiavelli, M., de Zeeuw, P. T., & Mack, J. 1997, AJ, 114, 2366
- Carollo & Stiavelli (1998) Carollo, C. M., & Stiavelli, M. 1998, AJ, 115, 2306
- Carollo, Stiavelli, & Mack (1998) Carollo, C. M., Stiavelli, M., & Mack, J. 1998, AJ, 116, 68
- Carollo (1999) Carollo, C. M. 1999, ApJ, submitted
- Courteau, de Jong & Broeils (1996) Courteau, S., de Jong, R. S., & Broeils, A. H., 1996, ApJ, 457, L73
- Cretton et al. (1999) Cretton, N., de Zeeuw, P. T., van der Marel, R. P., Rix, H.-W. 1999, ApJ, submitted
- Eckart & Genzel (1997) Eckart, A., & Genzel, R. 1997, MNRAS, 284, 576
- Faber et al. (1997) Faber, S. M., et al. 1997, AJ, 114, 1771
- Gaffney, Lester, & Doppmann (1995) Gaffney, N. I., Lester, D. F., & Doppmann, G. 1995, PASP, 107, 68
- Ghez et al. (1998) Ghez, A. M., Klein, B. L., Morris, M., & Becklin, E. E. 1998, ApJ, 509, 678
- Greene et al. (1993) Greene, T. P., Tokunaga, A. T., Toomey, D., & Carr, J. 1993, Proc. SPIE, 1946, 313
- Ho, Filippenko, & Sargent (1997) Ho, L. C., Filippenko, A. V., & Sargent, W. L. W. 1997, ApJ, 487, 568
- Holtzman et al. (1995) Holtzman, J. A., Burrows, J., Casertano S., Hester, J. J., Trauger J. T., Watson, A. M., Worthey, G. 1995, PASP, 107, 1065
- Ishizuki et al. (1990) Ishizuki, S., Kawabe, R., Ishiguro, M., Okumura, S. K., Morita, K.-I., Chikada, Y., & Kasuga, T. 1990, Nature, 344, 224
- Jedrzejewski (1987) Jedrzejewski, R. I. 1987, MNRAS, 226, 747
- Karachentsev & Tiknonov (1993) Karachentsev, I. D., Tiknonov N. A. 1993, A&AS, 100, 227
- Karachentsev et al. (1997) Karachentsev, I. D., Drozdovsky, I., Kajsin, L. O., Takalo, P., Heinamaki P., & Valtonen, M. 1997, A&AS, 124, 559
- Kormendy & Richstone (1995) Kormendy, J., & Richstone, D. 1995, ARA&A, 33, 581
- Krabbe et al. (1995) Krabbe, A. 1995, ApJ, 447, L95
- Krismer et al. (1995) Krismer, M., Tully, B. R., & Gioia, I. M. 1995, AJ, 110, 1584
- Lauer et al. (1995) Lauer, T. R., et al. 1995, AJ, 110, 2622
- Lauer et al. (1998) Lauer, T. R., Faber, S. M., Ajhar, E. A., Grillmair, C. J., & Scowen, P. A. 1998, AJ, 116, 2263
- Leitherer et al. (1999) Leitherer, C., et al. 1999, ApJ, in press [astro-ph/9902334]
- Luppino & Tonry (1993) Luppino, G. A., Tonry, J. L. 1993, ApJ, 410, 81
- Madore & Freedman (1992) Madore, B. F. & Freedman, W. L. 1992, PASP, 104, 362
- McCall (1989) McCall, M. L. 1989, AJ, 97, 1341
- Najarro et al. (1997) Najarro, F., Krabbe, A., Genzel, R., Lutz, D., Kudritzki, R. P., & Hillier, D. J. 1997, A&A, 325, 700
- Newton (1980) Newton, K. 1980, A&A, 191, 169
- Rieke & Lebofski (1985) Rieke, G. H., & Lebofsky, M. J. 1985, ApJ, 288, 618
- Sandage & Tammann (1974) Sandage, A., & Tammann, G. A. 1974, ApJ, 194, 559
- Shure et al. (1994) Shure, M. A., Toomey, D. W., Rayner, J. T., Onaka, P., & Denault, A. J. 1994, Instrumentation in Astronomy VIII, eds. D. L. Crawford, & E. R. Craine, proc. SPIE, 2198, 614
- Tokunaga et al. (1990) Tokunaga, A. T., Toomey, D., Carr, J., & Hall, D. N. B. 1990, Proc. SPIE, 1235, 131
- Tully (1988) Tully, R. B. 1988, Nearby Galaxies Catalog (New York: Cambridge University Press)
- Turner & Ho (1983) Turner, J. L., & Ho, P. T. P. 1983, ApJ, 178, 623
- Turner & Hurt (1992) Turner, J. L., & Hurt, R. L. 1992, ApJ, 384, 72
- van der Marel (1994) van der Marel, R. P. 1994, MNRAS, 270, 271
- van der Marel & Franx (1993) van der Marel, R. P., & Franx, M. 1993, ApJ, 407, 525
- van der Marel (1999) van der Marel, R. P. 1999, AJ, 117, 744
- Wyse, Gilmore & Franx (1997) Wyse, R. F. G., Gilmore, G., & Franx, M., 1997, ARAA, 35, 637