11.02.1;11.02.2:BL Lacertae;11.02.2:1ES 2344+51.4;13.07.2
Now at Forschungszentrum Karlsruhe, P.O. Box 3640, D-76021 Karlsruhe, Germany
Now at Enrico Fermi Institute, University of Chicago, 933 East 56th Street, Chicago, IL 60637, U.S.A.
Now at Universidad Autónoma de Barcelona, Instituto de Física d’Altes Energies, E-08193 Bellaterra, Spain
On leave from: Altai State University, Dimitrov Street 66, 656099 Barnaul, Russia
Now at LPNHE, Universités Paris VI-VII, 4 place Jussieu, F-75252 Paris Cedex 05, France
C. Renault (rcecile@in2p3.fr)
HEGRA search for TeV emission from BL Lac objects
Abstract
The HEGRA system of four Imaging Atmospheric Cherenkov Telescopes (IACTs) has been used to extensively observe extragalactic objects. In this paper we describe the search for TeV emission from nine very promising potential TeV sources, namely eight “high frequency” BL Lac objects (HBLs), and the object “BL Lacertae” itself. These objects were observed during 1997 and 1998 seasons, with total integration times ranging between one and fifteen hours. No evidence for emission was found from any of these objects and the upper limits on the integral energy flux above 750 GeV are on the level of a few times 10-12 erg cm-2 s-1. For the two objects BL Lacertae and 1ES 2344+51.4, we discuss the astrophysical implications of the TeV flux upper limit, using also information from the X-ray and -ray bands as measured with the All Sky Monitor (ASM) of RXTE (1.3-12.0 keV) and with EGRET (30 MeV - 20 GeV).
keywords:
BL Lacertae : general; BL Lac; 1ES2344+51.4; gamma rays: observations1 Introduction
The phenomenology of BL Lac objects has led to a classification of these sources into two sub-populations: high-frequency BL Lac objects (HBLs) and low-frequency ones (LBLs) (see e.g. Fossati et al. 1998). The HBL objects have synchrotron and Compton peaks at relatively high energies (Ghisellini et al. 1998), and thus are good candidates for TeV emission. With the HEGRA system of IACTs the significant detection (e.g. 3 ) of a flux comparable to the flux from the Crab nebula takes less than 15 minutes for sources close to zenith position. The BL Lac observations presented in this paper are thus sufficient to probe energy fluxes down to the level of 10-12 erg cm-2 s-1 ( GeV).
The two BL Lac objects Mkn 501 and Mkn 421 are well established and well studied TeV sources. Mkn 501 showed during 1997 spectacular outbursts with diurnal flux levels reaching 10 Crab units (e.g., Aharonian et al. 1999a, Samuelson et al. 1998, Djannati et al. 1999) and with a spectrum extending up to at least 16 TeV (Aharonian et al. 1999b). For a better understanding of the intrinsic properties of this class of sources and for determining the amount of intergalactic extinction of the TeV photons due to pair production processes with the Cosmic Infrared Background radiation (CIB) photons, the detection of further BL Lac objects is of utmost importance. Thus the search and the detailed study of new extragalactic TeV sources is one of the major objectives of the HEGRA experiment.
The paper is organized as follows: We describe the data samples used in the analysis in Section 2 and the method used for computing flux upper limits in Section 3. The extinction by the CIB is discussed in Section 4, and in Section 5 we give the experimental results. In Section 6 and 7 we focus on two objects: (1) 1ES 2344+51.4 detected during December 1995 by the WHIPPLE Cherenkov telescope (Catanese et al. 1997), and BL Lacertae which, in July 1997, showed a strong flare detected in gamma-ray by EGRET, in the visible (Bloom et al. 1997; Madejski et al. 1999) and in X-ray wavelengths. A strategy to optimize the search for new extra-galactic sources is briefly outlined in Section 8, and the conclusions are given in Section 9.
2 Data
The HEGRA experiment, located on the Canary Island La Palma at the Observatorio del Roque de los Muchachos (2200 m a.s.l., 28.75∘N, 17.89∘W), consists of several arrays of particle and Cherenkov-detectors dedicated to cosmic ray research (Lindner 1997, Barrio et al. 1998).
Before September 1998, the CT-System consisted of four, (now it consists of five) telescopes with 8.5 m2 mirror area each. Each telescope is equipped with a 271 pixel camera with a pixel size of 0.25∘, covering a field of view of 4.3∘. The cameras are read out by 8 bit 120 Mhz Flash-ADC systems. Details about the CT-system and the performance of the stereoscopic air shower observation method are given by (Daum et al. 1997) and (Aharonian et al. 1999a).
Table 1 summarizes the observations and redshifts of the nine BL Lac objects considered in this work. The first 7 objects with right ascension 9 h have been observed during October and November 1997. The data have been taken with only 3 telescopes in the system because the telescope CT4 was not operational from October 16 to November 15 1997. The last two sources have been observed with the 4-CT system, BL Lacertae in July/August 1997 and May/June 1998 and 1ES 2344+51.4 in December 1997.
| Name | MJD | Hours | |||
| 1ES0145+13.8 | .125 | 50779.9 | 1.1 | 15.6 | 3 |
| 1ES0219+42.8 | .444 | 50752.1 | 1.3 | 19.6 | 3 |
| 1ES0229+20.0 | .139 | 50782.9 | 1.3 | 13.8 | 3 |
| 1E0317.0+1834 | .19 | 50782.0 | 1.3 | 12.5 | 3 |
| 50777.1 | 1.0 | 28.6 | 3 | ||
| 1ES0414+00.9 | .287 | 50783.1 | 1.3 | 28.6 | 3 |
| 50787.0 | 0.9 | 28.0 | 3 | ||
| 1ES0647+25.0 | ? | 50780.1 | 0.6 | 6.3 | 3 |
| 50782.2 | 2.0 | 25.8 | 3 | ||
| 50783.1 | 4.0 | 30.5 | 3 | ||
| 2E0829.1+0439 | .18 | 50784.1 | 4.1 | 31.0 | 3 |
| 50785.1 | 2.4 | 26.7 | 3 | ||
| 50787.2 | 2.0 | 26.3 | 3 | ||
| 50659.1 | 1.4 | 14.7 | 4 | ||
| 1ES2200+42.0 | .069 | 50660.1 | 2.4 | 16.3 | 4 |
| in 1997 | 50662.1 | 1.4 | 22.9 | 4 | |
| 50663.1 | 2.1 | 21.6 | 4 | ||
| (BL Lacertae) | 50669.0 | 0.9 | 16.8 | 4 | |
| 50673.1 | 1.0 | 15.3 | 4 | ||
| 50962.2 | 0.6 | 40.8 | 4 | ||
| 1ES2200+42.0 | 50963.2 | 1.7 | 37.3 | 4 | |
| in 1998 | 50964.2 | 1.7 | 36.9 | 4 | |
| 50965.2 | 1.4 | 34.4 | 4 | ||
| 50804.9 | 2.4 | 34.5 | 4 | ||
| 50805.9 | 2.4 | 33.3 | 4 | ||
| 50806.9 | 1.7 | 37.5 | 4 | ||
| 1ES2344+51.4 | .044 | 50807.9 | 2.7 | 36.2 | 4 |
| 50808.9 | 2.0 | 34.2 | 4 | ||
| 50809.9 | 2.0 | 36.3 | 4 | ||
| 50810.9 | 2.0 | 35.1 | 4 | ||
| 50812.8 | 0.6 | 31.4 | 4 |
3 Upper limits in Crab units and in flux units
In the following analysis, measured fluxes or flux upper limits are first determined in Crab units and are only subsequently converted into absolute flux values or flux upper limits. Results in Crab units have the advantage of relying exclusively on measured data and of being free from systematic errors due to the Monte Carlo simulations of the air showers and the detector response. Moreover, as several Bl Lac objects have been observed with only three telescopes in the CT-system, we can directly compare their observations to Crab data taken under the same conditions, at the same epoch, avoiding thus specific simulations. The trigger rate is constant within 5% for a given zenith angle (Aharonian et al. 1999a), thus no strictly simultaneous data can be compared safely.
For each source and each zenith angle interval the number of events in the ON-source region (), the number of events in the OFF-source region (), and the observation time is determined. To maximize the statistics the analysis is based on “loose” cuts: the mean scaled width of the showers (Konopelko 1995; Daum et al. 1997) has to be smaller than 1.2 (to retain 80% of photon induced showers) and the squared angular distance of the reconstructed shower direction from the source direction has to be smaller than 0.05 deg2. For each time period of fixed experimental conditions, a reference Crab data sample was analyzed (compare Table 2) and the numbers , , and were determined for all zenith angle intervals. As Crab observations with three telescopes have been performed only for several days, the flux upper limits derived with this reference data are considerably higher than for the data with 4 telescopes in the system.
Using the probability density function of the number of source events, we compute the upper limit of the number of counts from hours of source observations at 99% confidence level (Helene 1983). Similarly, we calculate the lower limit of the number of counts for hours of Crab observations. We compute the upper limit in Crab units from: .
The energy threshold is computed by Monte-Carlo for each source as a function of the mean zenith angle of the object during the observations. For the CT-system, the energy threshold scales with zenith angle roughly as (Konopelko et al. 1998). Only data with good weather conditions are used and phototube voltage fluctuations are corrected.
| MJD of the Crab observations | hours |
|---|---|
| 3 telescopes | |
| 50747 to 50750, 50760, 50777, 50778 | 15h40 |
| 4 telescopes | |
| 50721, 50731, 50732, 50788, 50789, 50806, 50831 | |
| 50809 to 50811, 50835 to 50837, 50864 to 50866 | 54h45 |
| 50869, 50872 to 50874, 50891 to 50893, 50902 |
Assuming a source energy spectrum, the conversion of upper limits
in Crab units into upper limits in absolute flux units is straightforward.
In the following we use two slopes for observed source spectrum:
dN/dE , as measured for the Crab nebulae around 1 TeV
(Konopelko et al. 1998) and a steeper one
dN/dE .
Above 0.5 TeV, the integral Crab flux is
= cm-2s-1.
In the other case, we normalise the flux in order to get the same
integral flux in this range.
The upper limits on the integral flux are then computed from:
, and
.
4 Correction for intergalactic absorption
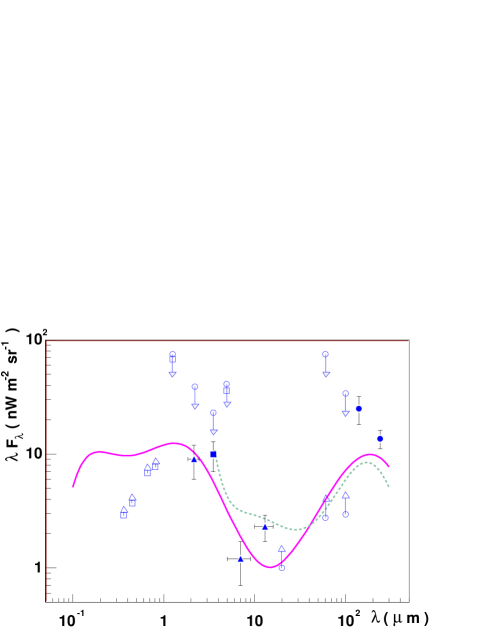
Interaction of TeV gamma-rays with intergalactic infrared photons by pair production processes probably modifies substantially the intrinsic TeV spectrum emitted by the source (Nikishov 1962; Gould & Schreder 1965; Stecker et al. 1992). The most important domain for us is 1-10 m as these photons can interact with TeV gamma-rays around the HEGRA threshold. The curve in Fig. 1 presents upper limits and measurements in relative agreement with recent modelling of CIB (Malkan & Stecker 1998; Primack et al. 1999). Gamma photons below 2 TeV effectively interact only with CIB photons below few m, so only Primack models can be used. As the purpose of this section is to confirm ideas, we choose the LCDM cosmology model (cosmological constant + cold dark matter) which gives higher density and is therefore more conservative than the HCDM one (hot+cold dark matter).
For a non-evolving CIB density according to this model, the amount of absorption for 0.1 to 20 TeV photons is shown in Fig. 2 for three of the studied BL Lac objects. Strictly speaking, the CIB energy density depends on redshift due to evolutionary effects, which are not well known. However, the redshift dependence could be neglected for redshifts lower than 0.15 since we do not expect significant evolution on very short time scales.
Between 500 GeV and 1 TeV, 25% of the flux is absorbed even for a source as close as Mkn 501 with z=0.034; for the source 2E0829.1+0439 with a redshift of 0.18, this percentage rises to 75%. The figure shows that the CIB absorption becomes very large for objects with redshifts above .

5 Experimental results
The observations described in this paper do not reveal positive evidence for VHE emission from any of the nine studied sources. Table 3 summarizes the upper limits in Crab units , the mean energy thresholds of the observations, and the upper limits on the integral fluxes, assuming the two different slopes for the spectrum, above the energy threshold with and without correction of the absorption by the CIB (Primack LCDM model). The threshold being defined as the product of the acceptance of the detector and the source gamma-ray spectrum, it effectively depends on the slope of the gamma-ray flux. So the table give thresholds for the Crab slope (-2.6), and an effective threshold 30% lower is used for computation of the steeper model.
All upper limits have a confidence level of
99%. As mentioned above, the flux upper limits in Crab units
are free from systematic errors.
The major systematic uncertainty of the upper limits
in absolute flux units derives from a 15% uncertainty
in the energy scale of the CT-System. This 15% uncertainty
translates into a flux uncertainty of approximately 20% and 40%
for a integral source spectral index of -1.6 and -2.6
respectively.
Upper limits of a few times cm-2 s-1 are
obtained after a few hours of observation.
The correction of the absorption by the CIB of Fig.1
(computed up to 3 TeV)
increases the upper limits by a factor of 2 to 60 (for a slope of -2.6)
depending on the effective threshold and the source redshift.
Of course the effect of the CIB absorption makes the observed spectrum steeper and then the impact of a very hard intrinsic spectrum is attenuated (upper limits for the two slopes are less different after absortion than before). We note that the upper limits are derived from assumed slopes for spectra and a model for the CIB intensity. These uncertainties make upper limits rather qualitative.
| (a) | (b) | (c) | (d) | (e) | ||
|---|---|---|---|---|---|---|
| R.A. | ||||||
| 0145 | 580 | .23 | 9.3 | 24.2 | 42.1 | 71.9 |
| 0219 | 630 | .40 | 14.2 | 30.5 | 6306.3 | 4251.8 |
| 0229 | 540 | .25 | 11.4 | 35.1 | 58.9 | 106.9 |
| 0317 | 530 | .42 | 19.7 | 63.8 | 195.1 | 296.4 |
| 0414 | 910 | .65 | 12.8 | 13.5 | 789.7 | 602.0 |
| 0647 | 510 | .31 | 15.5 | 54.4 | ? | ? |
| 0829 | 840 | .14 | 3.1 | 3.8 | 37.1 | 35.6 |
| 2200a | 580 | .11 | 4.5 | 11.6 | 9.8 | 20.7 |
| 2200b | 870 | .15 | 3.2 | 3.6 | 7.4 | 8.4 |
| 2344 | 990 | .10 | 1.7 | 1.6 | 2.8 | 2.7 |
6 BL Lacertae (1ES 2200+42.0)
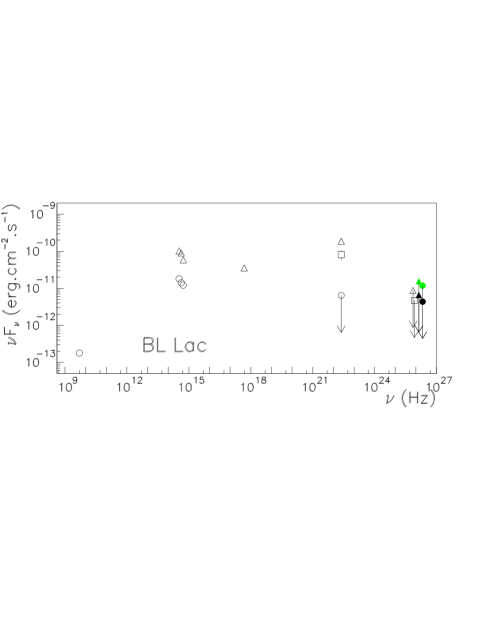
Several experiments extensively observed this source following the detection of a strong flare by EGRET in the -ray regime (only several hours observation time) and simultaneously in the optical regime around July 19th, 1997 (MJD 50648) (Bloom et al. 1997; Madejski et al. 1999). Because this flare occurred during a full moon period, the TeV observations started only about ten days after the detection of the flare. Our observations yielded a flux upper limit of ph cm-2 s-1 (580 GeV). The CAT group obtained a similar upper limit: ph cm-2 s-1 (11% of the Crab) (300 GeV) (Barrau, private communication). Earlier measurements at VHE energies were performed in 1995 with the Whipple telescope following a weak flare detected by EGRET with an integral -ray flux of ph cm-2 s-1 (100 MeV), i.e. three times lower than the flux of the July, 1997 flare. The Whipple observations (40 h) yielded a flux upper limit of 5.3 10-12 ph cm-2 s-1 (350 GeV) (Catanese et al. 1997). The results from the three VHE experiments HEGRA, CAT, and Whipple are shown in Fig. 4.
Information about the X-ray activity between February 1996 and August 1998 in the energy region 2-12 keV is provided by the All Sky Monitor (ASM) on board the Rossi X-Ray Timing Explorer (RXTE) (Remillard 1997). We determined the ASM count rates from the “definitive” results obtained through analysis of the processed data by the RXTE ASM team at MIT; data have a dwell duration larger than 30 seconds and a flux fit with a reduced -value below 1.5. The light curve is extracted using the “ftools 4.0” package. Unfortunately, the mean count rates are very low, i.e. typically around - Hz and the observation frequency is less 1 “run” of 90 seconds per hour, making it difficult to get information about the source activity on time scales as short as one day. So data are binned in 5 week bins, yielding flux estimates with acceptable statistical errors.
The light curve is shown in Fig. 3. A pronounced luminosity increase during June 1997 followed by a slow decrease during the following 5 months can be recognized. HEGRA data were taken in July/August 1997 when the source was still active. In 1998, Bl Lacertae was in a low X-ray activity.

Note that EGRET was able to detect the source, and the TeV instruments were not. Intriguingly in the case of Mkn 501 the opposite happened: the source was bright in the TeV energy regime but could hardly be detected at MeV/GeV energies.
Model calculations by Böttcher & Bloom (1998) and Madejski (1999) predict TeV flux significantly higher than the upper limits obtained by HEGRA (and also by CAT at the same period). We explain the non-detection at VHE energies by two reasons. First, the absorption by a CIB density as in Fig. 1 reduces the observable flux by about 50%. Secondly, the HEGRA measurements were taken roughly 10 days after the detection of the GeV-flare. Taking into account the strong variability observed in the two BL Lac objects Mkn 501 and Mkn 421, the VHE flux of BL Lacertae could have easily decreased by a factor of 5 in 10 days.
7 1ES 2344+51.4
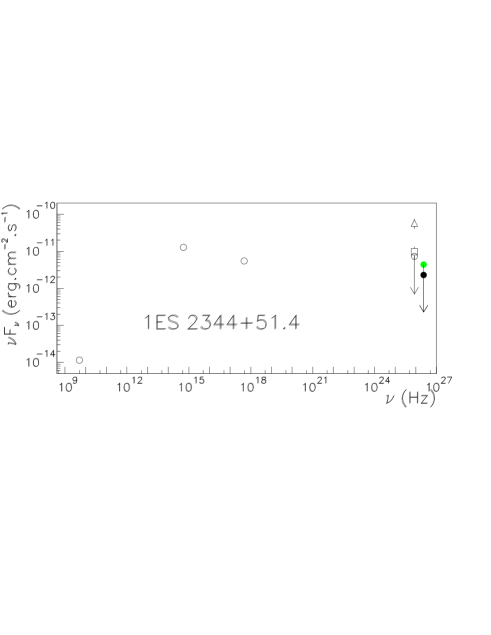
The spectral energy distribution of 1ES 2344+51.4 is shown in Fig. 6. This source was observed by the Whipple group during the winter months of 1995/96 and 1996/97 (Catanese et al. 1998). Whipple detected a flare on December 20th 1995 with a flux of 6.6 ph cm-2 s-1 ( 63% of the Crab); the mean flux (excluding the flare emission) during the first winter was estimated as 1.1 ph cm-2 s-1 (11% of the Crab). For the period 96-97 an upper limit of 8.2 ph cm-2 s-1 (8% of the Crab) was reported (all integral fluxes above 350 GeV).
The flux limit computed from the 1997/1998 HEGRA CT-system data is 2.9 ph cm-2 s-1 ( 1 TeV). The smooth curve in the 2-10 keV band (Fig. 5) indicates that the source has been in a low and stable state for 1.5 years. The source was not monitored by the ASM during the winter 1995/1996, therefore, unfortunately, the 2-10 keV activity during the state of VHE-emission could not be examined.

8 Observational strategy
It is widely believed, that TeV gamma-rays of BL Lac objects are produced by ultra-relativistic electrons, which emit synchrotron radiation in the keV band and produce the TeV photons due to Inverse Compton scattering of soft target photons (e.g., Ghisellini et al. 1998). The X-ray activity of a source gives crucial information about the presence of high energy electrons which could also produce TeV radiation. A major uncertainty arises since the keV photons could either be synchrotron photons of very high energy electrons (the actual energy of the electrons certainly depends on the value of the magnetic field) or could be inverse Compton photons produced by electrons with moderate energies. In the latter case, TeV emission of the source would be less probable.
The ASM/RXTE data provide a unique tool for monitoring the light curve of many X-BL Lac objects, but with a moderate sensitivity. In the case of Mkn 501, the state of increased activity lasted several months (Aharonian et al. 1999a). The ASM data could be used to detect such a state by averaging the data over several days or weeks. Such a large bining time does not allow us to search for short-term variability but is dictated by the low sensitivity of the detector. Moreover, as for Mkn 421, the range 2-12 keV can be located around the “pivot point” of the synchrotron spectrum (the hardening starts at the energy of the pivot point): it is not a completely safe indicator of activity, but it is certainly the best one available. Whenever such a state was detected, observations could be initiated. Such a strategy could be complemented with an alert-system which allows us to react to a flare detection in any chosen wavelength within several hours.
Fig. 7 shows the observation time required to achieve a detection for sources with redshifts ranging from 0. to 0.2. The intrinsic emission is assumed to be 10% to 100% of (assuming a slope of 2.6) or of (with a slope of 3.6, see Section 3). It can be recognized that, depending on the redshift of the source, observation times of several hours could suffice for a significant detection.

9 Conclusions
In this paper we report upper limits for a sample of eight X-ray selected BL Lac objects and the object “BL Lacertae” observed in 1997/1998 with the HEGRA CT-system. Seven sources were studied with three telescopes during one to ten hours. The TeV upper limits range from 15% to 65% of the Crab flux. The conversion in units of cm-2 s-1 is done assuming the slope of the spectrum and a model of CIB absorption.
The sources BL Lacertae and 1ES 2344+51.4 were observed with the 4-CT-system for approximately 15 h each. BL Lacertae was flaring in July, 1997 in optical and soft gamma-ray. The source 1ES 2344+51.4 is a very good VHE candidate due to its similarity to the well established strong TeV sources Mkn 421 and Mkn 501. Our upper limits are at the level of 10% of the Crab flux.
The HEGRA IACT system could detect TeV sources out to a redshift of 0.15. Beyond this, intergalactic absorption is expected to reduce the 500 GeV flux considerably. Since BL Lac sources are known to be very variable, a search for TeV emission is much more promising when guided by observations in other wavelengths, especially by observations in the X-ray energy band.
Acknowledgements.
The support of the German Ministry for Research and Technology BMBF and of the Spanish Research Council CICYT is gratefully acknowledged. We thank the Instituto de Astrofisica de Canarias (IAC) for supplying excellent working conditions at La Palma. The ASM/RXTE results are provided by the ASM/RXTE teams at MIT and at the RXTE SOF and GOF at NASA’s GSFC. We acknowledge Ron Remillard and Meg Urry for their helpful discussions and advice. We also thank the referee for his helpful remarks.References
- [1] Aharonian F.A., Akhperjanian A.G., Barrio J.A. et al., 1999a, A&A 342 p. 69.
- [2] Aharonian F.A., Akhperjanian A.G., Barrio J.A. et al., 1999b, A&A, submitted to A&A.
- [3] Barrio J.A., the HEGRA collaboration, 1998 in Proc 16th European Cosmic Ray Symposium, edited by J. Medina.
- [4] Bloom S.D, Bertsch D.L., Hartman R.C. et al., 1997, ApJ 490, p. L145.
- [5] Böttcher M., Bloom S.D. 1998, ApJ submitted,astro-ph/9806249.
- [6] Catanese M., Akerlof C.W., Biller S.D. et al., 1997, ApJ 480 p. 562.
- [7] Catanese M., Akerlof C.W., Badran H.M. et al., 1998, ApJ 501 p. 616.
- [8] Ciliegi P., Bassani L., Caroli E., 1995, ApJ 439 p. 80.
- [9] Comastri A., Fossati G., Ghisellini G., Molendi S., 1997 ApJ 480p. 534.
- [10] Daum A. et al., 1997 Astropart.Phys. 8 p. 1.
- [11] Djannati A., Piron F., Barrau A. et al., A&A submitted,astro-ph/9906060.
- [12] Dwek E., Arendt R.G., 1998, ApJL 508 Lp. 9.
- [13] Dwek E., Arendt R.G., Hauser M.G. et al., 1998, A&AS 191 p. 104.
- [14] Fossati G., Maraschi L., Celotti A., Comastri A., Ghisellini G., 1998 MNRAS 299, p. 433.
- [15] Ghisellini G., Celotti A., Fossati G., Maraschi L., Comastri A., 1998 MNRAS 301, p. 451.
- [16] Giommi P.,Ansari S.G., Micol A., 1995 A&AS 109 p. 267.
- [17] Giommi P., Padovani P., Perlman E.., 1997 to appear in Proc. The Active X-ray Sky: Results from BeppoSAX and Rossi-XTE, edited by Scarsi, Bradt, Giommi and Fiore
- [18] Gould J., Schreder G., 1965 Phys. Rev. Lett. 16 p. 252
- [19] Grove J.E., Johnson W.N., 1997 IAUC 6705.
- [20] Hartman R., Bertsch D., Bloom S., Sreekumar P., Thompson D., 1997 IAUC 6703.
- [21] Helene, O., 1983 NIM 212 p. 319.
- [22] Konopelko A., the HEGRA collaboration, 1998 in Proc 16th European Cosmic Ray Symposium, edited by J. Medina, p. 523.
- [23] Konopelko A. the HEGRA collaboration, 1995, in Proc. Towards a Major Atmos. Cherenkov Detector IV, Padova, edited by M. Cresti, p. 373.
- [24] Lindner A., 1997 Proc. 25th ICRC,Durban 5 p. 113.
- [25] Madejski G.M., Sikora M., Jaffe T. et al., 1999 ApJ accepted,astro-ph/9902167
- [26] Maesano M., Massaro E., Nesci R., 1997 IAUC 6700.
- [27] Makino F., Mattox J., Takahashi T., Kataoka J., Kubo H., 1997 IAUC 6708.
- [28] Malkan M.A., Stecker F.W., 1998 ApJ 496 p. 13
- [29] Mukherjee R., Bertsch D.L., Chiang J. et al., 1997 ApJ 490 p. 116.
- [30] Nikishov A.I., 1962 Sov. Phys. JETP 14 p. 393
- [31] Perlman E.S. et al., 1996 ApJS 104 p. 251.
- [32] Pian E. and Treves A., 1993 ApJ 416 p. 130.
- [33] Primack J.R., Bullock J.S., Somerville R.S., MacMinn D. AstroPart. accepted,astro-ph/9812399
- [34] Qin Y.P. and Xie G.Z., 1997 ApJ 487L p. L41.
- [35] Remillard, R.A.and Levine, M.L., 1997, Proc. All-Sky X-ray Observations in the Next Decade, edited by Matsuoka and Kawai and astro-ph/9707338.
- [36] Samuelson F.W., Biller S.D., Bond I.H. et al., 1998 ApJ 501 p. L17
- [37] Stanev T,., Bertsch D.L., Chiang J. et al. Franceschini A., 1999 ApJ 499 p. L159.
- [38] Stanev T, Franceschini A., 1998 ApJ 494 p. L159.
- [39] Stecker F.W., De Jager O.C. and Salomon M.H., 1992 ApJ 390 p. L49
- [40] Stecker F.W. and Salomon M.H., 1999 ApJ 512
- [41] Tornikoski M., Valtaoja E., Teraesranta H., Okyudo M., 1994 A&A 286 p. 80.
- [42] Urry M.C. and Padovani P., 1995 PASP 107 p. 803
- [43] Webb J.R. et al., 1998 AJ 115 p. 224.