X-ray Nova XTE J1550-564: RXTE Spectral Observations
Abstract
Excellent coverage of the 1998 outburst of the X-ray Nova XTE J1550–564 was provided by the Rossi X-ray Timing Explorer. XTE J1550–564 exhibited an intense (6.8 Crab) flare on 1998 September 19 (UT), making it the brightest new X-ray source observed with RXTE. We present a spectral analysis utilizing 60 Proportional Counter Array spectra from 2.5–20 keV spanning 71 days, and a nearly continuous All Sky Monitor light curve. The spectra were fit to a model including multicolor blackbody disk and power-law components. XTE J1550–564 is observed in the very high, high/soft, and intermediate canonical outburst states of Black Hole X-ray Novae.
1 Introduction
The X-ray nova and black hole candidate XTE J1550–564 was discovered (Smith et al. 1998) with the All Sky Monitor (ASM; Levine et al. 1996) aboard the Rossi X-ray Timing Explorer (RXTE) just after the outburst began on 1998 September 6. The position quickly led to the identification of the counterparts in the optical (Orosz, Bailyn, & Jain 1998) and radio (Campbell-Wilson et al. 1998) bands. Early observations of the source with BATSE (Wilson et al. 1998) revealed an X-ray photon index in the range of 2.1–2.7; on one occasion the source was detected at energies above 200 keV.
The X-ray light curve of XTE J1550–564 from the ASM is shown in Figure 1. The source is the brightest transient yet observed with RXTE: the flare of 1998 September 19-20 reached 6.8 Crab (or 1.6 erg s-1 cm-2) at 2–10 keV. The overall profile of the outburst, with its slow 10-day rise, dominant X-ray flare, 30-day intensity plateau, and relatively rapid 10-day decay timescale (after MJD 51110), is different from the outbursts of classical X-ray novae like A0620–00 (see Chen, Shrader, & Livio 1997). The apparent optical and X-ray brightness of XTE J1550–564, and even its X-ray light curve, are roughly similar to that of X-ray Nova Oph 1977, a black hole binary, for which there is a distance estimate of 6 kpc (Watson, Ricketts, & Griffiths 1978; Remillard et al. 1996).
The discovery of XTE J1550–564 prompted a series of pointed RXTE observations with the Proportional Counter Array (PCA; Jahoda et al. 1996) and the High-Energy X-ray Timing Experiment (HEXTE; Rothschild et al. 1998) instruments. These were scheduled almost daily for the first 50 days of the outburst and roughly every two days during the following two months. The first 14 RXTE observations were part of a guest observer program with results reported by Cui et al. (1998). They found that during the initial X-ray rise (0.7–2.4 Crab at 2–10 keV), the source exhibited very strong QPOs in the range 0.08–8 Hz. The rapid variability and the characteristics of the X-ray spectrum suggested that XTE J1550–564 is powered by an episode of accretion in a black hole binary system (see Tanaka & Lewin 1995). The possible presence of a mag counterpart (Jain et al. 1999) is especially important since this may allow radial velocity studies in quiescence that could confirm the black hole nature of the primary.
Herein we present 60 X-ray spectral observations spanning 71 days of the 1998 outburst of XTE J1550–564. These observations include all of our RXTE guest observer program (#30191) and the first five public observations of this source. A timing study based on these same RXTE observations and observations of the optical counterpart are presented in companion papers (Remillard et al. 1999 and Jain et al. 1999; hereafter Paper II and Paper III, respectively).
2 Spectral Observations and Analysis
We present 60 observations of XTE J1550–564 (see Fig. 1) obtained using the PCA instrument onboard RXTE. The PCA consists of five xenon-filled detector units (PCUs) with a total effective area of 6200 cm-2 at 5 keV. The PCA is sensitive in the range 2–60 keV, the energy resolution is 17% at 5 keV, and the time resolution capability is 1 sec. The HEXTE data are not presented here due to uncertainty in the PCA/HEXTE cross calibration.
The PCA data were taken in the “Standard 2” format and the response matrix for each PCU was obtained from the 1998 January distribution of response files. The pulse height spectrum from each PCU was fit over the energy range 2.5–20 keV, using a systematic error in the countrates of 1%, and background subtracted using the standard background models. Only PCUs 0 & 1 were used for the spectral fitting reported here and both PCUs were fit simultaneously using XSPEC.
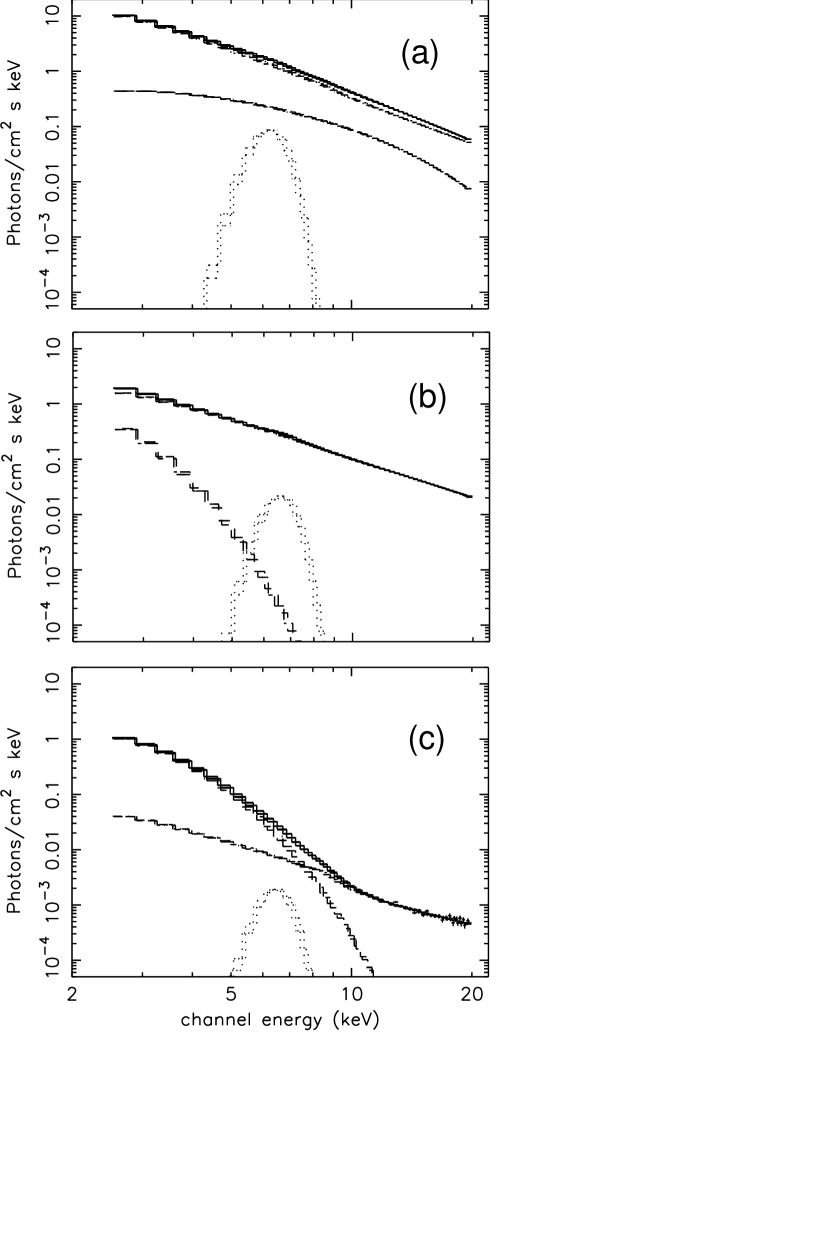
The PCA spectral data were fit to the widely used model consisting of a multicolor blackbody accretion disk plus power-law (Tanaka & Lewin 1995; Mitsuda et al. 1984; Makishima et al. 1986). The fits were significantly improved by including a smeared Fe aborption edge near 8 keV (Ebisawa et al. 1994; Inoue 1991) and an Fe emission line with a central energy around 6.5 keV and a fixed width of 1.2 keV (FWHM). The fitted equivalent width of the Fe emission line was eV. Interstellar absorption was modeled using the Wisconsin cross-sections (Morrison & McCammon 1983). The fitted hydrogen column density varied from 1.7 to 2.2 cm-2 and was fixed at cm-2 in the analysis presented here, resulting in a total of eight free parameters.
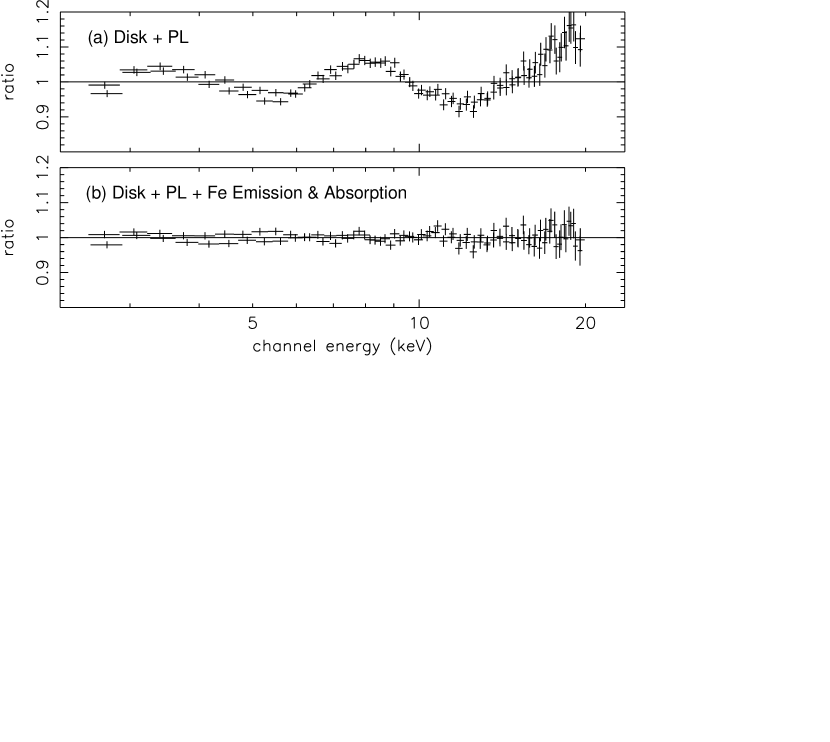
Three representative spectra are shown in Figures 2a–c. These spectra illustrate the range of X-ray spectra for XTE J1550–564, in which an intense power-law component dominates a hot disk (a), a strong power-law dominates a warm disk (b), or the disk dominates a weak power-law (c). The addition of the Fe emission & absorption components is motivated in Figures 3a & b, which show the ratio of a typical spectrum to the model without and with the Fe emission & absorption. The addition of the Fe emission & absorption components reduces the from 7.9 to 0.9 in this example.
The fitted temperature and radius of the inner accretion disk presented here ( & ) are actually the color temperature and radius of the inner disk, which are affected by spectral hardening due to Comptonization of the emergent spectrum (Shakura & Sunyaev 1973). The corrections for constant spectral hardening are discussed in Shimura & Takahara (1995), Ebisawa et al. (1994), and Sobczak et al. (1999), but are not applied to the spectral parameters presented here. The physical interpretation of these parameters remains highly uncertain. The model parameters and component fluxes (see Table 1) are plotted in Figures 4a–e. All uncertainties are given at the level.
3 Discussion of Spectral Results
The spectra from MJD 51074 to 51113 are dominated by the power-law component which has photon index 2.35–2.86 (Fig. 4c, Table 1). The source also displays strong 3–13 Hz QPOs during this time (Paper II), whenever the power-law contributes more than 60% of the observed X-ray flux. This behavior is consistent with the very high state of Black Hole X-ray Novae (BHXN) (See Tanaka & Lewin (1995) and references therein for further details on the spectral states of BHXN). After MJD 51115, the power-law component weakens rapidly, with 2.0–2.4, and the disk component begins to dominate the spectrum (see Fig. 2c). The source generally shows little temporal variability during this time (Paper II). We identify this period with the high/soft state. However, during this time the source occasionally exhibits QPOs at 10 Hz (Table 1) and we identify those observations with the intermediate state. The low state was not observed and the intensity increased again after MJD 51150.
From Figure 4b, it appears that the inner radius of the disk does not remain fixed at the last stable orbit throughout the outburst cycle. From Table 1, we see that the intense flare on MJD 51075 is accompanied by a dramatic decrease in the inner disk radius from 33 to 2 km (for zero inclination () and kpc) over one day. Similar behavior was observed for GRO J1655–40 during its 1996-97 outburst: the observed inner disk radius decreased by almost a factor of four during periods of increased power-law emission in the very high state and was generally larger in the high/soft state (Sobczak et al. 1999).
The physical radius of the inner disk may vary in these systems, by as much as a factor of 16 in the case of XTE J1550–564. Another possibility, however, may be that the apparent decrease of the inner disk radius observed during intense flares from these two sources is caused by the failure of the multicolor disk model at these times. This failure could occur when spectral hardening becomes significant in the inner disk, causing the color temperature to assume a steep radial profile (Shimura & Takahara 1995). In such a case, fitting the multicolor disk model (which assumes ) to the resulting spectrum yields an inner disk radius which is smaller than the physical value (Sobczak et al. 1999). Thus the actual physical radius of the inner disk may remain fairly constant in the presence of these intense flares.
The peak luminosity (bolometric disk luminosity plus 2–100 keV power-law luminosity) observed during the flare on MJD 51075 is erg s-1, which corresponds to the Eddington luminosity for at 6 kpc.
4 Conclusion
We have analyzed RXTE data obtained for the X-ray Nova XTE J1550–564. Satisfactory fits to all the PCA data were obtained with a model consisting of a multicolor disk, a power-law, and Fe emission and absorption components. XTE J1550–564 is observed in the very high, high/soft, and intermediate canonical outburst states of BHXN. The source exhibited an intense (6.8 Crab) flare on MJD 51075, during which the inner disk radius appears to have decreased dramatically from 33 to 2 km (for zero inclination and kpc). However, the apparent decrease of the inner disk radius observed during periods of increased power-law emission may be caused by the failure of the multicolor disk and the actual physical radius of the inner disk may remain fairly constant.
References
- (1) Campbell-Wilson, D., McIntyre, V., Hunstead, R., & Green, A. 1998, IAU Circ.7010
- (2) Chen, W., Shrader, C. R., & Livio, M. 1997, ApJ, 491 312
- (3) Cui, W., Zhang, S. N., Chen, W., & Morgan, E. H. 1999, ApJ, 512, L43
- (4) Ebisawa, K., Ogawa, M., Aoki, T., Dotani, T., Takizawa, M., Tanaka, Y., Yoshida, K., Miyamoto, S., Iga, S., Hayashida, K., Kitamoto, S., & Terada, K. 1994, PASJ, 46, 375
- (5) Inoue, H. 1991, in Frontiers of X-ray Astronomy, ed. Y. Tanaka & K. Koyama (Tokyo: Universal Academy Press), 291
- (6) Jahoda, K., Swank, J. H., Giles, A. B., Stark, M. J., Strohmayer, T., Zhang, W., & Morgan, E. H. 1996, Proc. SPIE 2808, “EUV and Gamma Ray Instumentation for Astronomy” VII, 59
- (7) Jain, R., Bailyn, C. D., Orosz, J. A., Remillard R. A., & McClintock, J. E. 1999, ApJ, in press
- (8) Levine, A. M., Bradt, H., Cui, W., Jernigan, J. G., Morgan, E. H., Remillard, R., Shirey, R. E., & Smith, D. A. 1996, ApJ, 469, 33
- (9) Makishima, K., Maejima, Y., Mitsuda, K., Bradt, H. V., Remillard, R. A., Tuohy, I. R., Hoshi, R., & Nakagawa, M. 1986, ApJ, 308, 635
- (10) Mitsuda, K., et al. 1984, PASJ, 36, 741
- (11) Morrison, R. & McCammon, D. 1983, ApJ, 270, 119
- (12) Orosz, J., Bailyn, C., & Jain, R. 1998, IAU Circ.7009
- (13) Remillard, R. A., Orosz, J. A., McClintock, J. E., & Bailyn, C. D. 1996, ApJ, 459, 226
- (14) Remillard, R. A., McClintock, J. E., Sobczak, G. J., Bailyn, C. D., Orosz, J. A., Morgan, E. H., & Levine, A. M. 1999, ApJ, in press
- (15) Rothschild, R. E., Blanco, P. R., Gruber, D. E., Heindl, W. A., MacDonald, D. R., Marsden, D. C., Pelling, M. R., Wayne, L. R., & Hink, P. L. 1998, ApJ, 496, 538
- (16) Shakura, N. I. & Sunyaev, R. A. 1973, A&A, 24, 337
- (17) Shimura, T. & Takahara, F. 1995, ApJ, 445, 780
- (18) Smith, D. A. & RXTE/ASM teams 1998, IAU Circ.7008
- (19) Sobczak, G. J., McClintock, J. E., Remillard, R. A., Bailyn, C. D., & Orosz, J. A. 1999, ApJ, 520, in press
- (20) Tanaka, Y. & Lewin, W. H. G. 1995, in X-ray Binaries, ed. W. H. G. Lewin, J. van Paradijs, & E. P. J. van den Heuvel (Cambridge: Cambridge Univ. Press)
- (21) Watson, M. G., Ricketts, M. J., & Griffiths, R. E. 1978, ApJ, 221, L69
- (22) Wilson, C. A., Harmon, B. A., Paciesas, W. S., & McCollough, M. L. 1998, IAU Circ.7010
![[Uncaptioned image]](/html/astro-ph/9903395/assets/x1.png)