Structure and stellar content of dwarf galaxies
Abstract
We have carried out CCD photometry in the Cousins and bands of 21 dwarf galaxies in and around the M101 group. Eleven are members and suspected members of the group and ten are field galaxies in the projected vicinity of the group. We have derived total magnitudes, effective radii, effective surface brightnesses, as well as galaxy diameters at various isophotal levels in both colours. Best-fitting exponential parameters and colour gradients are also given for these galaxies. Some of the galaxies show a pronounced luminosity excess above the best-fitting exponential at large radii, or surface brightnesses fainter than in . This feature, while non-significant for a single case and technically difficult to interpret, might be an indication of the existence of an extended old stellar halo in dwarf irregulars. The photometric parameters of the galaxies presented here will be combined with previously published data for nearby dwarf galaxies and statistically analysed in a forthcoming paper.
Key Words.:
galaxies:general – galaxies:fundamental parameters – galaxies:photometry – galaxies:irregular – galaxies:structure – galaxies:luminosity function1 Introduction
A good knowledge of the local galaxian neighbourhood is prerequisite for an understanding of the distant (early) universe. Deep images, such as the spectacular Hubble Deep Field, can only be interpreted properly if the dwarf galaxy content of the local universe is very well known. However, studies of nearby dwarf galaxies have until recently concentrated on the Local Group (LG), a rather small volume of space. A larger piece of the local universe is captured in the “10 Mpc Catalogue” of galaxies by Kraan-Korteweg & Tammann Kraan-Korteweg and Tammann (1979), updated by Schmidt & Boller Schmidt and Boller (1992a). This list is intended to contain all galaxies with radial velocities of less than 500 km s-1 as referred to the centroid of the LG, i.e. lying within a distance of about 10 Mpc. At present, the list includes ca. 300 (mostly dwarf) galaxies, but this number is bound to grow due to continued efforts to detect extremely faint and diffuse nearby stellar systems Karachentseva and Karachentsev (1998).
Unfortunately, the available photometric data on “10 Mpc objects” is relatively scarce and not very reliable for the fainter galaxies Patterson and Thuan (1996). We have therefore started a long-term programme to do systematic multicolour imaging of possibly all dwarfish objects in the 10 Mp volume. The goal is not only to get total magnitudes in order to assess the true shape of the faint end of the local luminosity function of galaxies, but also to derive all relevant structural parameters for these dwarfs and to compare them with existing data on the dwarf galaxy populations of, foremost, the Virgo and Fornax clusters e.g. Binggeli and Cameron Binggeli and Cameron (1991), in order to get clues on galaxy evolution in different environnments.
Most galaxies within 10 Mpc distance are organized into a small number of well-known groups of galaxies; essentially these are the IC342, M81, M101, CVn I, Cen A, and Scl groups Schmidt and Boller (1992b). Following previous work on the M81 group dwarfs Bremnes et al. (1998); Lesaffre et al. (1999), herefater Papers I & II, we here present CCD photometric data in the and photometric bands for the 11 known M101 group dwarf members, as well as 10 field dwarfs in the vicinity of M101. A short description of the M101 group is given in the following section. The photometric data presented here (Sect. 4) will be lumped together with those of previous data papers. An interpretation and scientific discussion of this material is planned to follow in a future paper of this series.
2 Sample and imaging
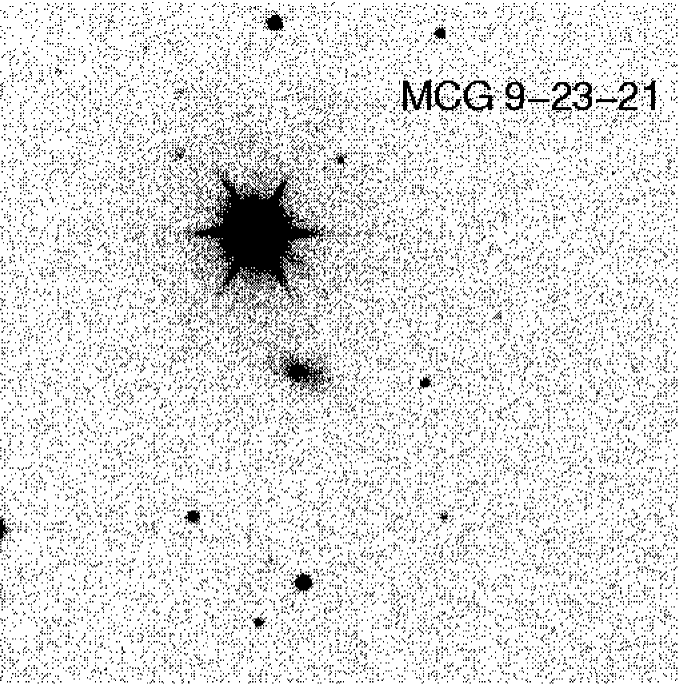
The M101 group, with 6.5 Mpc Karachentsev (1996), is the most distant one in the 10 Mpc volume. It is also the poorest group of all, including the LG. It is completely dominated by M101 itself: the second-ranked group member, NGC 5585, is already 3 magnitudes fainter than M101. Only 13 members and possible members of the group are known to date, half of which are lying very close to M101 and can therefore be regarded as M101 satellites. With one exception (the dwarf elliptical UGC 8882) they are all late-type dwarfs (Sd, Sm, Im). One peculiar feature of the group is its luminosity function: the population of very faint and diffuse dawarfs (elliptical or irregular), which is so frequent elsewhere, is apparently simply missing here (the faintest member known is as bright as ). We have therefore made an attempt to find new candidate members on deep POSS II Schmidt films, but found only one additional possible member (the BCD MGC 9-23-21). A recent blind H I survey of the M101 area has also not resulted in a single new member of the group (Kraan-Korteweg et al. 1999, in preparation). It will take surveys of highly increased sensitivity to uncover the sought-for exponential rise of the luminosity function of the M101 group.
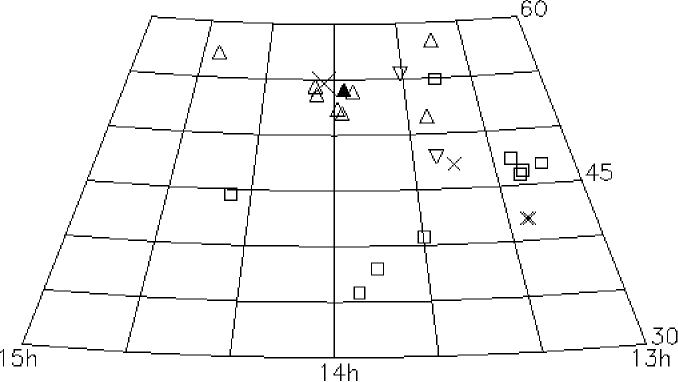
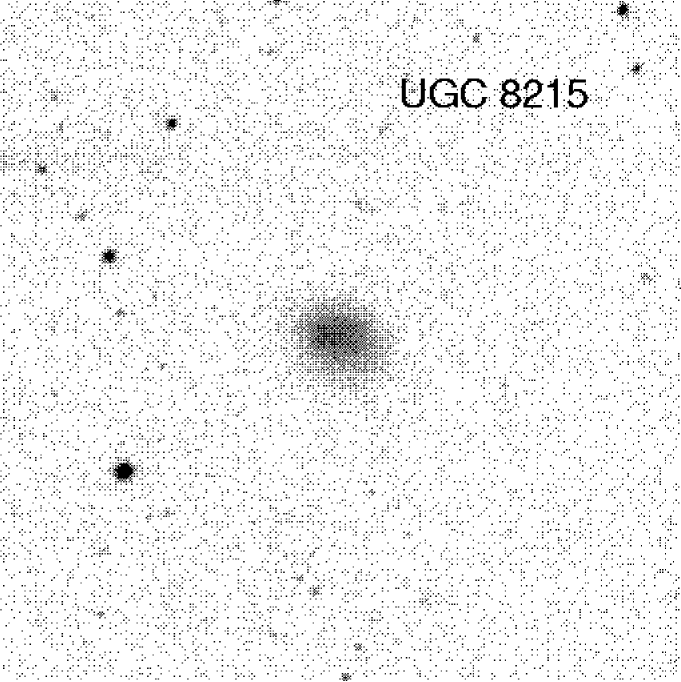
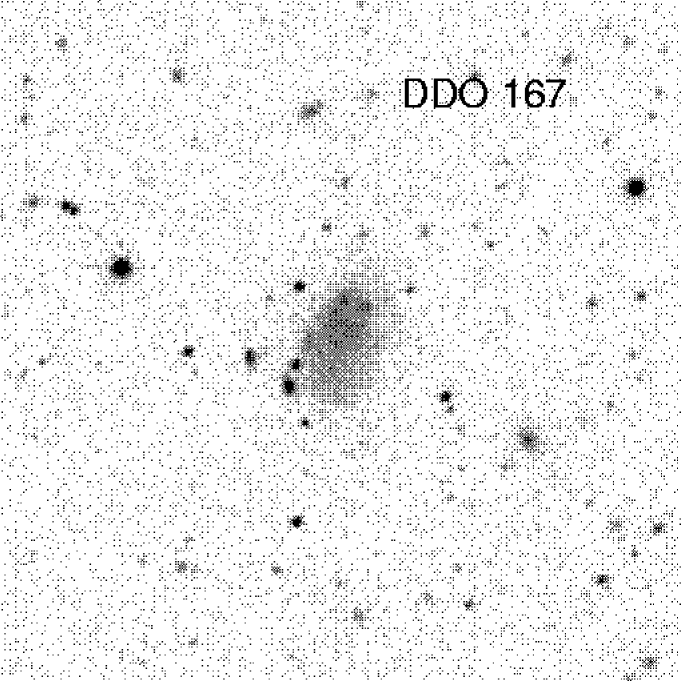
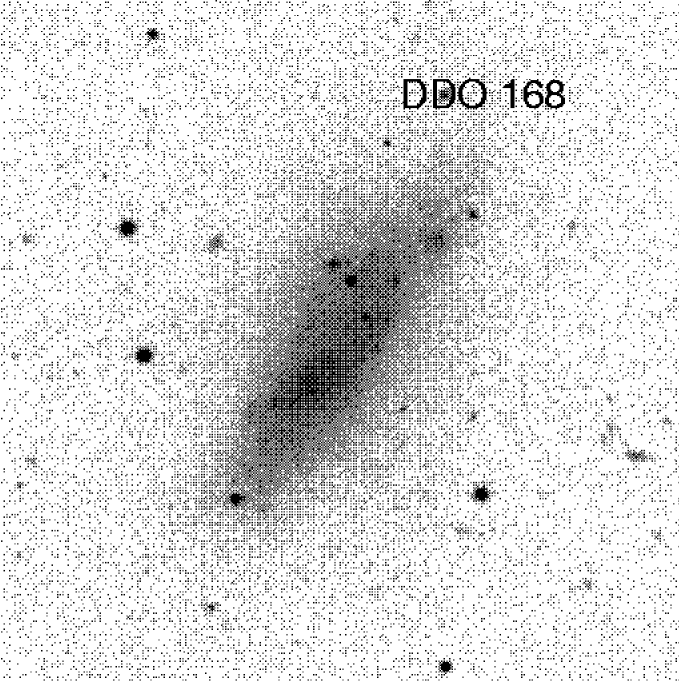
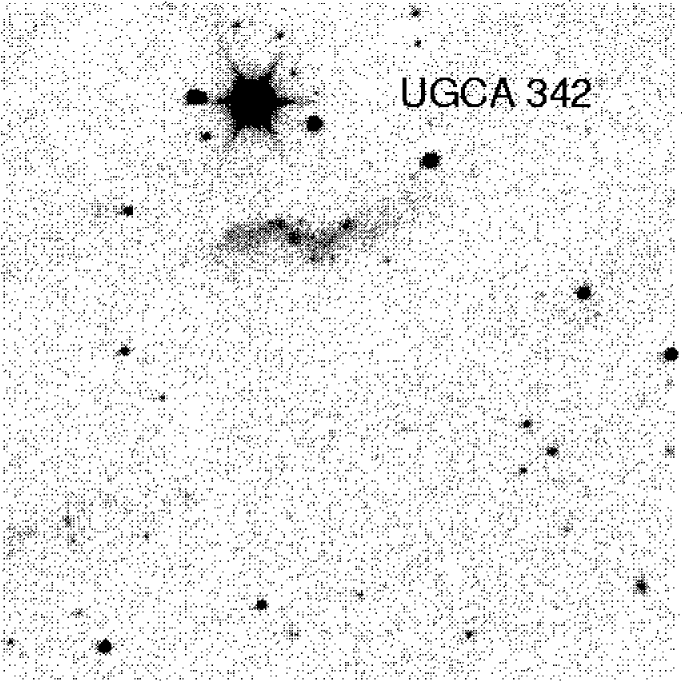
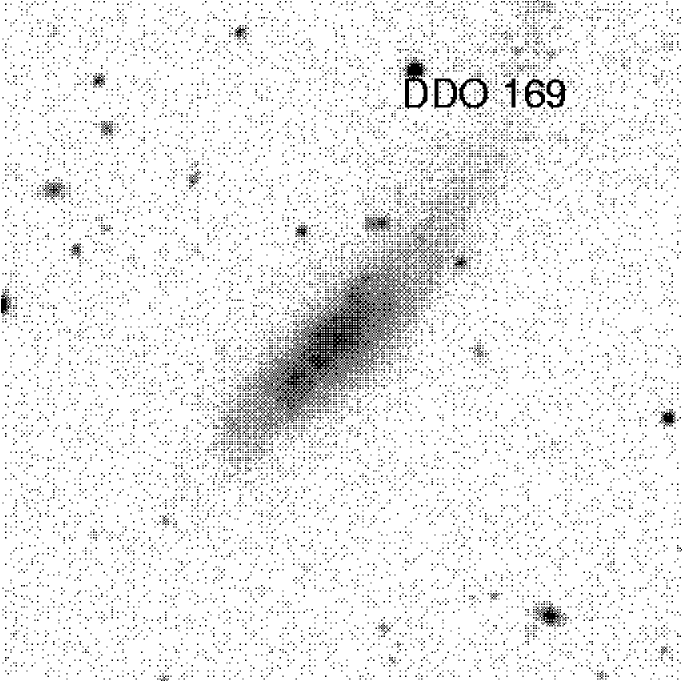
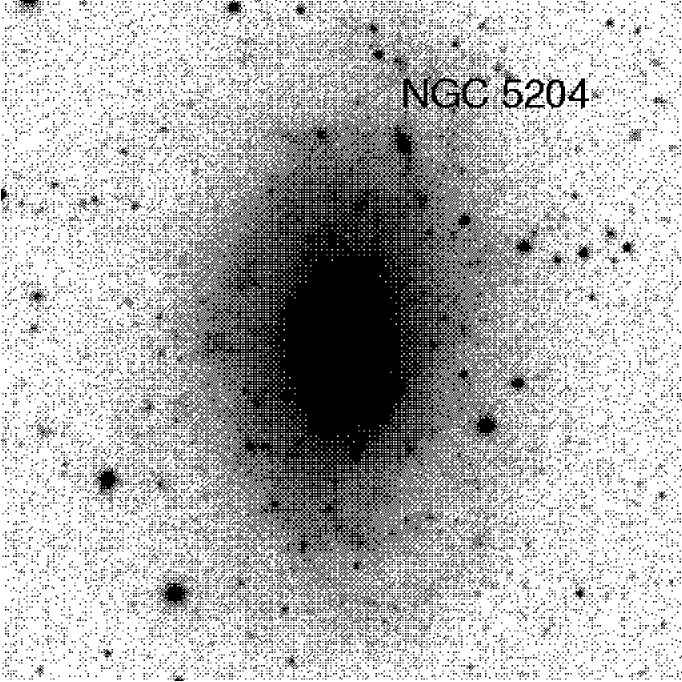
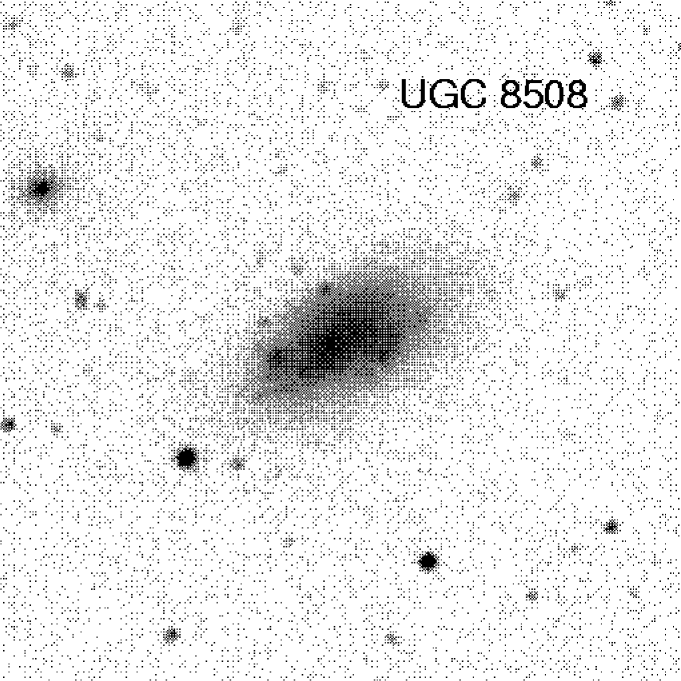
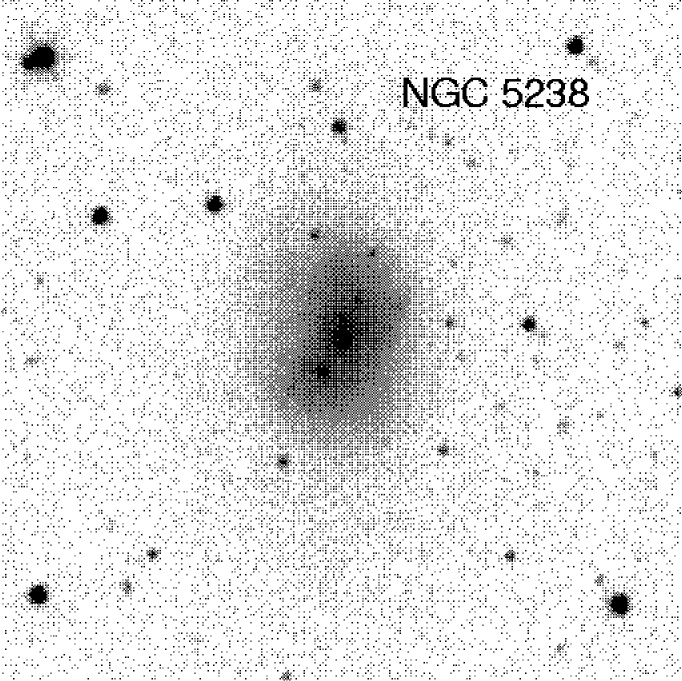
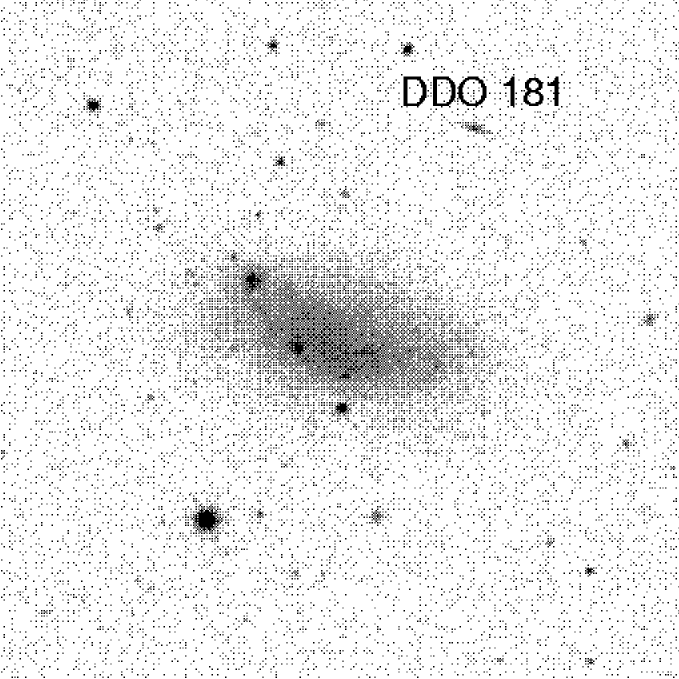
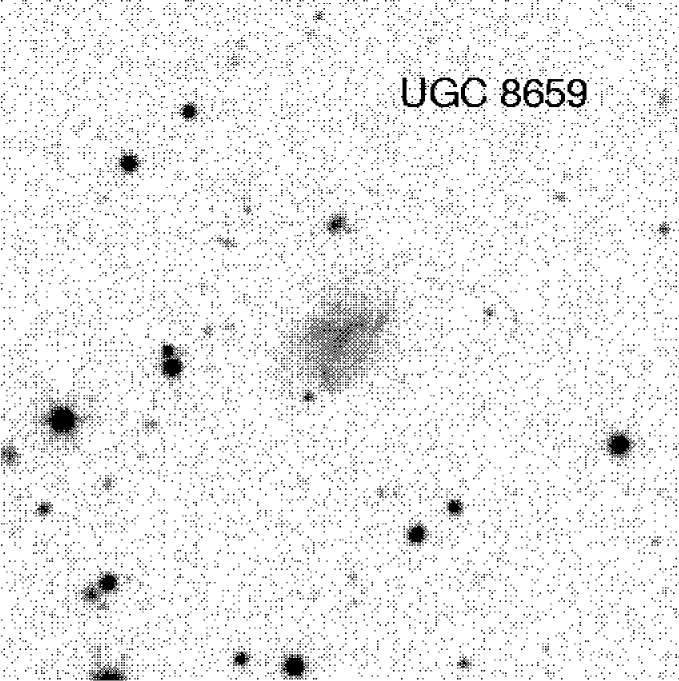
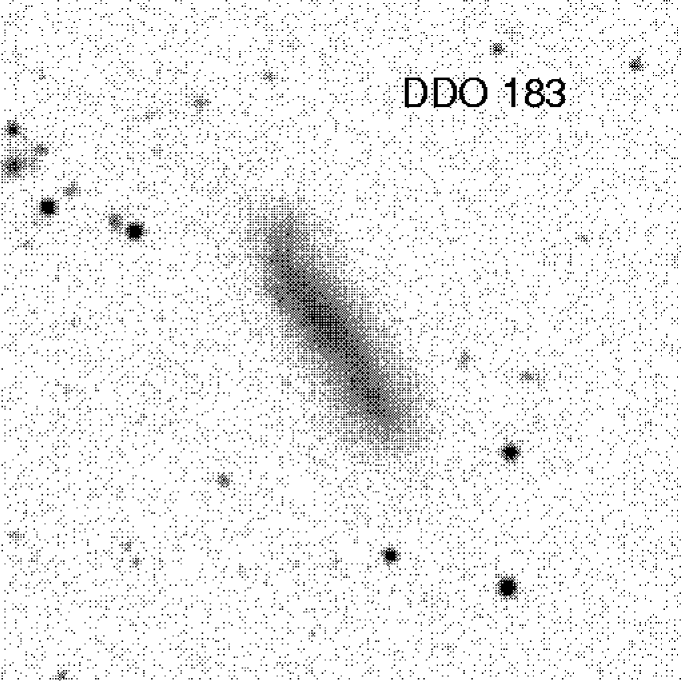
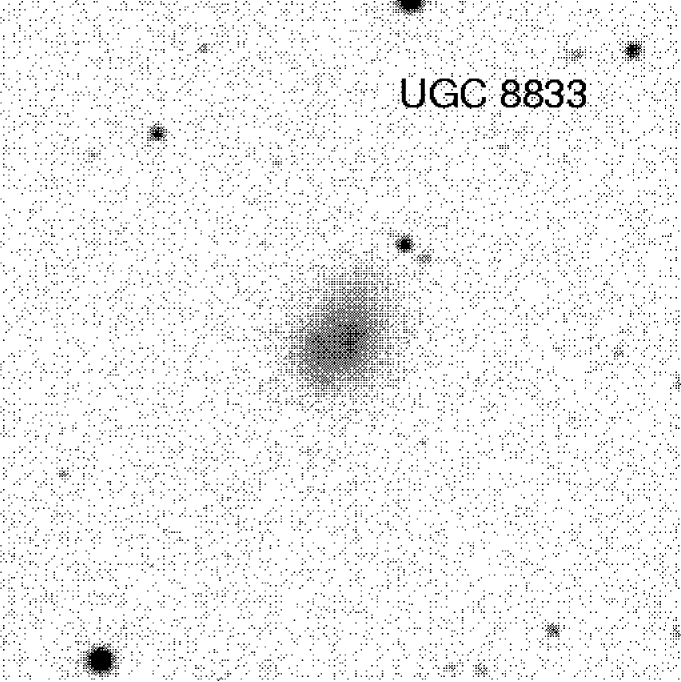
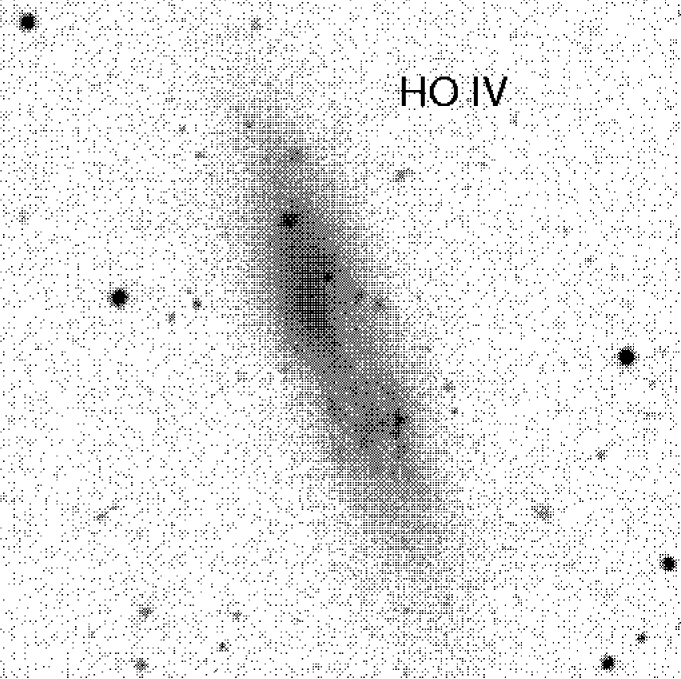
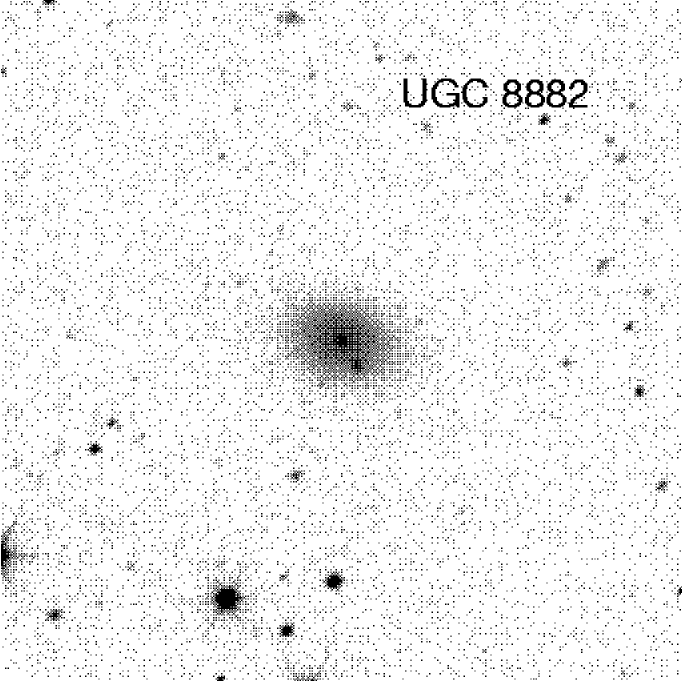
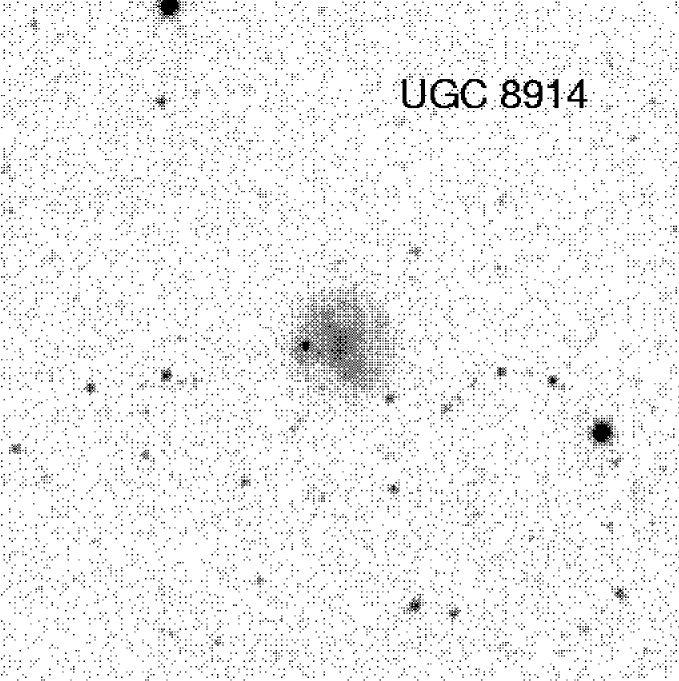
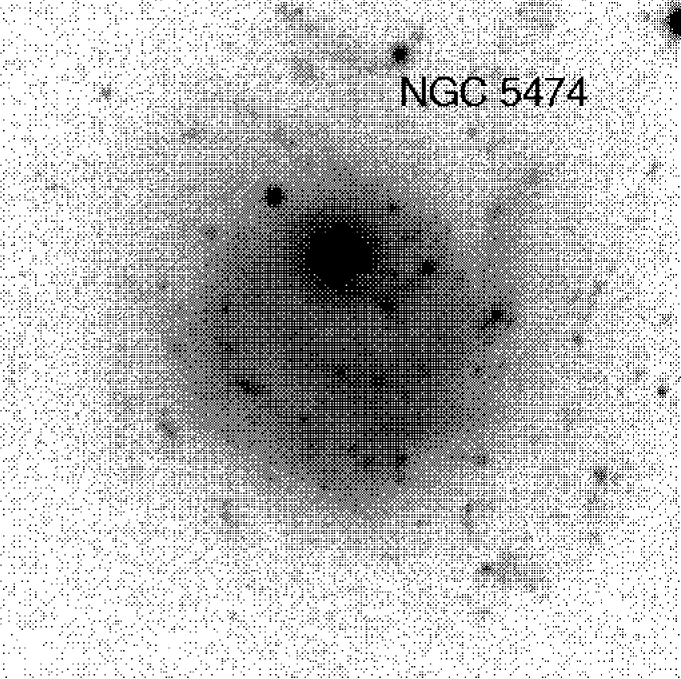
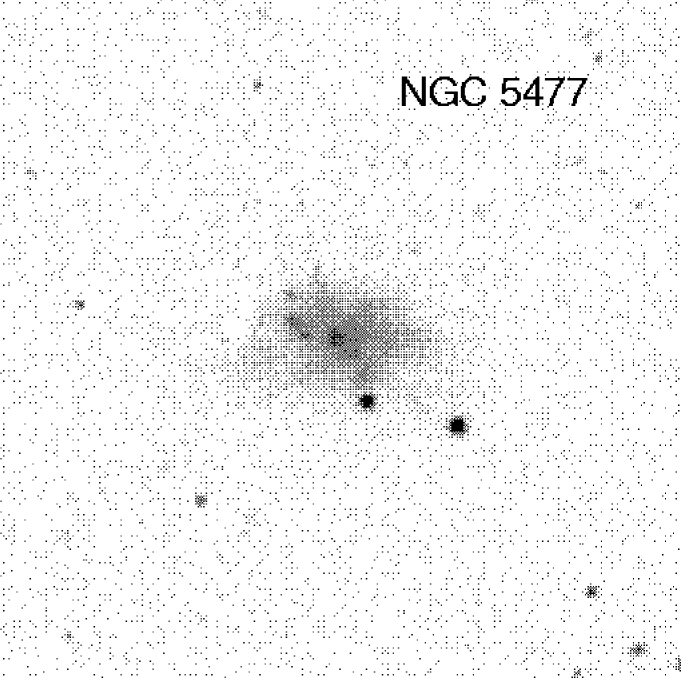
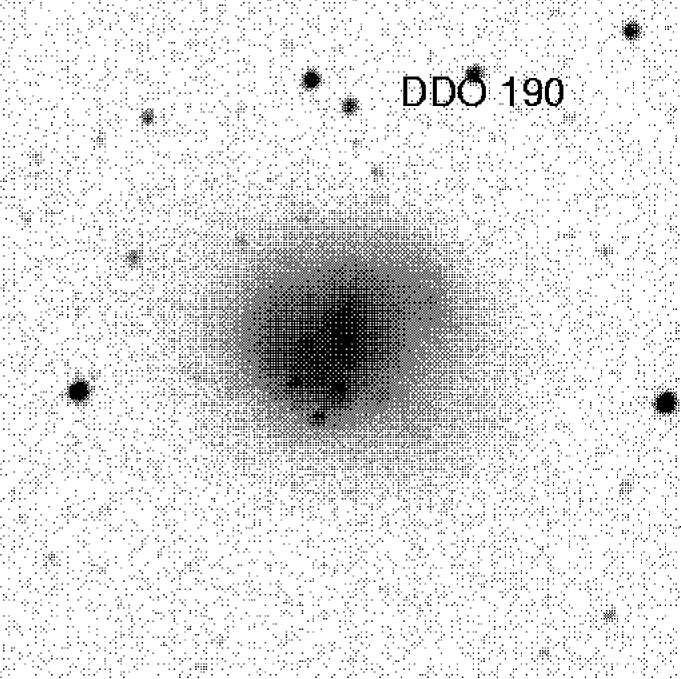
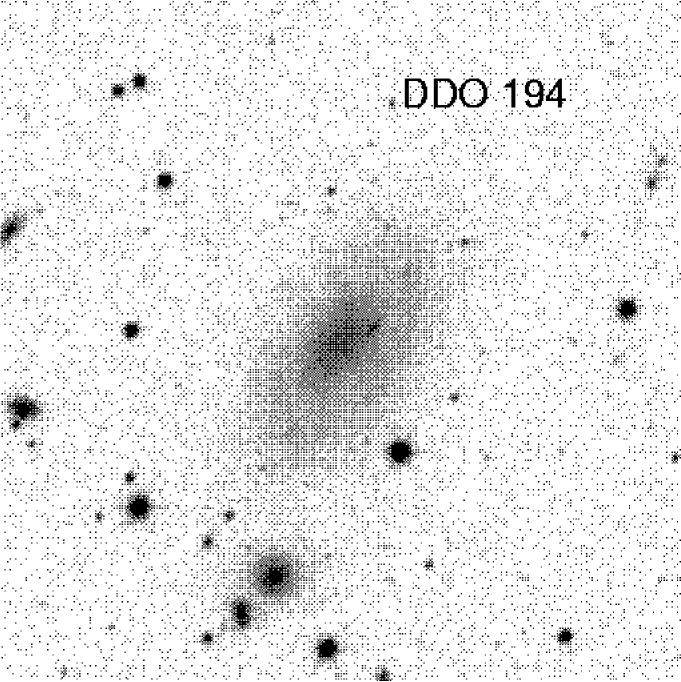
In Table 1 we give a complete list of the 11 presently known members (M) and possible members (PM) of the M101 group as well as 10 field (F) dwarfs that were imaged during the same run. This list was prepared by B. Binggeli based on the catalogue of Schmidt & Boller Schmidt and Boller (1992a). A map showing the distribution of these objects on the sky is shown in Fig. 1, where the galaxies are coded according to their type and group membership. A gallery of images is given in Fig. 2. It should be noted that the objects listed in Table 1 and the images displayed in Fig. 2 include all M101 group members known to date with the exception of the two giant members M101 and NGC 5585 for which data and images are given in Sandage and Tammann Sandage and Tammann (1974, 1987).
The photometry of the 21 objects listed in Table 1 is based on images taken during eight nights in March 1997 on the telescope of the Observatoire de Haute-Provence (OHP). They are 40 minute Cousins and 20 minute Cousins exposures. The camera used was the Tektronix CCD. One pixel corresponds to , giving a frame size of . The gain was set to per ADU, and the CCD was read out in the fast mode, with a readout noise of . The seeing during the observing run varied between and (FWHM), which is relatively poor but sufficient for our purposes.
| Memb. | No. | Ident. 1 | Ident. 2 | R.A. | Dec. | Type | |||
| (h m s) | (° ′ ″) | (mag) | (km/s) | ||||||
| F | 1. | UGC 08215 | UGC 08215 | 13 08 03.3 | 46 49 43 | Im | 1.0 | 16.03 | 218 |
| F | 2. | DDO 167 | UGC 08308 | 13 13 22.0 | 46 19 07 | Im | 1.1 | 15.50 | 164 |
| F | 3. | DDO168 | UGC 08320 | 13 14 26.1 | 45 55 29 | Im | 3.6 | 13.04 | 195 |
| 4. | UGCA 342 | UGCA 342 | 13 15 08.6 | 42 00 10 | Im | 1.6 | 388 | ||
| F | 5. | DDO 169 | UGC 08331 | 13 15 30.7 | 47 29 47 | Im | 2.7 | 14.27 | 260 |
| M | 6. | NGC 5204 | UGC 08490 | 13 29 36.4 | 58 25 04 | Sm | 5.0 | 11.71 | 201 |
| F | 7. | UGC 08508 | UGC 08508 | 13 30 45.3 | 54 54 34 | Im | 1.7 | 13.88 | 62 |
| PM | 8. | NGC 5229 | UGC 08550 | 13 34 02.8 | 47 54 55 | Sd | 3.3 | 14.10 | 364 |
| M | 9. | NGC 5238 | UGC 08565 | 13 34 42.8 | 51 36 50 | Sdm | 1.7 | 13.55 | 232 |
| F | 10. | DDO 181 | UGC 08651 | 13 39 53.8 | 40 44 21 | Im | 2.3 | 14.36 | 201 |
| PM | 11. | UGC 08659 | UGC 08659 | 13 40 33.9 | 55 25 44 | Im | 1.0 | 16.16 | |
| F | 12. | DDO 183 | UGC 08760 | 13 50 51.1 | 38 01 17 | Im | 2.2 | 14.64 | 193 |
| F | 13. | UGC 08833 | UGC 08833 | 13 54 48.9 | 35 50 17 | Im | 0.9 | 15.58 | 228 |
| M | 14. | HO iv | UGC 08837 | 13 54 45.1 | 53 54 17 | Im | 4.3 | 13.65 | 144 |
| M | 15. | UGC 08882 | UGC 08882 | 13 57 18.7 | 54 06 25 | dE,N | 1.0 | 15.28 | |
| PM | 16. | MGC 9-23-21 | MGC 9-23-21 | 13 57 37.9 | 51 58 26 | BCD? | 0.8 | 16.0:2 | |
| PM | 17. | UGC 08914 | UGC 08914 | 13 59 11.9 | 52 21 45 | Im | 1.0 | 16.00 | |
| M | 18. | NGC 5474 | UGC 09013 | 14 05 02.0 | 53 39 44 | Scd | 4.8 | 11.77 | 277 |
| M | 19. | NGC 5477 | UGC 09018 | 14 05 33.1 | 54 27 39 | Sm | 1.7 | 14.19 | 304 |
| F | 20. | DDO 190 | UGC 09240 | 14 24 43.4 | 44 31 33 | Im | 1.8 | 13.10 | 150 |
| M | 21. | DDO 194 | UGC 09405 | 14 35 24.6 | 57 15 24 | Im | 1.7 | 14.52 | 222 |
| Notes: Columns 5 and 6: 2000.0 epoch coordinates taken from the NED. | |||||||||
| Column 7: Dwarf type reckoned by B.B. on the system of Sandage and Binggeli Sandage and Binggeli (1984) | |||||||||
| Columns 8 and 9: Diameter at and total apparent blue magnitude from the present photometry, from | |||||||||
| Schmidt & Boller Schmidt and Boller (1992a) (1), or from other sources compiled by one of us (B. B.) (2). | |||||||||
| Column 10: heliocentric velocity from NED | |||||||||

3 Reductions
The images were flat-fielded using combined twilight and dome flats. The photometry was done with the MIDAS package developed by ESO. The images were combined, bias-subtracted and flatfielded using standard procedures. The subsequent reductions were done within the SURFPHOT context in MIDAS. The background was determined by fitting a tilted plane with FIT/BACKGROUND and was checked for correctness by measuring the sky level in different locations in the field. For each galaxy the centre and the ellipse parameters (ellipticity, position angle counted counter-clockwise from the horizontal axis) were determined at the level of by the ellipse fitting routine FIT/ELL3 and are given in Table 2.
| Number | Galaxy | PA [deg] | a[] | b[] | |
|---|---|---|---|---|---|
| 1. | UGC 08215 | 158 | 20.9 | 15.5 | 0.74 |
| 2. | DDO 167 | 069 | 29.6 | 17.8 | 0.60 |
| 3. | DDO 168 | 058 | 100. | 40.2 | 0.40 |
| 5. | DDO 169 | 044 | 63.8 | 20.6 | 0.32 |
| 6. | NGC 5204 | 084 | 137. | 88.4 | 0.64 |
| 7. | UGC 08508 | 027 | 54.3 | 30.2 | 0.56 |
| 8. | NGC 5229 | 077 | 78.0 | 15.1 | 0.19 |
| 9. | NGC 5238 | 087 | 58.0 | 39.6 | 0.68 |
| 10. | DDO 181 | 160 | 55.7 | 24.5 | 0.44 |
| 11. | UGC 08659 | 045 | 21.3 | 16.1 | 0.75 |
| 12. | DDO 183 | 121 | 67.8 | 17.8 | 0.26 |
| 13. | UGC 08833 | 052 | 26.7 | 18.9 | 0.71 |
| 14. | HO iv | 110 | 103. | 26.8 | 0.26 |
| 15. | UGC 08882 | 163 | 28.0 | 20.6 | 0.74 |
| 16. | MCG 9-23-21 | ||||
| 17. | UGC 08914 | 135 | 21.5 | 15.4 | 0.72 |
| 18. | NGC 5474 | 152 | 103. | 99.3 | 0.96 |
| 19. | NGC 5477 | 172 | 43.6 | 30.5 | 0.70 |
| 21. | DDO 190 | 014 | 62.3 | 54.8 | 0.88 |
| 22. | DDO 194 | 050 | 42.9 | 27.6 | 0.64 |
These parameters were then used to obtain the total light profile (growth curve) by integrating the galaxy light in elliptical apertures of increasing equivalent radius. A surface brightness profile is obtained by differentiating the growth curve. The galaxy profiles derived in this way include the bright regions that usual ellipse fitting routines ignore. Circular aperture growth curves were also obtained as in Bremnes et al. Bremnes et al. (1998). The resulting profiles by the elliptical aperture photometry are shown in Fig. 3 and the derived photometric parameters are shown in Table 1. The circular aperture photometry served as a comparison between the photometry presented here and that of Bremnes et al. Bremnes et al. (1998). This comparison is given in Appendix A, where it is shown that the agreement between the two methods is excellent.
The profiles are traced down to the level where the errors due to the fluctuations in the sky level on the profile become dominant. As discussed in section 4.4, this represents approx. in and in .
The photometric calibrations were done using standard methods, with calibration fields chosen to be relatively close on the sky to the observed galaxies. These fields were taken from Smith et al. Smith et al. (1985). The calibration stars were imaged before and after imaging every second galaxy.
Galactic absorption values were taken from the NED database, and are essentially zero for all galaxies in the sample ( for all galaxies except NGC 5204 which has ). Therefore no correction was applied. A correction for internal extinction was not applied either.
4 Results
4.1 Model-free photometric parameters and radial profiles
The global photometric parameters of our objects are listed in Table
3, and the columns represent:
Column 1: number of the galaxy ordered by increasing right ascension
Column 2: name of the galaxy
Column 3: total apparent magnitude in the band
Column 4: total apparent magnitude in the band
Column 5: effective radius in B
Column 6: effective radius in R
Column 7: effective surface brightness in B
Column 8: effective surface brightness in R
Column 9: radius where
in the band
Column 10: as above, except
Column 11: as above, except
Column 12: radius where
in the band
Column 13: as above, except
Column 14: as above, except
Column 15: total
The total apparent magnitude of a galaxy was read off the growth curve at a sufficiently large radius (i.e. where the growth curve becomes asymptotically flat). The model-free effective radius was simply read at half of the total growth curve intensity. The effective surface brightness is then given by
| (1) |
All radii refer to equivalent radii (, where and are the major and minor axis of the galaxy, respectively).
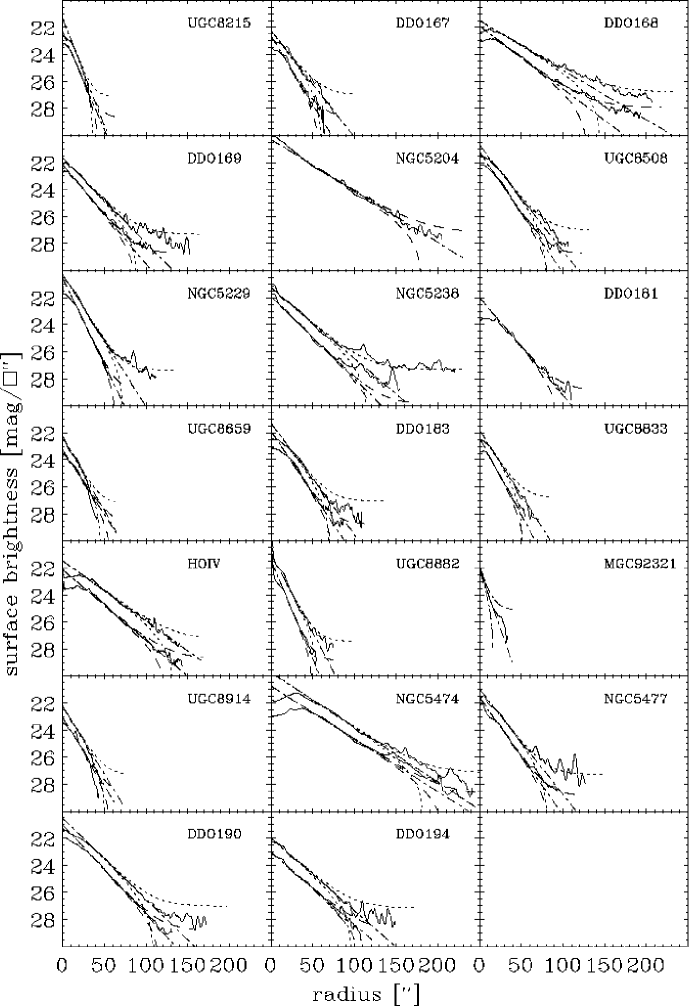
Surface brightness profiles were obtained by differentiating the growth curves with respect to radius. For 20 of our sample galaxies the resulting and profiles are shown in Fig. 3. No profile could be constructed for UGCA 342 due to a bright nearby star (cf. Sect. 6 and Fig. 2). The profiles have been slightly smoothed (with a running window of width ) and are plotted on a linear radius scale.
| Number | Galaxy | |||||||||||||
|---|---|---|---|---|---|---|---|---|---|---|---|---|---|---|
| (1) | (2) | (3) | (4) | (5) | (6) | (7) | (8) | (9) | (10) | (11) | (12) | (13) | (14) | (15) |
| 1. | UGC 08215 | 16.03 | 15.44 | 12.97 | 13.27 | 23.59 | 23.05 | 18.8 | 25.9 | 32.4 | 23.5 | 28.3 | 0.59 | |
| 2. | DDO 167 | 15.50 | 14.56 | 19.16 | 22.76 | 23.91 | 23.34 | 24.4 | 33.0 | 43.1 | 34.1 | 50.9 | 62.3 | 0.94 |
| 3. | DDO 168 | 13.04 | 12.03 | 45.97 | 58.55 | 23.35 | 22.87 | 66.8 | 92.8 | 130.9 | 105.9 | 145.1 | 184.3 | 1.01 |
| 5. | DDO 169 | 14.27 | 13.37 | 26.18 | 31.75 | 23.36 | 22.87 | 38.3 | 53.5 | 71.1 | 55.1 | 68.8 | 103.2 | 0.90 |
| 6 | NGC 5204 | 10.94 | 43.45 | 21.13 | 124.8 | 152.3 | 178.7 | |||||||
| 7. | UGC 08508 | 13.88 | 13.07 | 23.52 | 26.10 | 22.74 | 22.16 | 41.9 | 53.7 | 70.5 | 54.2 | 75.2 | 87.0 | 0.81 |
| 8. | NGC 5229 | 14.10 | 12.98 | 16.65 | 18.76 | 22.21 | 21.35 | 35.4 | 43.6 | 50.3 | 48.2 | 60.5 | 89.6 | 1.12 |
| 9. | NGC 5238 | 13.55 | 12.54 | 31.20 | 38.37 | 23.02 | 22.46 | 49.3 | 68.1 | 93.0 | 70.8 | 115.0 | 145.1 | 1.01 |
| 10. | DDO 181 | 14.36 | 30.95 | 23.81 | 42.8 | 56.0 | 69.2 | |||||||
| 11. | UGC 08659 | 16.16 | 15.41 | 16.09 | 15.50 | 24.20 | 23.36 | 19.1 | 28.0 | 34.0 | 25.0 | 31.6 | 38.2 | 0.75 |
| 12. | DDO 183 | 14.64 | 13.78 | 24.31 | 27.47 | 23.57 | 22.98 | 35.6 | 45.1 | 55.7 | 45.5 | 57.4 | 70.1 | 0.86 |
| 13. | UGC 08833 | 15.58 | 14.63 | 16.73 | 19.21 | 23.70 | 23.05 | 23.1 | 31.7 | 41.0 | 33.0 | 42.6 | 53.4 | 0.95 |
| 14. | HO iv | 13.65 | 12.58 | 39.14 | 44.29 | 23.61 | 22.82 | 56.3 | 71.6 | 93.3 | 78.7 | 103.9 | 124.0 | 1.07 |
| 15. | UGC 08882 | 15.28 | 13.99 | 14.73 | 15.37 | 23.12 | 21.92 | 24.7 | 31.2 | 39.4 | 34.2 | 44.4 | 58.6 | 1.29 |
| 16. | MCG 9-23-21 | |||||||||||||
| 17. | UGC 08914 | 16.00 | 15.19 | 16.28 | 16.23 | 24.06 | 23.25 | 20.9 | 28.5 | 34.3 | 27.5 | 34.9 | 41.2 | 0.81 |
| 18. | NGC 5474 | 11.77 | 10.83 | 59.12 | 57.10 | 22.63 | 21.62 | 105.0 | 151.2 | 174.7 | 136.3 | 169.9 | 194.1 | 0.94 |
| 19. | NGC 5477 | 14.19 | 13.16 | 24.04 | 27.37 | 23.10 | 22.34 | 39.5 | 50.9 | 68.1 | 51.3 | 74.1 | 103.2 | 1.03 |
| 21. | DDO 190 | 13.10 | 12.37 | 32.19 | 35.40 | 22.64 | 22.11 | 59.9 | 75.3 | 92.7 | 74.6 | 92.3 | 109.9 | 0.73 |
| 22. | DDO 194 | 14.52 | 13.40 | 33.02 | 35.98 | 24.11 | 23.18 | 37.4 | 56.1 | 73.2 | 56.7 | 75.0 | 93.2 | 1.12 |
4.2 The exponential model: fits and parameters
It is well accepted that the radial intensity profiles of dwarf galaxies can be reasonably well fitted by a simple exponential De Vaucouleurs (1959); Binggeli and Cameron (1993). This applies not only for dwarf ellipticals, but also for irregulars, if one looks aside from the brighter star-forming regions and considers the underlying older populations. These profiles can be written as
| (2) |
which in surface brightness representation becomes a straight line
| (3) |
The central extrapolated surface brightness and the exponential scale length are the two free parameters of the exponential fit. In this work the fits to the profiles were done on the outer parts of the profiles by a least squares fitting procedure (note, however, that the very outermost parts were not considered in the fitting, as they are often “flaring up”, see below Sect. 5). The best-fitting parameters are listed in Table 4. The best-fitting exponential profiles are plotted as dash-dotted lines along with the observed profiles in Fig. 3.
The deviation from a pure exponential law is expressed by the difference between the total magnitude of an exponential intensity law given by
| (4) |
and the actual measured total magnitude. The results are shown in
Table 4. The difference is an indication of the
goodness of fit of the exponential intensity profile. The columns of
Table 4 are as follows:
Column 1: as column 1 of Table 3
Column 2: as column 2 of Table 3
Column 3: extrapolated central surface brightness according to
equation 3 in
Column 4: as above but in
Column 5: exponential scale length in
Column 6: as above but in
Column 7: difference between the total magnitude as derived from the
exponential model and the true total magnitude in
Column 8: as above but in
Column 9: radial colour gradient determined from the difference in the
slopes of the model fits as described in Sect. 4.3
.
| Number | Galaxy | |||||||
|---|---|---|---|---|---|---|---|---|
| (1) | (2) | (3) | (4) | (5) | (6) | (7) | (8) | (9) |
| 1. | UGC 8215 | 22.29 | 21.28 | 7.43 | 6.79 | -0.09 | -0.32 | -0.014 |
| 2. | DDO 167 | 22.64 | 22.24 | 10.71 | 13.76 | -0.01 | -0.01 | 0.022 |
| 3. | DDO 168 | 21.89 | 21.49 | 23.34 | 29.59 | 0.01 | 0.10 | 0.010 |
| 5. | DDO 169 | 22.15 | 21.63 | 14.74 | 17.16 | 0.04 | 0.09 | 0.010 |
| 6. | NGC 5204 | 20.29 | 28.50 | 0.08 | -0.038 | |||
| 7. | UGC 8508 | 21.24 | 20.73 | 12.15 | 13.89 | -0.06 | -0.05 | 0.011 |
| 8. | NGC 5229 | 20.51 | 20.26 | 8.49 | 11.09 | -0.23 | 0.05 | 0.030 |
| 9. | NGC 5238 | 21.90 | 21.27 | 17.83 | 20.73 | 0.09 | 0.15 | 0.009 |
| 10. | DDO 181 | 22.00 | 15.02 | -0.24 | ||||
| 11. | UGC 8659 | 23.21 | 22.24 | 11.25 | 9.85 | -0.21 | -0.14 | -0.014 |
| 12. | DDO 183 | 21.89 | 21.29 | 11.82 | 13.18 | -0.11 | -0.09 | 0.009 |
| 13. | UGC 8833 | 22.41 | 21.82 | 9.60 | 11.31 | -0.08 | -0.08 | 0.017 |
| 14. | HO iv | 22.11 | 21.46 | 20.68 | 24.44 | -0.12 | -0.06 | 0.008 |
| 15. | UGC 8882 | 21.48 | 20.97 | 7.50 | 9.36 | -0.17 | 0.12 | 0.029 |
| 16. | MCG 9-23-21 | 22.03 | 6.08 | |||||
| 17. | UGC 8914 | 23.02 | 22.21 | 10.71 | 10.79 | -0.13 | -0.14 | 0.001 |
| 18. | NGC 5474 | 20.75 | 19.74 | 27.85 | 26.81 | -0.24 | -0.23 | -0.002 |
| 19. | NGC 5477 | 21.59 | 20.99 | 12.53 | 13.99 | -0.09 | 0.10 | 0.009 |
| 21. | DDO 190 | 20.99 | 20.51 | 16.36 | 18.10 | -0.18 | -0.15 | 0.006 |
| 22. | DDO 194 | 23.03 | 21.98 | 20.25 | 20.23 | -0.02 | 0.05 | -0.000 |
4.3 Colour gradients
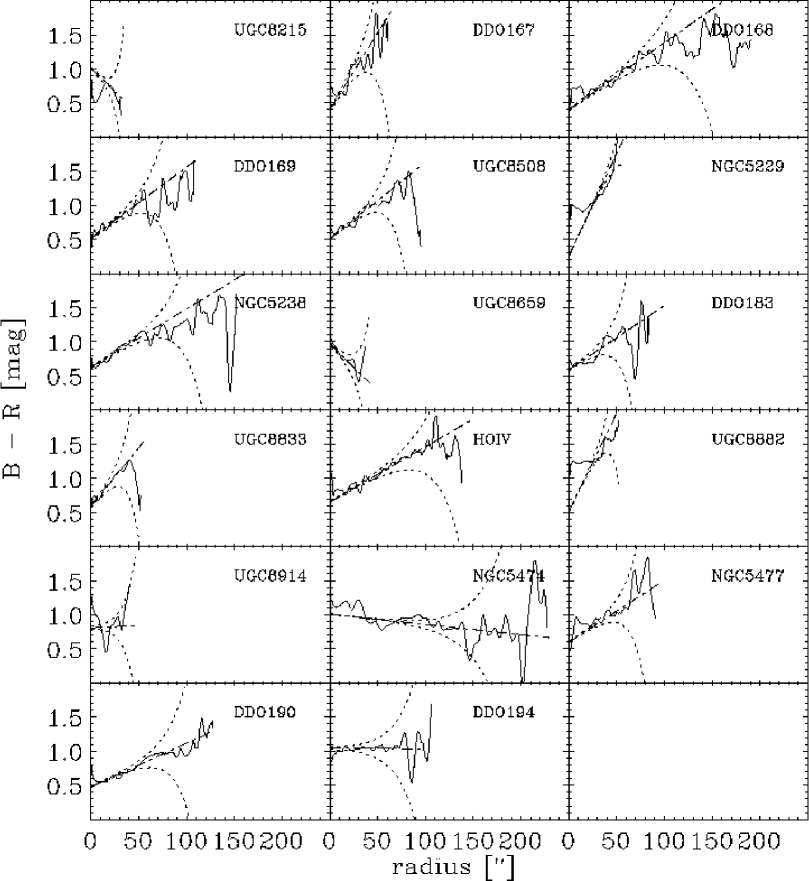
As one can see in Table 4, the colour gradients of the galaxies are very small, if not zero (). Many authors report that colour profiles show very small gradients or are flat in the case of dwarf galaxies Bremnes et al. (1998); Patterson and Thuan (1996). We find that if the galaxies do show a trend in their colour profiles, they become slightly redder with increasing radius. The actual colour profiles together with the difference between the slopes of exponential fits (dash-dotted) are plotted in Fig. 4.
4.4 Photometric uncertainties
Uncertainties in the photometry have multiple sources: calibration errors, flatfielding and sky subtraction, photon shot noise, readout noise, contamination by cosmic rays, foreground stars and background galaxies…
The largest contribution to the uncertainties in the global photometric parameters is the photometric calibration. As the nights were non-photometric, one must beware of uncontrollable errors in the zero-point and the extinction coefficient. The statistical uncertainty on the photometric calibration is of the order of mag, due to an uncertainty of mag and on the zero-point and the extinction coefficient, respectively.
The uncertainties on the photometric profiles at low levels are dominated by the non-flatness of the sky background. The pixel-to-pixel fluctuations caused by photon shot noise are averaged out by measuring azimuthally averaged profiles. At typical sky levels of the order of in , and in , and a flat-fielding accurate to of the sky background, the sky fluctuations reach values similar to the the galaxy profiles at respectively and .
To have a handle on this error along a profile, we have calculated error envelopes for all our profiles based on their best-fitting exponentials. The combined uncertainty caused by photon shot noise from the sky and the galaxy, calculated for azimuthally averaged annuli, has been added in quadrature with a large-scale sky flatness and subtraction error term set to a constant of the actual sky electron counts. The error term obtained this way has been added or subtracted, respectively, from the intensity profiles corresponding to exponential surface brightness profiles and then converted to magnitudes to produce the upper and lower error envelopes. These error envelopes are shown in Fig. 3 along with the observed and model profiles. The colour profile error envelopes, shown in Fig. 4 as dotted lines, have been calculated by using the error term as described above for each colour and applying usual error formulae for logarithms and combining the errors thus obtained for each colour by quadrature. It is to be noted that the large scale fluctuation level of of the sky background is an upper limit, most frames showing less variation, i.e. these error estimates are rather conservative. The calibration zero-point uncertainty is not included in the plots.
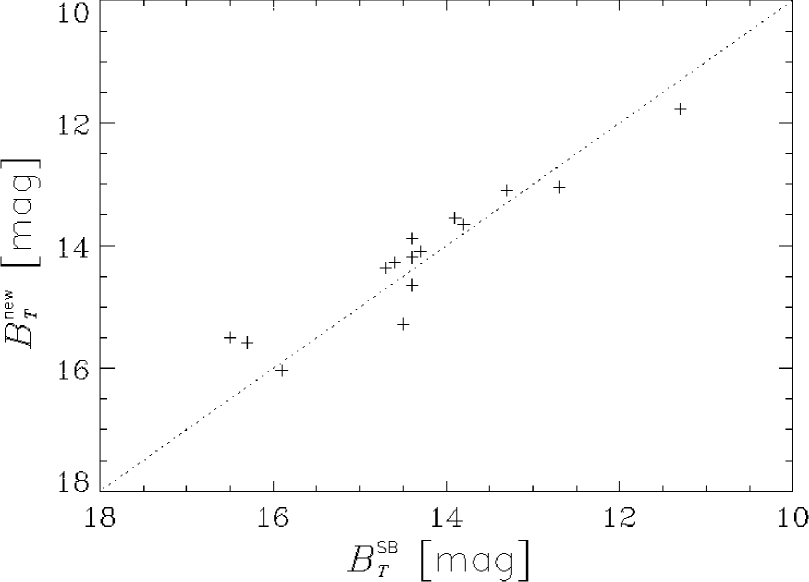
The errors on the profiles at low luminosity do not influence the total magnitude to a large extent, but sources projected onto or near the galaxies do. We masked out such objects, trying not to eliminate H ii regions from the galaxy. An overall assessment of our photometric accuracy is provided by a comparison with external data. In Fig. 5 photometry from this paper is compared to data published in Schmidt & Boller Schmidt and Boller (1992a). The agreement is quite good, in the band.
5 Discussion
The surface brightness profiles shown in Fig. 3 are quite typical for dwarf galaxies, being more or less straight lines, i.e. exponentials, in a large range of intermediate radii, with deviations from this in the innermost and the outermost parts, i.e. at small and very large radii; compare, e.g., with the profiles of M81 group dwarfs in Paper I, and of Virgo cluster dwarfs in Binggeli & Cameron Binggeli and Cameron (1993). The inner deviation from the exponential can be a luminosity cusp, which is common among dwarf ellipticals, especially nucleated ones. This feature is well seen in the only dwarf elliptical of our sample, UGC 8882. Late-type dwarf galaxies (Sd, Sm, Im), on the other hand, tend to exhibit a central luminosity deficit with respect to the best-fitting exponential (see again Fig. 3). In most cases this deficit is simply caused by the irregular structure of the star-forming region which is confined to the central part of a galaxy. The peak surface brightness of a star-forming galaxy can be far off the center as referred to the faint outer isophotes. If the profile is centered on the faint outer isophotes (which in our opinion is the only way a profile makes sense, as it should, ideally, refer to center of the mass and not the luminosity distrubution), then the consequence is obviously an apparent luminosity deficit in the central part. This is dramatically demonstrated by NGC 5474, but also Ho IV (see Figs. 2 and 3). It simply means that the innermost part of the mean radial profile of a dwarf irregular (and sometimes even a late spiral) should not be taken at face value. This is a principal limitation of one-dimensional “surface” photometry of non-symmetric galaxies.
Some of our galaxies show a luminosity excess above a pure exponential in the surface brightness profiles at large radii (Fig. 3), most strongly in NGC 5238, but also in DDO 168, DDO 169, DDO 183, NGC 5477, DDO 190, and DDO 194. NGC 5229 also shows an excess in one colour but in this case our photometric method is clearly not well suited, due to the galaxy being almost edge-on and warped. On average this excess sets in at a surface brightness of in and in . This trend was not observed with our M81 group dwarfs (Paper I), nor was it found in Virgo cluster irregulars, see Fig. 9 in Binggeli & Cameron Binggeli and Cameron (1993), whose radial profiles were followed to equally faint levels (most other photometric studies do not go faint enough, which renders a comparison difficult).
A possible reason one could think of for this feature is the fact that in the present photometry the elliptical shape of the running aperture was fixed for a given galaxy. That ellipse was determined at approximately (cf. Sect. 3). Suppose that the outermost part of a galaxy, at a surface brightness level well below , is more spherical than the inner part, or that there is strong isophotal twisting: then the mean surface brightness profile derived from apertures of fixed ellipticity will become flatter at large radii, i.e. will show an excess of the kind discussed here. Galaxies such as DDO 168, DDO 169 and NGC 5238 show such a behaviour, but at very low levels. For instance DDO 168 has an apparent ellipticity of and a position angle of degrees for an ellipse fit at and at these values are resp. and . For DDO 169 these values are resp. , , and and for NGC 5238 these values are resp. , , and . In the last case then rises to in the outermost regions, with unchanged PA. It seems unlikely that this is the reason for the excess.
A possible physical explanation of the observed break in the surface brightness profiles – well-known from the photometry of disk galaxies – is of course the presence of two distinct galaxian components (like bulge and disk). The existence, in dwarf irregulars, of an underlying population of old stars that stretches over a large characteristic scale length, with a luminous, more concentrated, young population on top of it, is indeed highly expected. It has recently been shown that Local Group dwarf irregulars possess extended old halos Minniti and Zijlstra (1996). With this regard it is also interesting that the observed break in the surface brightness profiles of our dwarfs seems to be well correlated with a flattening of the corresponding colour profiles (see Fig. 4). The colour of the excess light is rather red, with the onset of the flatter part at a value of .
So, have we detected an underlying old halo population on purely photometric grounds? Unfortunaletly, this cannot be claimed (yet). The deviations from the exponential luminosity and colour profiles discussed here are mostly well within the error envelopes, as indicated in Figs. 3 and 4. Hence the significance for a single case is quite weak. However, we note again that the error envelopes are rather conservative (also see the note on DDO 168 below). The tendency seen in so many galaxies is certainly very suggestive and a follow-up of this question by means of multicolour photometry of very high accuracy and sensitivity, in order to definitively prove the reality of the phenomenon, seems very desirable.
6 Notes on individual galaxies
UGC 8215: small irregular with a relatively steep light profile. The central part shows a slight deficit compared to a pure exponential. One of the few galaxies with a slight bluing of its colours towards larger radii (but could also have a flat colour profile within the errors).
DDO 167: slightly more irregular than UGC 8215, but has identical lightprofile characteristics.
DDO 168: shows an excess in its surface brightness profiles with respect to a pure exponential at large radii as well as a deficit in the central regions. Its colour profile displays a clear flattening from the point at which the luminosity excess becomes visible in the profiles. But the error envelopes are large at those points both in the radial profiles and colour profiles. It is to be noted though that for this galaxy, the measured sky counts after subtraction were marginally negative around the galaxy. Therefore one should have seen a slight deficit in the outer parts of the brightness profiles rather than an excess, if the deviations were only due to the uncertainties.
UGCA 342: very irregular, and projected close to a bright star. At a velocity of 388 it might belong to the outskirts of M 63, which has a redshift of 504 . Indeed, UGCA 342 is only from M 63, which is less than one optical diameter of M 63. At a distance of Mpc () this represents kpc in projected distance. Some diffuse features are visible in the image, especially to the south-east of UGCA 342, supporting the idea that UGCA 342 is some luminous condensation in the outer part of M 63. An optical image with a radio map of M 63, provided by Fig. 6 in Bosma Bosma (1981), confirms this idea. Note the similar velocities at the coordinates of UGCA 342. The elongated shape, diffuseness, nearby bright star and background sky “structure” made accurate photometry impossible.
DDO 169: like DDO 168, one observes similar features in the surface brightness and colour profiles. Extended ‘tail’ towards the north. This tail seems to be slightly bluer than the rest of the galaxy.
NGC 5204: imaged in only.
UGC 08508: slight excess in the outer regions as well as a slight deficit in the inner regions. The excess is unlikely to be real.
NGC 5229: edge on, slightly warped.
NGC 5238: shows a relatively large excess in the surface brightness profiles, as well as a flattening of its colour profile. The characteristics of the excess and the colour profile are similar to those of DDO 168.
DDO 181: imaged only in . Pronounced brightness deficit with respect to a pure exponential in the centre.
UGC 08659: its colour profile shows a bluing with increasing radius. Irregular brighter knots.
DDO 183: slight surface brightness excess in the outer parts as well as a deficit in the inner part. Possible flattening of the colour profile.
UGC 08833: similar to DDO 167.
HO iv: the light is distributed in patches, and the surface brightness profile is almost flat in the inner regions.
UGC 08882: nucleated dwarf elliptical with a flat colour profile and a slightly blue nucleus relative to the bulk of the galaxy.
MGC 9-23-21: projected very close to a bright star, making accurate photometry very difficult. The relatively large light gradient around the galaxy more or less excludes accurate photometry of the fainter parts, especially considering the small angular size.
UGC 08914: shows a surface brighness profile that falls off faster than an exponential in the outer parts. Flat colour profile except for a red central region relative to the surrounding parts.
NGC 5474: highy asymmetrical galaxy. Too large for the field of view for accurate photometry due to sky subtracion difficulties.
NGC 5477: also shows a possible surface brightness excess in the outer parts. The colour profile on the other hand looks more usual.
DDO 190: redder central part that is slightly less bright than predicted by an exponential profile.
DDO 194: flat colour profile except for a slightly bluer nucleus.
Appendix: Elliptical vs. circular aperture photometry
We here compare the method used in this paper and that used in Paper I, i.e. elliptical vs. circular aperture photometry. Figs. 6 to 10 compare the different photometric parameters obtained with the two methods. The comparison is useful for future studies of a sample of galaxies measured by either of these two methods.
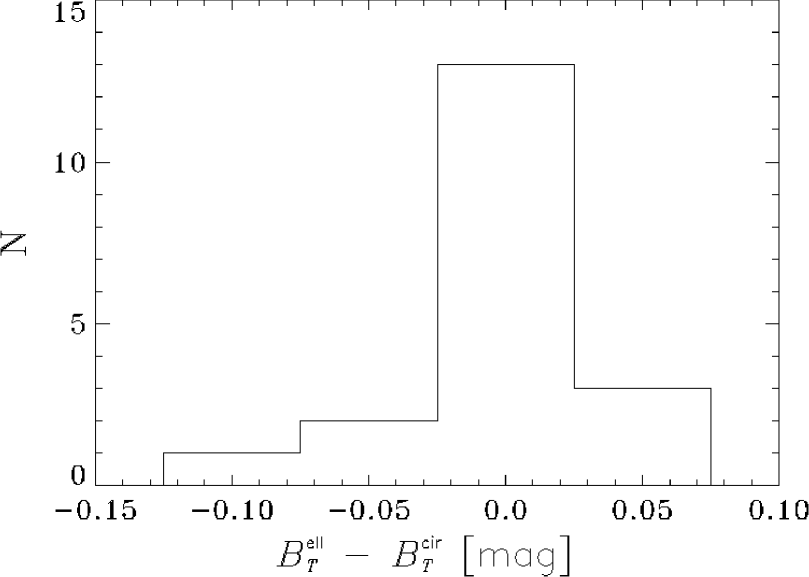
From Fig. 6 one can see the excellent agreement between the elliptical and the circular aperture photometry as far as the total magnitudes are concerned. The vast majority of the galaxies show differences less than .
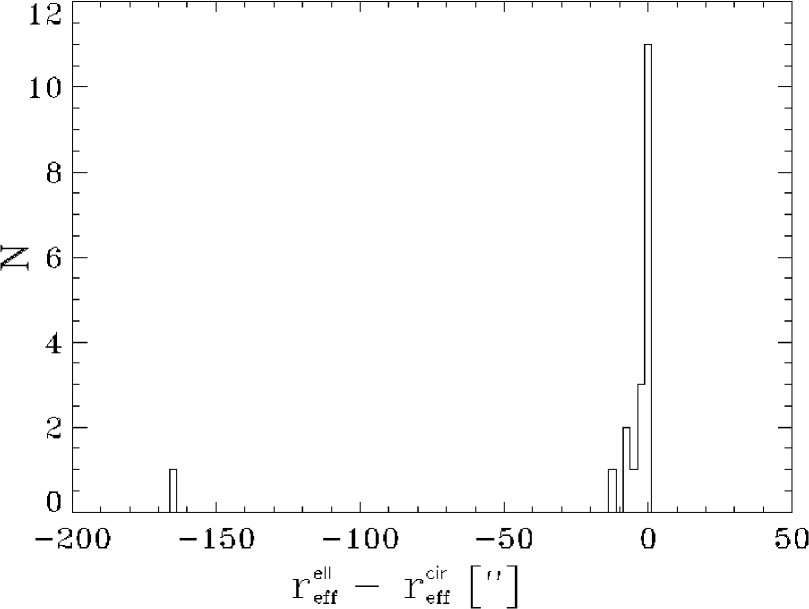
Fig. 7, shows that the effective radius measurements strongly depend on the apparent shape of the galaxies. Elongated galaxies, as illustrated by NGC 5229, which has an apparent ellipticity of , show different effective radii as measured by the different methods. In such cases the circular aperture photometry is clearly inadequate.
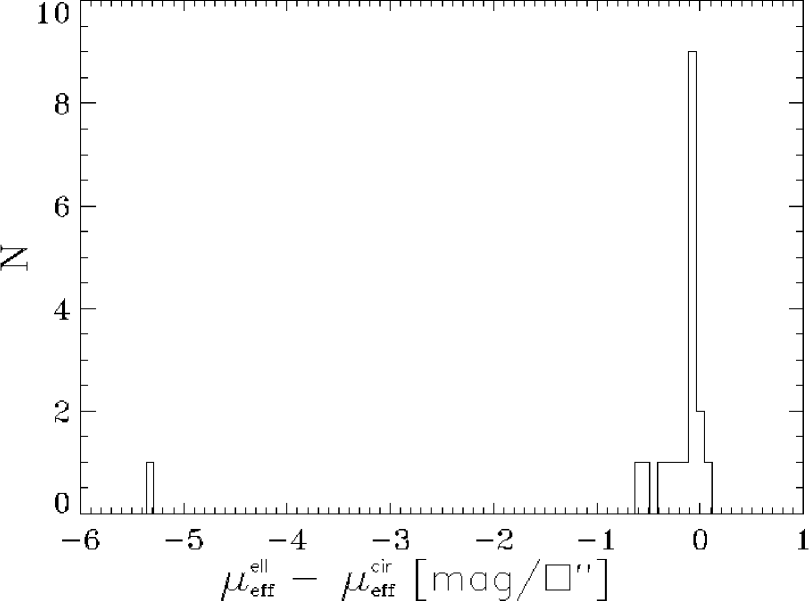
The effective surface brightness obtained by the two methods show reasonable agreement except, as noted above and for the same reasons, in the case of very elongated objects, see Fig. 8.
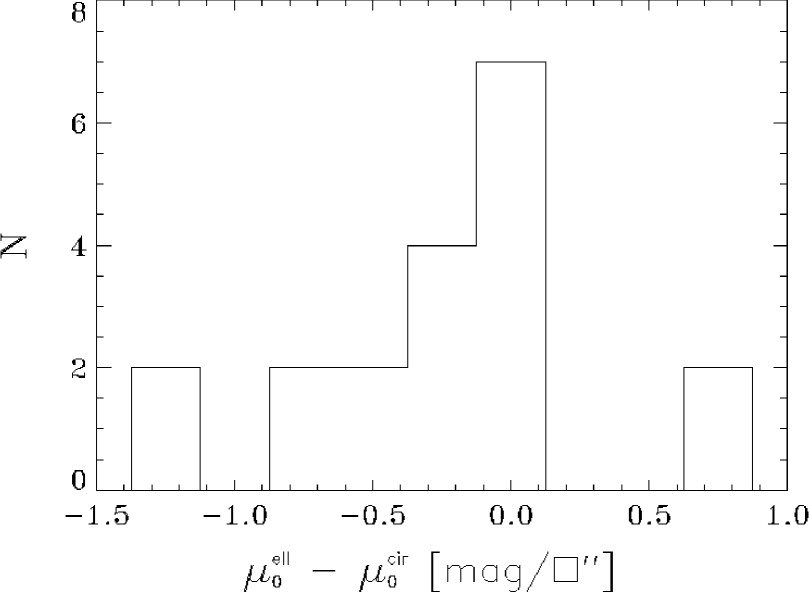
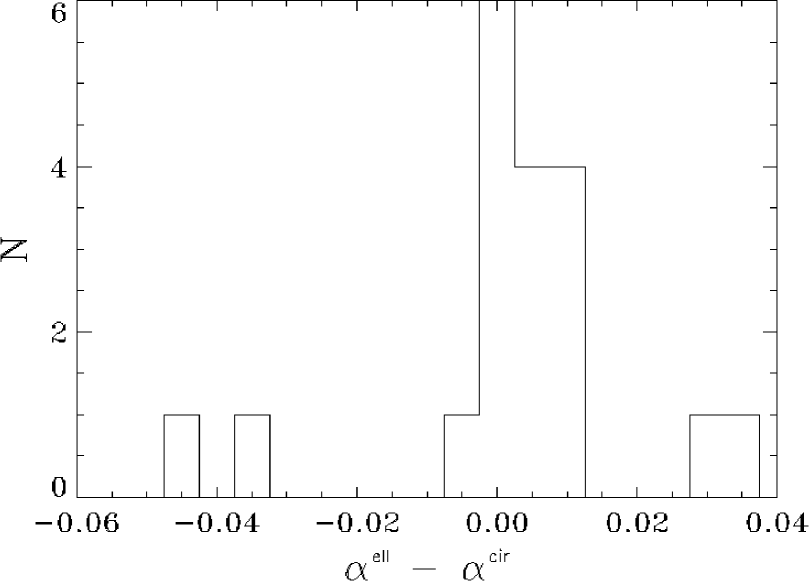
As can be seen in the plots for the exponential fit parameters and , Figs. 9 and 10, the circular apertures yield slightly larger scale-lengths and lower central surface brightnesses on average than the elliptical apertures.
Acknowledgements.
T.B. and B.B. thank the Swiss National Science Foundation for financial support. We also thank Frank Thim for taking part in the observing run and the referee for useful comments. This research has made use of the NASA/IPAC Extragalactic Database (NED) which is operated by the Jet Propulsion Laboratory, California Institute of Technology, under contract with the National Aeronautics and Space Administration, as well as NASA’s Astrophysics Data System Abstract Service.References
- Binggeli and Cameron (1991) Binggeli, B. and Cameron, L. M.: 1991, Astron. Astrophys. 252, 27
- Binggeli and Cameron (1993) Binggeli, B. and Cameron, L. M.: 1993, Astron. Astrophys. Suppl. Ser. 98, 297
- Bosma (1981) Bosma, A.: 1981, Astron. J. 86, 1791
- Bremnes et al. (1998) Bremnes, T., Binggeli, B., and Prugniel, P.: 1998, Astron. Astrophys. Suppl. Ser. 129, 1
- De Vaucouleurs (1959) De Vaucouleurs, G.: 1959, Handbuch der Physik, Vol. 53, p. 275, ed. S. Flügge, Springer, Berlin
- Karachentsev (1996) Karachentsev, I.: 1996, Astron. Astrophys. 305, 33
- Karachentseva and Karachentsev (1998) Karachentseva, V. E. and Karachentsev, I. D.: 1998, Astron. Astrophys. Suppl. Ser. 127, 409
- Kraan-Korteweg and Tammann (1979) Kraan-Korteweg, R. C. and Tammann, G. A.: 1979, Astron. Nachr. 300, 181
- Lesaffre et al. (1999) Lesaffre, P., Prugniel, P., Binggeli, B., and Bremnes, T.: 1999, in preparation
- Minniti and Zijlstra (1996) Minniti, A. and Zijlstra, A. A.: 1996, Astrophys. J. 467, L13
- Patterson and Thuan (1996) Patterson, R. J. and Thuan, T. X.: 1996, Astrophys. J., Suppl. Ser. 107, 103
- Sandage and Binggeli (1984) Sandage, A. and Binggeli, B.: 1984, Astron. J. 89, 919
- Sandage and Tammann (1974) Sandage, A. and Tammann, G. A.: 1974, Astrophys. J. 194, 223
- Sandage and Tammann (1987) Sandage, A. and Tammann, G. A.: 1987, A revised Shapley-Ames Catalog of bright galaxies, 2nd ed., Carnegie Institution of Washington Publication, Washington
- Schmidt and Boller (1992a) Schmidt, K. H. and Boller, T.: 1992a, Astron. Nachr. 313, 189
- Schmidt and Boller (1992b) Schmidt, K. H. and Boller, T.: 1992b, Astron. Nachr. 313, 329
- Smith et al. (1985) Smith, P. S., Balonek, T. J.and Heckert, P. A., Elston, R., and Schmidt, G. D.: 1985, Astron. J. 90, 1184