The Optical Module of the Baikal
Deep Underwater Neutrino Telescope
Abstract
A deep underwater Cherenkov telescope has been operating since 1993 in stages of growing size at 1.1 km depth in Lake Baikal. The key component of the telescope is the Optical Module (OM) which houses the highly sensitive phototube QUASAR-370. We describe design and parameters of the QUASAR-370, the layout of the optical module, the front-end electronics and the calibration procedures, and present selected results from the five-year operation underwater. Also, future developments with respect to a telescope consisting from several thousand OMs are discussed.
, , , , , , , , , , , , , , , , , , , , , , , , , , , ††thanks: corresponding author: phone +49 33762 77218, e-mail csspier@ifh.de , , , , .
1 Introduction
The Baikal Neutrino Telescope is being deployed in the Siberian Lake Baikal, about 3.6 km from shore at a depth of 1.1 km [1], [2]. The central mission of the project is the detection of extraterrestrial sources of high energy neutrinos. Other fields of interest [3] are the search for neutrinos from WIMP annihilation in the Earth or the Sun, for neutrino oscillations, and for slowly moving bright objects like GUT monopoles. Standard cosmic ray physics with muons generated in the atmosphere is covered as well as limnological and ecological questions.
In deep underwater detectors, clear water serves as target material for neutrino interactions, as Cherenkov radiator for charged particles, and as a shield against atmospheric muons and sunlight. Energetic neutrinos are detected easiest by mapping the Cherenkov light from muons produced in charged current interactions. ”Mapping” means measurement of the photon arrival times at photodetectors distributed over a large volume. The feebleness of the light signal requires a large-area, large-acceptance light detector with single photoelectron resolution. Mapping of the Cherenkov cone with a spatial accuracy not worse than the OM diameter requires a time resolution of a few nanoseconds. The water depth demands pressure protection of the sensor.
The present paper describes design and operation of the components of the optical module (OM) most of which have been developed within our collaboration. After a short presentation of the telescope in section 2, section 3 covers the design and the parameters of the phototube QUASAR-370. Section 4 gives the construction of the OM, section 5 describes the electronics and discusses the operational principle of two PMTs switched in coincidence. Section 6 presents results from the different methods of OM calibration, whereas in section 7 the long-term operation underwater is evaluated and some selected results of the telescope operation are given. Section 8 summarizes the results and sketches routes of further development.
2 The Telescope NT-200
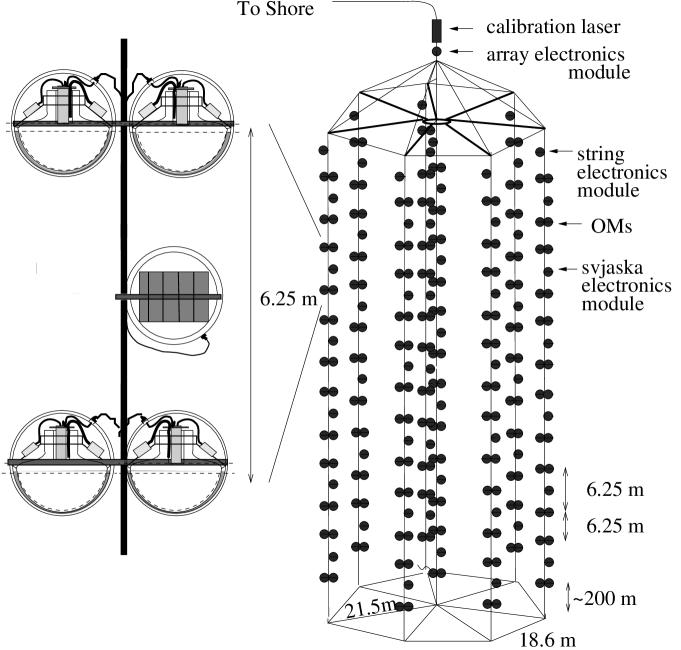
After numerous experiments with prototype configurations [2], in April 1993 we deployed a first underwater detector allowing three-dimensional track reconstruction of muons. This array NT-36 consisted of 36 OMs at 3 strings [4]. It was replaced in 1994 by a slightly modified version, in 1995 by a 72-OM array, in 1996 by NT-96 consisting of 96 OMs at 4 strings, and in 1997 by a 144-OM array. These detectors have been steps towards the Neutrino Telescope NT-200 [1, 2] with a total of 192 OMs. NT-200 was completed in April 1998 and is presently taking data. It is sketched in Fig. 1.
The OMs consist of a pressure glas housing equipped with the QUASAR-370. They are grouped in pairs along the strings. The two PMTs of a pair are switched in coincidence, defining a channel. The ”constructional” basic building block (called ”svjaska”) consists of two pairs of OMs, and the svjaska electronics module, SEM, which houses control units, power supply and the front-end electronics.
A muon trigger is formed if channels are hit within a time window of 500 nsec (this is about twice the time a relativistic particle needs to cross the NT-200 array). The value is typically set to 3 or 4. Times and amplitudes are digitized in the string electronic modules.
A second system ”monopole trigger” searches for counting rate patterns characteristic for slowly moving bright particles like nuclearities or GUT magnetic monopoles catalyzing proton decays. Depending on the velocity of the object, such events could cause enhanced counting rates in individual channels during time intervals of 0.1 - 0.8 msec, separable from Poissonian noise.
3 The Phototube
3.1 Construction and operational principle
The QUASAR-370 consists of an electro-optical preamplifier followed by a conventional photomultiplier (PMT) - see Fig. 2. In this hybrid scheme, photoelectrons from a large hemispherical cathode with 2 viewing angle are accelerated by 25 kV to a fast, high gain scintillator which is placed near the center of the glass bulb. The light from the scintillator is read out by a small conventional PMT named UGON. One photoelectron emerging from the hemispherical photocathode yields typically 25 photoelectrons in the conventional PMT. This high multiplication factor of the electro-optical preamplifier results in an excellent single electron resolution – important for the detection of low level light pulses and background suppression. Due to the fast acceleration of primary photoelectrons by 25 kV high voltage, the time jitter can be kept low. This is most important for accurate track reconstruction. Last not least, the tube is almost insensitive to the Earths magnetic field.

A hybrid phototube of this kind, XP2600, was first developed by PHILIPS [5, 6]. After first experience with the XP2600 we followed their basic design and developed the ”QUASAR”.
First versions of the QUASAR-tube had a spherical shape, with diameters of 30 cm (QUASAR-300) and 35 cm (QUASAR-350), respectively. The latest version – QUASAR-370 – has a nonspherical (mushroom) shape of the glass bulb to provide more isochronic photoelectron trajectories. Fig. 3 gives the measured relative transit time as a function of the zenith angle. The transit time differences are minimized to 2.0 nsec.


The spherical ”face” region of the bulb has a diameter of 37 cm. Modifications towards the mushroom form are made at large zenith angles. The bulb is manufatured from borosilicate glass S49-1 by the EKRAN company, Novosibirsk. The photocathode is of the bialkali type (K2CsSb). Its spectral response is typical for this type of photocathode, with a maximum at = 400 - 420 nm. The spectral sensitivity exceeds 60 mA/W at nm which corresponds to quantum efficiency. The non-uniformity of the response across the photocathode is less than 30 % (see Fig. 4).
The luminescent screen is made from pulverized phosphor, Y2SiO5(YSO). This scintillator has a light yield of 20 - 30 % relative to NaI(Tl) and 30 - 40 ns decay time.
3.2 Single Photoelectron Resolution
The single photoelectron resolution of the QUASAR-370 is defined mainly by the gain of the electro-optical preamplifier:
| (1) |
Figs. 5 and 6 show typical charge distributions for single- and multi-photoelectron pulses of a QUASAR-370. The high amplification factor allows to separate pulses of one and two photoelectrons and to identify even the shoulder from 3 p.e. events. The light pulse has been generated by a light emitting diode. The distribution labeled ”single p.e.” has been obtained by attenuating the LED to a level when only every tenth LED pulse triggered the QUASAR.
Averaged over 100 tubes, the mean values for single photoelectron resolution SPR, peak-to-valley ratio P/V, and gain are
-
•
SPR 70 % (FWHM),
-
•
P/V 2.5,
-
•
G 25.


3.3 Time Response
A single photoelectron pulse of the QUASAR-370 is a superposition of single photoelectron pulses of the small tube UGON, distributed exponentially in time:
| (2) |
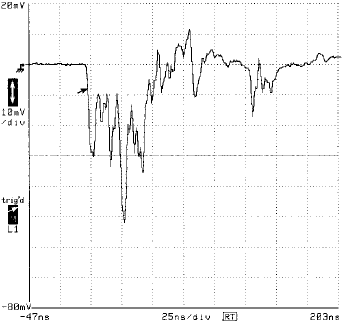
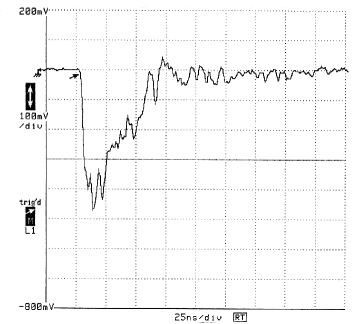
with being the time constant of the scintillator. Figs. 7 and 8 show the corresponding typical pulseforms of single and multi-photoelectron pulses.
The best single photoelectron time resolution is obtained by using a double threshold discriminator as sketched in Fig. 9. It consists of two discriminators with different thresholds and integration constants: a timing discriminator with a threshold of and a strobe discriminator with a threshold of ( and are the most probable charges of a single photoelectron pulse from the small PMT and from the big photocathode, respectively).

The time is defined by the front of the first of the single photoelectron pulses of the small PMT. In this case, the transit time distribution for single photoelectron pulses with respect to the big photocathode is described by
| (3) |
is determined by the scintillator decay time constant and by the gain of the electro-optical preamplifier. For the best tubes and an accelerating voltage of 25 kV, is about 50, and the FWHM of is 1.8 nsec for point illumination. For typical tubes the transit time FWHM is between 2 and 3.5 nsec. Fig. 10 shows the single photoelectron transit time distribution for head-on full-cathode illumination. The measured FWHM (3.8 nsec) is a convolution of the jitter for point illumination and the transit time differences from different parts of the photocathode.

We should note here that some ”late” events contribute to the tail of the distribution. These events are due to backscattering of photoelectrons in the luminescent screen. Elastically (or nearly elastically) scattered electrons may leave the screen without yielding a signal above the discriminator threshold. They are bent back by the electrical field in the electro-optical preamplifier and hit the screen a second time. Due to the high voltage (25 kV), the scale of delay times of late events in the QUASAR-370 is considerably smaller than in conventional PMTs – about 10 nsec compared to 30 - 100 nsec.
The level of ordinary afterpulses in the QUASAR-370 is substantially less( 2%) than in conventional PMTs. The reasons are a) the complete vacuum separation between the electro-optical preamplifier and the small PMT, and b) the low sensitivity of the photocathode to backscattered X-ray photons of typically 10 keV (compared to some 100 eV in conventional PMTs).
Table I summarizes the main parameters of the QUASAR-370 and of the small PMT UGON.
Table I
| QUASAR-370 | UGON | |
| bulb material | borosilicate glass | borosilicate glass |
| photocathode | K2CsSb | K2CsSb |
| photocatode diameter | 37 cm | 2.5 cm |
| spectral sensitivity ant = 410 nm | 60 mA/W | 60 mA/W |
| number of stages | 1 | 12/13 |
| gain | 25 | 107 |
| 1-PE resolution | 70 % | – |
| peak-to-valley ration (1PE) | 2.5 | 1.3 |
| TT difference (center-edge) | 1.5 nsec | 1 nsec |
| TT jitter for 1 PE point illumination | 2 nsec | 2.2 nsec |
| noise rate ( 0.25 PE, 20oC) | 30 kHz | 1 kHz |
4 Design of the Optical Module
4.1 General Description
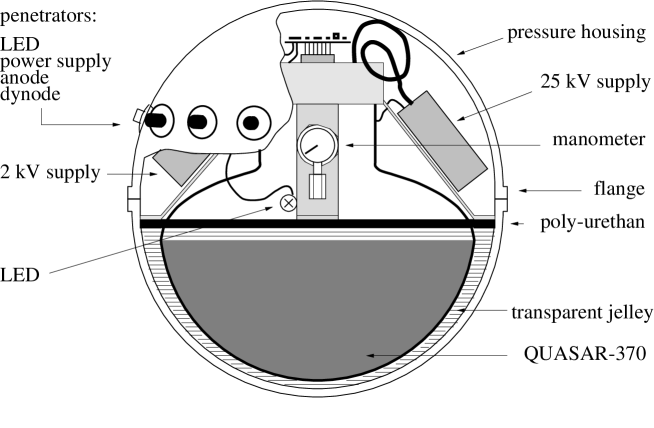
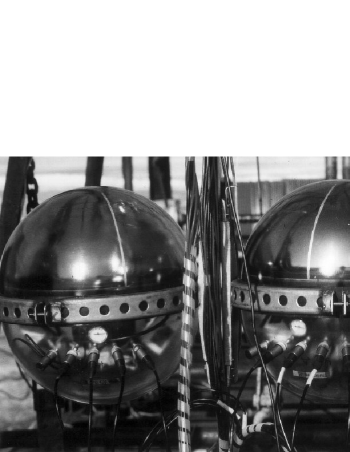
The OM basically consists of the QUASAR-370 enclosed in a transparent, nearly spherical pressure housing, see Fig. 11. The optical contact between the photocathode region of the tube and the pressure sphere is made by liquid glyzerine sealed with a layer of polyurethane. Apart from the PMT, the OM contains two HV supplies (25 kV and 2 kV) for the hybrid PMT, a voltage divider, two preamplifiers, a calibration LED and a vacuum probe. Each OM is electrically connected to the Svjaska Electronics Module (SEM, see figs.1 and 15) by four electrical lines. They pass the signal driving the LED from the SEM to the OM, and the PMT anode and dynode signal from the OM to the SEM. The fourth cable supplies the low voltages for the PMT HV-system and the preamplifier. A vacuum valve (not shown in Fig. 11) allows to evacuate the sphere to 0.7 atm (see section 4.2). The OM is fixed to the string by a steel frame locked via a shackle. Fig. 12 shows a photography of an OM pair.
4.2 Pressure Housing
Early approaches
For the single string installations operated up to 1989 at Lake Baikal, cylindrical housings made from epoxy reinforced fiber glass have been used. These OMs housed two 15-cm tubes with flat window, facing upward and downward, respectively. The PMTs were covered with end caps made from plexiglas. Limits on the flux of GUT monopoles catalyzing baryon decay as well as a variety of limnologically relevant results have been obtained with single strings carrying these OMs [2]. With the advent of big hemispherical tubes this solution was discarded. In parallel to the tests of the early versions of the QUASAR [9], we considered a pressure resistant phototube and tested pilot samples of appropriate glass spheres with 37 cm diameter and 0.8 - 1 cm wall thickness [11]. However, in order to have more flexibility for future improvements of the phototube, we soon decided to use separate PMTs and pressure housings.
Present design
Traditional housings for large deep underwater instruments consist of two hemispheres whose equatorial surfaces are carefully ground to match each other. spheres are produced by BENTHOS Inc, USA, and Jena-Glass, Germany (VITROVEX). In 1987, together with the EKRAN company (Novosibirsk) we started the design of an own pressure housing. It consists from the same S49-1 borosilicate glass used for the bulb of the QUASAR-370. Its refractive index is 1.47 - 1.48. Since we developed the housings for our own purpose, we could optimize form and dimensions to fit the demands of the Baikal experiment. The originally spherical form was elongated by adding a cylindrical part of 2 cm to the equator of each hemisphere. This allowed i) to avoid space problems when mounting the tube with its high voltage module into the housing and ii) additionally to use the same housing for the underwater modules housing electronics crates. The elongated housing is superior to a sphere with bigger diameter since the layer of immersion material between tube bulb and pressure housing can be kept thinner. This as well as the small wall thickness (1.0 cm compared to 1.4 cm for BENTHOS and VITROVEX) results in a low light absorbtion. The 1.4 cm spheres withstand a water depth of 6.7 km, the wall thickness of the EKRAN sphere is sufficient to work at all depths in Lake Baikal (max. 1632 m). The transmission at 500 nm is 87 % for the EKRAN sphere, and 83 % for the other two spheres.
In order to simplify the construction of the metallic belt used to clamp the OM to the string, the wall thickness at the equator was increased to 13 mm, forming a flange. The hermetization of the OM along the equator is achieved by evacuating it via a special valve to 0.5 - 0.7 atm and sealing it by homogenizing adhesive tape.
4.3 Optical Contact
The immersion material filling the gap between the bulb of the phototube and the pressure housing should have a) a good transparency, b) an index of refraction close to that of glass and c) high elasticity in order to protect the bulb from deformation of the pressure housing ( 0.5 mm at 140 atm).

In the standard approach, optically transparent silicon jelleys are used [12, 13, 14]. We have developed an alternative, new method: The gap between tube and housing is filled with glyzerine and sealed by casting a liquid polyurethane compound to the glyzerine surface. The compound, being lighter than glyzerine, polymerizes and forms a stable sleeve. The sleeve prevents the glyzerine to leak into the back hemisphere of the OM which houses the HV supplies and other electronic components. It fixes the position of the tube and at the same time does not prevent the minor displacements necessary to balance the pressure deformations of the housing. The advantages of this method are the following: a) the index of refraction of glyzerine practically coincides with that of glass ( = 1.47), b) there is no ”delamination” of the immersion material from the glass, a phenomenon easily appearing when working with jelley, c) the cost is low. The disadvantage is the risk that the polyurethane might leak in which case not only the optical contact is lost but also the glyzerine may corrode the electronics.
In parallel, we use the standard method which we tested first in 1992. The gap is filled with a two-component silicon jelley (SEMICOSIL, produced by WACKER, Germany) with an index of refraction 1.40. Eight OMs (VITROVEX spheres) with SEMICOSIL jelley were underwater for one year in 1992/93, without showing any degradation of optical or mechanical characteristics. Presently, we use VITROVEX spheres and SEMICOSIL jelley for about 10 % of all OMs.
The transparencies of pressure housings, glyzerine and jelley are shown in Fig. 13 as a function of wavelength.
4.4 Hermetic connectors
The design of our connectors and penetrators started from the vacuum-proofed HF connector SRG-50-863 produced in Russia. The connector has an impedance of 50 Ohms and withstands working voltages up, to 500 V and temperature extremes from -50oC to +155oC. Following the experience we had gained formerly with connectors produced by SEACON (USA), we modified the SRG-50-863 for deep underwater applications. The new connector is hermetic up to a pressure of 200 atm. The outer screen is in electrical contact with water. In salt water this would result in strong electro-corrosion; in fresh water, however, it is of negligible relevance. The hermetic connectors and penetrators developed in cooperation with the AKIN laboratory, Moscow, can be operated at all depths of Lake Baikal, i.e. down to 1.7 km.
5 Operational Principle
5.1 Electronics
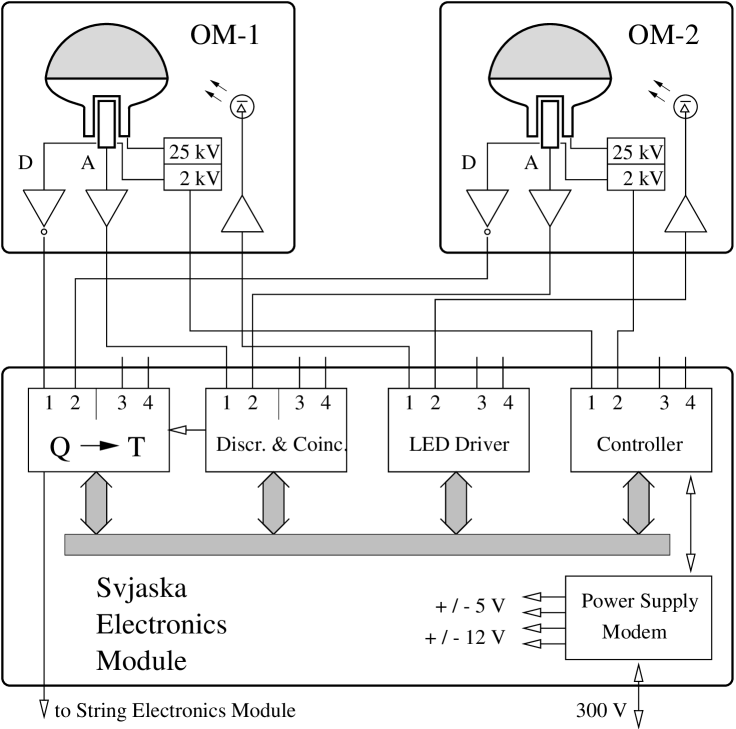
The electronics, the trigger formation and the data aquisition system of the NT-200 Telescope have been sketched in [1]. Here, we describe in more detail the front-end electronics which is closely connected to the operational principle of an OM pair. It is housed in the OMs itself as well as in the Svjaska Electronics Modules (see Fig. 1). Fig. 14 shows a block diagram of the components.
a) Optical Module
The OM houses two DC-DC HV supplies, one with a fixed output voltage (presently 25 kV) for the QUASAR optical preamplifier, the other for the small PMT UGON, with a voltage remotely controllable in steps of 10 V from 1.00 to 2.27 kV. Both supplies can be remotely switched off/on. The anode signal is fed to an amplifier (10x), the signal from the 11th dynode to an inverting amplifier (3x). The amplifiers are mounted to a printed board. The voltage divider for the UGON is integrated to the photomultiplier itself. For amplitude calibrations, a LED is mounted close to the QUASAR photocathode. Its light level can be changed from 1 to 1000 photoelectrons.
b) Svjaska Electronics Module
The anode signals from the two QUASARs are processed by the local trigger board. It consists of two 2-level discriminators and as described in section 3, one for each OM, and a coincidence circuit. The threshold of is set to 0.25 , with being the mean pulse height of a UGON 1-p.e. signal. The threshold of is remotely adjustable in the range 0.1 – 10 , with corresponding to 1 photoelectron emitted from the QUASAR-370 photocathode. The output signal from has to be confirmed by a signal from (coincidence in Fig. 9). The output pulses from have 15 nsec length and are switched in coincidence in a way, that the leading edge of the output signal (”local trigger”) is determined by the first of the two input signals. In this way, late pulses are suppressed.
The dynode signals of a pair of OMs are led to the Q-T module and summed by an analog summator. Each summator input can be inhibited remotely (i.e. each OM can be excluded individually from the sum). The sum signal is processed by a charge-to-time converter based on the - circuit 1101PD1 (russian analogue to MQT-200 from LeCroy). A local trigger would strobe the 1101PD1, and the input charge is converted, with a maximum conversion time of 70 sec. The width of the resulting signal corresponds to the charge of the dynode signal, the leading edge is set by the leading edge of the local trigger and defines the timing. The signal is sent to a string electronics module one level higher in the hierarchy and fed into TDCs which digitize the time (11 bit) and the time-converted amplitude information (10 bit) [1].
The Q-T module can be operated in two modes. The first uses a time conversion factor just as high that a 1-p.e. signal corresponds to 1 channel of the amplitude digitizing TDC. In the second (”calibration”) mode, the conversion time is stretched and one photoelectron corresponds to 20 TDC bins.
5.2 Single OM versus OM Pair
In the course of the development the projects DUMAND and BAIKAL, there have been long discussions about the advantages and drawbacks of operating the PMTs as single detectors or as pairs. We have been favouring the pair principle due to the following reasons:
Firstly, the average counting rate per PMT is in situ (0.5-1) Hz and, due to bioluminescence, seasonally reaches (2-3) Hz. The coincidence reduces the rate to 100-300 Hz per pair typically. This low counting rate is of significant advantage for the following goals:
-
a)
data transmission and trigger formation
The hard local coincidence allows to transmit all local signals to the underwater array trigger module just above the detector, to form an overall trigger, to read out all signals and to transmit digitized times and amplitudes via wire cables to shore. Due to the low rate, a simple underwater hardware trigger (like e.g. ” 3 local triggers in the whole array within 500 nsec”) already gives a sample nearly free of accidental coincidences.
-
b)
track reconstruction
In experiments operating the PMTs in single mode, background hits due to PMT noise, bioluminescence or K40 are mixed into practically every event [15]. These hits have to be eliminated by various criteria and repeated fitting procedures rejecting those PMTs with the highest time residuals. For the NT-200 detector, the average number of hits not due to the muon track is only 0.03/event, compared to about 10/event for an Ocean experiment operating 200 PMTs in single mode [15]. No coincidence between distant PMTs reaches the noise hit rejection capabilities of the local coincidence, due to the small coincidence window of the latter.
-
c)
Search for slowly moving bright objects like magnetic GUT monopoles
The detection principle is the registration of an excess in counting rates over time windows of the order of 102 sec. The rate excesses are buried in the noise signals if the PMT is operated in single mode. Furthermore, non-poissonian fluctuations of a single PMT might fake a monopole event. Noise rates as well as non-poissonian effects are effectively suppressed by the coincidence (see Fig. 15).
Secondly, ”late pulses” are strongly suppressed. These are pulses delayed by 10-100 nsec due to (undetected) elastical backscattering of the photoelectrons and multiplication after their second incidence on the dynode system. Since it is rather unlikely that both PMTs give a late pulse and since the response time is derived from the first PMT yielding a signal, only for a very small fraction of events the response time is that of a late pulse.
The time resolution is on the one hand worsened since the azimuthal position of the PMT is unknown ( 30 cm, i.e. 1.5 nsec light travel time in water), on the other hand, taking the time flag from the first hit PMT of a pair (convolution of eq. (4)) sharpens the time resolution. The two effects almost balance each other.
At least for the NT-200 project (given the high external noise due to bioluminescence and the robust ”low-tech” philosophy of the electronics and data transmission), these advantages prevail the drawbacks which are:
-
a)
A higher number of PMTs in order to instrument the same volume,
-
b)
a slightly higher threshold ( 0.3 p.e. in each of the two PMTs compared to 0.3 p.e. in one PMT),
-
c)
some mutual shadowing of the two OMs of a pair.
-
d)
possible signals in one PMT induced by the other PMT.

6 Calibration
6.1 In-situ tests
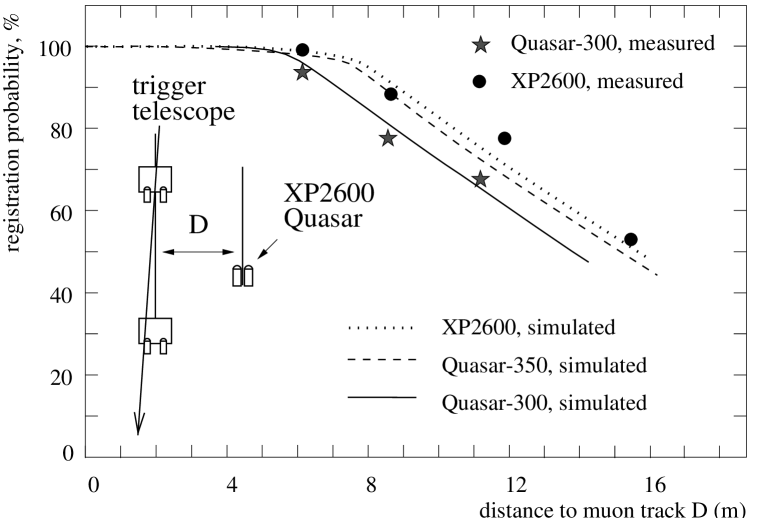
In 1988/89, in-situ calibrations of cylindrical modules containing a QUASAR-300 (the early 30-cm variant of the QUASAR) and a Philips XP-2600 have been performed in Lake Baikal. We used a trigger telescope consisting of two tanks clamped to a string at a vertical distance of 6.5 m. The water volume in the tanks was optically shielded from the surrounding water, therefore the two flat-cathode PMTs watching the tank interior were triggered only by Cherenkov light from muons crossing the tank.
A second string carried a pair of cylindrical OMs with the test tubes. The horizontal distance of this string with respect to the string with the trigger telescope was varied between 5 and 15 meters. Fig. 16 sketches the experimental arrangement and gives the registration probability by the test tubes as a function of the distance between muon and tubes. The curves are the results of MC calculations based on the independently measured values for water transparency, lensing effect and transparency of the plexiglas cap used at that time, and the photocathode sensitivity.
6.2 Plane wave response
A distant muon track illuminates an OM with a nearly plane wave of photons. Given an incident flux of photons, [photons/m2], the average number of photoelectrons is given by
| (4) |
Here, is the zenith angle with respect to the symmetry axis of the OM, the angular response normalized to unity at = 0, and the absolute sensitivity at = 0. and include the relevant information needed for MC calculations.
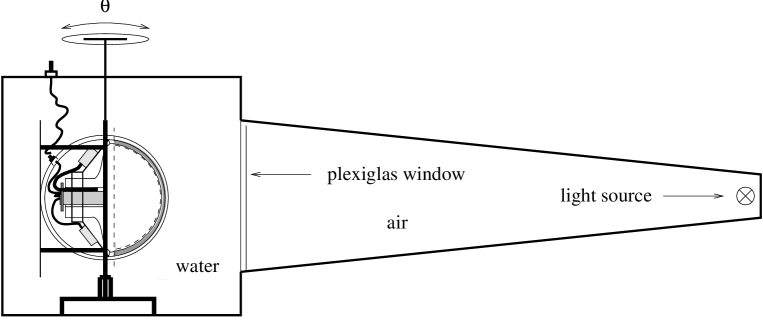
We have measured the response of OMs to a plane wave from a pulsed LED and have determined by rotating the OM in the light beam. The experimental setup to measure the angular dependence of the amplitude is shown in Fig. 17. The OM is mounted in a black box filled with water. It can be rotated an axis perpendicular to the ligth front. The OM is illuminated with a green LED through a plexiglass window. The LED is at a distance of 2.5 meters, the maximum deviation from planarity at the edge of the module is 4.3o for the box filled with water. The measured non-uniformity of the light profile is less than 3 over the module cross section.
The results are shown in Fig. 18. Data points are normalized to the signal at cos = 0. The deviation of the curves from linearity is marginally. Neglecting the region at cos 0.9, a linear fit
| (5) |
yields for the Baikal OMs , , similar to the DUMAND Japanese OMs [12], the DUMAND European OMs measured with the same setup [13], and the AMANDA OMs. Also shown in Fig. 18 is the result of an analytical simulation including all effects of absorption, refraction and reflection [16].

6.3 Amplitude and time calibration for the full telescope
The data taking of the telescope is interrupted about twice every week for calibration runs in order to determine the scale parameters of the amplitude and the time information.
a) Amplitude
The amplitude scale is calibrated by multi-photoelectron signals from the LED. The average number of photoelectrons of a charge distribution is derived from
| (6) |
with and being mean value and dispersion of the distribution, respectively, and the relative dispersion of a single-photoelectron signal. gives the scale factor. The high voltage for the UGON is changed until one photoelectron corresponds to one amplitude channel.
The second (stretched) - mode allows to plot the 1-p.e. spectrum. This allows an independent determination of the 1 p.e. scale factor and measures also the threshold value.
b) Time
The response time of an OM-pair with respect to an arbitrarily choosen time is determined by two calibration parameters,
| (7) |
with being the scale factor for the time digitization, (in nsec) being the relative shifts of channel with respect to mean value of all channels, and the measured TDC-channel number for channel .
In the calibration runs, the TDCs are started by noise pulses of the PMTs and stopped by generator pulses with a period . From a distribution like the one shown in Fig. 19, start and end point of the plateau, and , are determined with an accuracy of 1 - 2 channels (1-2 nsec for a 10 bit TDC and sec). The are given by , the flatness of the plateau determines the differential linearity of the TDC, which is better than 1 nsec in our case.

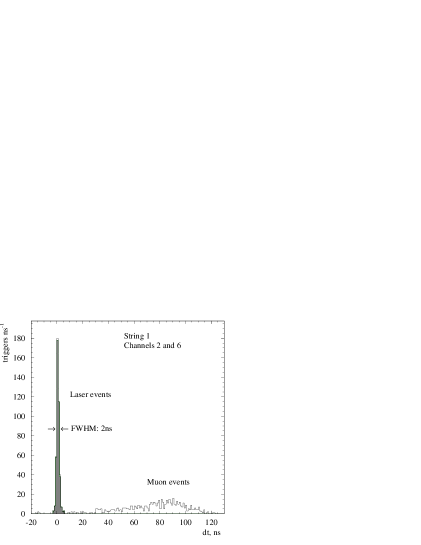
The time shifts are determined with a help of a calibration laser. This nitrogen laser, and a dye laser shifting the original wavelength of 337 nm to a spectrum peaking at 475 nm, are housed in a glas cylinder just above the telescope. The light pulses of less than 1 nsec width are guided via optical fibers of equal length to the OMs, with one fiber illuminating one OM pair. A laser pulse generated a ”laser” event with typically most of the channels firing. The time shifts are given by [17]:
| (8) |
with the first sum running over the total number of channels, , and the second sum over all events with both channels and being fired. , are the scale factors for channels and , and and are the time codes of channel and within event .
Fig. 20 shows the time difference distribution after the correction procedure for the second and the sixth channel of the first string of the NT-36 array. The FWHM of the laser peak is 2 nsec and the peak position is determined with an accuray better than one nsec. The right peak is due to downward going muons which had also triggered the two channels separated by 25 m ( nsec 0.3 m/nsec).
We observed a drift in the values over several months, presumably due to changes in the speed of light in the fiber under long-time pressure or water diffusion. These small effects can be corrected a posteriori by reconstructing muon tracks and requesting an average time residual like that observed in MC calculations. The overall accuracy of the time calibration is about 2 nsec.
7 Long Term Operation Underwater
7.1 Reliability
The first year of NT-36 has demonstrated the stability and reliability of all mechanical elements of the OMs. None of the OMs did leak, none of the polyurethane sealing layers and none of the QUASAR tubes have been damaged. Until 1996, nearly thousand penetrator/valve holes have been drilled in more than 130 spheres (OMs and electrical modules) which afterwards have been operated over one to four years at 1.1 km depth. None of the feedthroughs did leak. Only 2 spheres – in 1995 – leaked slightly due to cracks which had developed after a year underwater. This effect was clearly due to a manufacturing error eliminated in the mean time.
An unexpected problem was discovered with the power lines submitting300 V to the electronics modules. In 4 out of 30 connectors a parasitic current between the central wire and earth appeared, leading to strong electrolytic currents across the water to the string and particularly to the failure of the 1993 acoustic coordinate monitoring system driven via one of these connectors. The reason for this effect seems to be that, under the pressure of water, the plastificator from the PVC jacket is squeezed into the connector. This does not influence the functionality of the HF lines, but obviously leads to the formation conducting channels in the 300 V connectors. In the mean time, the jackets of the cables have been improved an the effect has disappeared.
Another problem was the initially unacceptably high failure rate of some electronic components. The percentage of working channels, averaged over the full year, was only 70 % in 1993/94 (NT-36). (An array with a linearly decreasing number of living OMs, starting with 100 % and ending after a year with 50 % living OMs, would have = 75 %.) Losses where dominantly due to failures or misoperation of the HV supplies, secondly to failures of the controllers. With still only 75 % in 1994/95, the year 1995 was used for a total re-design of the 25 kV supply. This, and changes at the 2 kV supply as well as at the controllers led to = 85 % for the 1996 array NT-96. The goal for the next years will be to increase up to 90 - 95 %. For the OMs alone this number is already nearly reached, and next improvements have to concentrate to other components of the detector.
In summary, the reliability optical module is suitable for long-term underwater operation in a 200 OM array, taking into account that yearly repair of failed components is possible. For arrays larger by an order of magnitude, further significant improvements are desirable.
7.2 Sedimentation
A phenomenon strongly influencing the sensitivity and, consequently, the counting rates of upward facing modules, is sedimentation of biomatter and dust on the upper hemispheres of the modules.
Fig. 21 shows the trigger rates for two different conditions over a period of 225 days, starting with April 13th, 1993. Firstly, for the case that at least 4 upward facing channels have been hit (upper graph), secondly, for the condition that at least 4 downward facing channels have been hit (lower graph). Only channels operating all 225 days have been included. In the second case, one observes a slight decrease of the rates down to 85-90% of its original value. In contrast, the rate for the upward trigger falls down by nearly an order of magnitude.

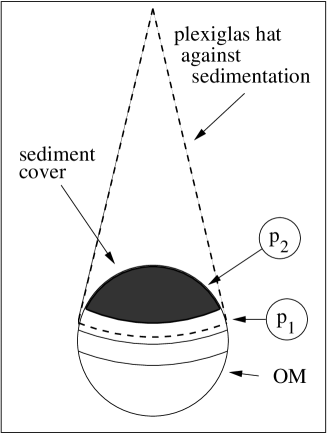
The inspection of the spheres after one year of operation showed that sediments had formed a ”hat” of bad transmission on the upward facing hemispheres (see Fig. 22). The region near the equator was almost free of sediments. This suggests to describe the variation of the sensitivity of an optical module by the following formula:
| (9) |
where is the time after deployment in days. stands for the part of the sensitivity contributed by the equatorial region, the second term describes the top region with exponentially decreasing light transmission.
Replacing the sensitivity used in the Monte-Carlo calculations by as defined above, and fitting the resulting trigger rates to those experimentally measured in 1993 (1994), one gets (0.36) and (102.0) days (numbers in brackets are for the 1994 array NT-36′). Consequently, the sensitivity of an upward facing module to atmospheric muons decreases to 35 after a year. Both parameters change only slightly from year to year. Note that the sensitivity of an upward facing OM to upward going muons from neutrino interactions is influenced less, since in average for these tracks the equatorial part of the module is illuminated stronger than the top region. Presently, we are looking for methods to reduce sedimentation effects. E.g., the accumulation of sediments can be reduced by a smoother OM surface or by dressing the OM with a plexiglas cone (see Fig. 22).
The straight-forward solution is of course to direct all OMs downward. This increases the sensitivity to upward muons from neutrino interactions by20 - 30 %, slightly reduces the identification capabilities with respect to fake event (downward muons faking upward muons), and limits the precision of downward muon physics. In the presently operating array NT-200, 160 of the 192 OMs face downward.
7.3 Track Reconstruction
During 4 years of data taking with the stepwise increasing stages of the Baikal Neutrino Telescope we have accumulated technical and methodical experience as well as first relevant results. Physics results from NT-36 are reported in [1], and from NT-96 in [18, 19].


The initial test an underwater telescope has to undergo is the correct reconstruction of atmospheric muons. They enter the array from above and are recorded with a frequency of several Hz. Fig. 24 shows a typical single muon event firing 7 of the 18 channels of NT-36 and reconstructed with a . Monte Carlo calculations using as input the timing and amplitude properties of the QUASAR measured in laboratory do well reproduce the experimental data like amplitudes, time differences and angular distribution [1].
The crucial demonstration of the functionality of a neutrino telescope is the identification of the rare neutrino events among the huge amount of atmospheric muons. Their signature is given by a muon entering the array from below. Still too small to detect the feable fluxes from extraterrestrial neutrino sources, NT-200 will be used to investigate those neutrinos which have been generated in the atmosphere in interactions of charged cosmic rays (”atmospheric neutrinos”) and to search for neutrinos due to dark matter annihilation in the center of the Earth [19]. In NT-200, about one neutrino per day will be recorded. With NT-36 and NT-96, 14 neutrino events have been identified, in accordance with Monte Carlo estimates. Fig. 25 shows one ”gold plated” event with 19 hits.
8 Summary and Outlook
We have constructed a deep underwater Optical Module (OM) which is the key component of the neutrino telescope in Lake Baikal. Most parts of the OM, like the phototube QUASAR-370, the pressure sphere protecting the QUASAR, electronics as well as connectors and feedthroughs have been developed by our collaboration, in close cooperation with industry.
Since 1993, we have been permanently operating configurations with a growing number of OMs. A number of scientifically relevant results have been obtained, ranging from counting rate variations which reflect water transport processes to a precise measurement of the angular spectrum of atmospheric muons. Most notably, first neutrino events have been unambiguously identified. During all years of data taking, none of the pressure housing did leak, and the reliability of the OMs has been improved continuously.
The 144-OM array operated in 1997 was upgraded to 192 OMs in April 1998. With this upgrade (NT-200), the short term goal of the collaboration is completed.
The technical solutions used until now turned out to be adequat for a first generation neutrino telescope like NT-200. In the next step, we envisage a telescope consisting of 1000 - 2000 OMs. For this telescope, the OM design will change in various respects. Firstly, an array much larger than NT-200 calls for higher reliability. Some basic peculiarities of the Baikal telescope may change. The present electronics was conceptually developed in 1988 - 1990. Clearly, a new design of the electroncis is necessary, using higher integrated circuitry, eventually omitting the ”svjaska electronics modules” and moving the corresponding functions to the OM or to the string electronics modules, making use of more advanced signal transmission techniques etc. Almost for sure, a future OM will have less feed-throughs in order to further minimize the danger of leaks. This, in turn, request changes in the electronics. For instance, one might be forced to omit the separate dynode read-out for amplitude mesurement and pay for that with a somewhat smaller dynamic range.
As an example for future develoments of the OM we focus here on its main component, the QUASAR-tube.
Amplitude and timing characteristics of the QUASAR-370 depend strongly on the ratio (eq. 3). We are investigating some new scintillator materials like ScBO3:Ce (SBO), YAlO3:Ce (YAO) and YClO5:Ce (YCO), with 2 - 3 times larger light yield than Y2SiO5:Ce (YSO) and 28 - 30 ns decay time. We have manufactured each 5 pilot tubes with SBO and YAO. The average gain values of the corresponding preamplifier tubes turned out to be twice as high as for fo YSO, = 50 - 60. The single photoelectron resolution is less than 50 % and the time resolution about 1 nsec.
Technological improvements like the chemical protection of single scintillator grains are expected to give a larger gain in tubes with ordinary Y2SiO5:Ce. Other lines of improvement are directed to increase significantly the photocathode sensitivity and to decrease the dark current rate. For the present version, the average dark current rate is about 35 kHz at room temperature and half of that at 0oC.
Another line of principial re-design and improvement is the replacement of the scintillator screen and the small PMT by an diode array or by a foil first dynode followed by a mesh dynode chain. All these improvement make the QUASAR increasingly interesting to other fields apart from underwater telescopes, in particular for Air-Cherenkov Telescopes.
As mentioned in section 5.2, we prefered a pairwise operation of OMs by different reasons, most notably effective suppression of noise counts and elimination of prepulses, late pulse and afterpulses. However, for much larger projects the high cost of this approach may be not acceptable. In order to maintain the local coincidence and, at the same time, to reduce the number of OMs, we have developed a two-channel version of the QUASAR. We made use of the fact, that photoelectrons of the central part of the QUASAR are focussed onto the central spot of the luminescent screen, whereas photoelectrons from peripherical regions are collected onto the circular edge area of the screen. We have developed 2 pilot samples of a two-channel, small (3cm diameter) version of the UGON with a mesh dynode system, one channel collecting photoelectrons from the central region, the other from the periphery. The cross-talks measured are about 2 %. Switching the two channels in coincidence results in a noise rate as low as 100 Hz.
9 Acknowledgments
We are indebted to G.N. Dudkin, V.Yu. Egorov, O.I. Gress, A.I. Klimov,G.L. Kharamanian, A.A. Lukanin, P. Mohrmann, A.I. Panfilov, V.A. Poleshuk, V.A. Primin, I.A. Sokalski, Ch. Wiebusch and M.S. Zakharov for help at various stages of development and tests of the optical module.
References
- [1] I.A. Belolaptikov et al., Astroparticle Physics 7 (1997) 263.
- [2] I. Sokalski and Ch. Spiering (ed.) The Baikal Neutrino Telescope NT-200 – Project Description. BAIKAL 92-03.
- [3] see, for a review of physics missions: V.S. Berezinsky, Nucl. Phys. (Proc. Suppl.) B31 (1993); T.K. Gaisser, F. Halzen and T. Stanev, Phys. Rep. 258 (1995) 173.
- [4] first results from NT-36 have been published in I.A. Belolaptikov et al., Nucl. Phys. (Proc.Suppl.) 35 (1994), pages 290 and 301.
- [5] G. van Aller, S.O. Flyckt, W. Kuhl, IEEE Trans. on Nucl. Sci. NS-30 (1983) 469.
- [6] G. van Aller et al., Helvetica Physica Acta 59 (1986) 1119.
- [7] R.I. Bagduev et al., Proc. Int. Conf. ”Trends in Astroparticle Physics”, Teubner Stuttgart/Leipzig (1994) 132.
- [8] L.B. Bezrukov et al., Proc. 3rd NESTOR Workshop, Pylos 1993, Univ. Athens 1994, 645.
- [9] L.B. Bezrukov et al., Proc. 2nd Intern. Symp. ”Underground Physics 87”, Baksan Valley (Moscow: Nauka 1988) 230.
- [10] B. Lubsandorzhiev, PhD-Thesis, Moscow 1993 (in russian).
- [11] A.A. Doroshenko et al., J. Strength of Materials, (1993) 61 (in russian).
- [12] S.Matsuno et al., Nucl. Instr. and Methods A276 (1989) 359.
- [13] P.C. Bosetti, Proc. 23rd ICRC (Calgary) vol 4, 534, and U. Berson, Ch. Wiebusch, Dumand Internal Report DIR 5-93, Aachen 1993.
- [14] A. Biron et al., Upgrade of Amanda-B towards Amanda-II, DESY PRC 97/05, and http://sgi.ifh.de/csspier/proposal.html
- [15] V. Stenger, Proc. 2nd NESTOR Int. Workshop (ed. L. Resvanis), Athens 1992, 79.
- [16] P. Mohrmann, Diploma Thesis, Berlin 1995 (in german).
- [17] Th. Mikolajski, PhD Thesis, Berlin 1995 (in german).
- [18] S. Barwick et al., Proc. 25th ICRC (Durban 1997) vol 7, 1.
- [19] Ch. Spiering et al., Proc. Int. School of Nuclear Physics, Erice, Sept. 1997, astro-ph/9801044.