DESY 99-17
Registration of Atmospheric Neutrinos
with the BAIKAL Neutrino Telescope NT-96
V.A.Balkanov1, I.A.Belolaptikov7, L.B.Bezrukov1, N.M.Budnev2,
A.G.Chensky2,
I.A.Danilchenko1, Zh.-A.M.Djilkibaev1,
G.V.Domogatsky1, A.A.Doroshenko1,
S.V.Fialkovsky4, O.N.Gaponenko1,
A.A.Garus1, T.I.Gress2, A.M.Klabukov1, A.I.Klimov6,
S.I.Klimushin1, A.P.Koshechkin1, V.F.Kulepov4, L.A.Kuzmichev3,
V.E.Kuznetzov1,
S.V.Lovtzov2, B.K.Lubsandorzhiev1, M.B.Milenin4,
R.R.Mirgazov2, N.I.Moseiko3,
V.A.Netikov1, E.A.Osipova3,
A.I.Panfilov1, Yu.V.Parfenov2, A.A.Pavlov2, E.N.Pliskovsky1,
P.G.Pokhil1, E.G.Popova3, M.I.Rozanov5, V.Yu.Rubtzov2,
I.A.Sokalski1, Ch.Spiering8,
O.Streicher8, B.A.Tarashansky2,
T.Thon8, R.V.Vasiljev1, R.Wischnewski8, I.V.Yashin3
1 Institute for Nuclear Research, Russian Acad. of Sciences
(Moscow, Russia),
2 Irkutsk State University (Irkutsk, Russia),
3 Moscow State University (Moscow, Russia),
4 Nizhni Novgorod State Technical University (Nizhni Novgorod,
Russia),
5 St.Petersburg State Marine Technical University (St.Petersburg,
Russia),
6 Kurchatov Institute (Moscow, Russia),
7 Joint Institute for Nuclear Research (Dubna, Russia),
8 DESY Zeuthen (Zeuthen, Germany)
Abstract: We present first neutrino induced events observed with a deep underwater neutrino telescope. Data from 70 days effective life time of the BAIKAL prototype telescope NT-96 have been analyzed with two different methods. With the standard track reconstruction method, 9 clear upward muon candidates have been identified, in good agreement with 8.7 events expected from Monte Carlo calculations for atmospheric neutrinos. The second analysis is tailored to muons coming from close to the opposite zenith. It yields 4 events, compared to 3.5 from Monte Carlo expectations. From this we derive a 90% upper flux limit of cm-2 sec-1 for muons in excess of those expected from atmospheric neutrinos with zenith angle 150 degrees and energy 10 GeV.
submitted to Astroparticle Physics
1 Introduction
The ultimate goal of large underwater neutrino telescopes is the identification of extraterrestrial neutrinos of high energies. The omnipresent background with respect to these neutrinos are neutrinos generated by cosmic ray interactions in the atmosphere of the Earth. While being a background with respect to extraterrestrial neutrinos, atmospheric neutrinos can be used as a standard signal to test and calibrate underwater neutrino detectors. Therefore, a primary challenge for these detectors is the identification of upward muons generated in interactions of atmospheric neutrinos. Taking into account that the flux of downward muons at 1 km depth is about 6 orders of magnitude larger than the flux of upward muons from atmospheric neutrinos, this task is far from being trivial [1].
Apart from being a test tool for underwater telescopes, atmospheric neutrinos may indicate physics beyond the standard model of particle physics. Actually, from recent analyses of data from underground experiments, evidence is found for oscillations of neutrinos [2, 3, 5, 4]. The search for such feeble effects, however, requests a detailed understanding of the detectors, high statistics and a relatively low energy threshold.
The first part of this paper describes the method for full spatial reconstruction of muon tracks with the four-string array NT-96 in Lake Baikal, and the criteria to reject fake events from misreconstructed downward muons. We present results from the analysis of 70 days effective lifetime of NT-96, taken in 1996.
In contrast to the standard reconstruction strategy, which supposes 6 hits at 3 of the vertical strings, the second analysis is performed also for events with hits on less than 3 strings. This considerably increases the effective area in vertical direction. Instead of beginning with a reconstruction and then applying quality cuts, we start with cuts effectively rejecting all events with the exception of nearly vertically upward moving muons. Only for events surviving these cuts, a fit of the zenith angle is performed. An excess of such muons over the expectation value for muons from atmospheric neutrinos could indicate neutrino production by the annihilation of neutralinos – the favored super-symmetric candidate for cold dark matter – in the center of the Earth. By a method of that kind, two first neutrino events have been identified in NT-36, the very first small BAIKAL prototype array [6]. In the second part of this paper, we apply this strategy to NT-96 data and derive an upper limit on the excess muons from the center of the Earth.
2 The detector
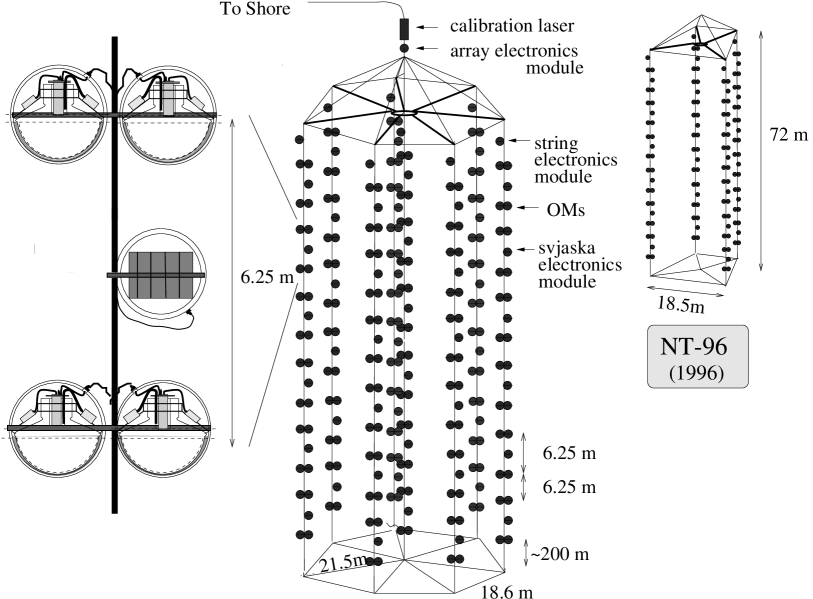
The Baikal Neutrino Telescope [1, 8] is operated in the Siberian Lake Baikal, at a depth of 1.1 km. In April 1998, the NT-200 array consisting of 192 optical modules (OMs) at 8 strings was deployed (see fig.1). The OMs are grouped in pairs along the strings. They contain 37-cm QUASAR phototubes [9]. The two tubes of a pair are switched in coincidence in order to suppress background from bioluminescence and dark noise. A pair defines a channel.
A muon trigger is formed by the requirement of hit channels within 500 nsec. is typically set to the value of 3 or 4. For such events, amplitude and time of all fired channels are digitized and sent to shore. The event record includes all hits within a time window of -1.0 sec to +0.8 sec with respect to the muon trigger signal.
In April 1993, the first small prototype array, the detector NT-36 with 36 OMs at 3 short strings, was launched and took data up to March 1995. Results obtained with the 1993 version of NT-36 as well as a detailed description of detector, site and deployment procedure have been published in [1]. A 72-OM array, NT-72, run in 1995-96. In 1996, it was replaced by the four-string array NT-96, which was replaced a year later by a 144-OM detector. Since April 6, 1998, NT-200 with 192 OMs is taking data.
NT-96 (48 channels) is shown at top right of fig.1. The OMs are fixed at four strings each 72 m long. The strings are arranged at the edges of a trapezoid with side lengths of 3 18.5 m, and 1 10.2 m. Each string consists of 12 pairs of OMs. All OMs face downward, with the exception of the OMs of the second and eleventh layers, which look upward. The distance between downward oriented layers is 6.25 m, the distance between layers facing to each other (layers 1/2 and 10/11) is 7.5 m, the distance between back-to-back layers (2/3 and 11/12) is 5.0 m.
Results presented below are from 70.3 days data taking with NT-96, starting at April 13, 1996. During the first month, 47 out of all 48 channels have been operating. In the following, nine channels failed, so that NT-96 consisted of only 38 operating channels at the end of this period.
3 Identification of Upward Muons by Full Reconstruction
3.1 The Reconstruction Procedure
The reconstruction algorithm is based on the assumption that the light radiated by the muons is emitted exactly under the Cherenkov angle (42 degrees) with respect to the muon path. The model of single minimum ionizing muon is a simplification, since the direction of shower particles accompanying the muons is smeared around the muon direction. Atmospheric muons may occur in bundles. Also, light may be scattered on its way. In Lake Baikal, however, the latter effect is negligible since the effective scattering length is much larger than the absorption length [1]. The reconstruction procedure consists of the following steps:
-
1.
A first quality analysis of the event which a) excludes events far from being described by the model of a minimum ionizing muon, and b) finds a first guess for the minimization.
-
2.
Determination of the muon trajectory based on the minimization of the function
Here, are the measured times and the times expected for a given set of track parameters. is the number of hit channels, are the timing errors. All are set to 5 nsec in the following procedures. A set of parameters defining a straight track is given by and – zenith and azimuth angle of the track, respectively, and – the two coordinates of the track point closest to the center of the detector, and – the time the muon passes this point. For a fit allowing a three-dimensional reconstruction, 6 hits on 3 strings are necessary (trigger 6/3).
-
3.
Rejection of most of the bad reconstructed events with the help of final quality criteria.
In the initial quality analysis (step 1), an event has to pass the following criteria:
-
a)
The time difference for two channels and must obey the following condition:
(1) with being the Cherenkov angle (42o) and the distance between channels. 5 nsec accounts for the timing error.
-
b)
For any two channels and on the same string, a region of zenith angles is determined which is allowed by the observed time differences :
(2) Here are the coordinates of the channels. If the regions of possible zenith angles for all pairs along a string do not overlap, the event is excluded.
-
c)
Assuming the event is caused by a naked muon, for every channel one can define a range of distances to the muon which is consistent with the measured amplitude of the channel. From this, for every channel pair the minimal () and maximal () allowed time difference are defined, in dependence on the distance between the channels and the amplitudes. If for any pair the condition is violated, the event is rejected.
Seventy percent of the events selected for reconstruction (trigger 6/3) pass these criteria in both the experimental and the MC sample. In the case of MC generated neutrino induced muons, the rate is larger (80%) due to the absence of muon bundles.
After the minimization (step 2) we apply final quality cuts (step 3). Apart from the traditional cut on , cuts on the following parameters are applied:
-
•
the probability of non-fired channels not to be hit, , and fired channels to be hit, .
(3) where is the hit probability for the th of all fired channels, and the nohit probability for the th of all non-fired channels.
-
•
the correlation function of measured amplitudes to the amplitudes expected:
(4) with being the amplitude expected for channel on the base on the fitted track hypothesis and a minimum ionizing muon, the measured amplitude and and the corresponding dispersions.
-
•
an amplitude defined similar to the time defined above.
Figs.2 and 3 show as an example the distributions of and the amplitude correlation – for downward muon Monte Carlo events compared to the total reconstructed experimental sample, and for fake events compared to true upward muons (both MC). Atmospheric muons have been generated according to [10] (see for details [1] where also the Baikal detector simulation is described), for atmospheric neutrinos the Volkova spectrum [17] has been used.
To guarantee a minimum lever arm for track fitting, we reject events with a projection of the most distant channels to the track () smaller than a certain length. Due to the small transversal dimensions of NT-96, this cut excludes zenith angles close to the horizon, i.e., the effective area of the detector with respect to atmospheric neutrinos is decreased considerably.
We have chosen the following cuts to separate well reconstructed tracks:
-
1:
3.0
-
2:
0.15
-
3:
2.0
-
4:
amplitude correlation 0.1
-
5:
35 m
Fig.4 shows the effective area for reconstructed upward muons with 9 hits on 3 strings, and for those passing additionally cut 1-4 and 1-5, respectively, as function of the zenith angle.


3.2 Results Obtained with the Standard Analysis
The efficiency of all criteria was tested using MC generated atmospheric muons and upward muons due to atmospheric neutrinos. events from atmospheric muon events (trigger 6/3) have been simulated, with none of them passing all cuts and being reconstructed as upward going muon. Table 1 shows the number of events surviving various trigger/cut levels (column 1) – column 2 for the experimental data, column 3 for the Monte Carlo sample of downward muons, column 4 for the same sample normalized to 70.3 days, and column 5 for upward muons from atmospheric neutrinos, again normalized to 70.3 days.
Rejection of all events with less than 9 hits results in a small decrease of the neutrino sensitivity (see table 2), but reduces the background by a factor of 4. This corresponds to the lowest curve in fig.4.
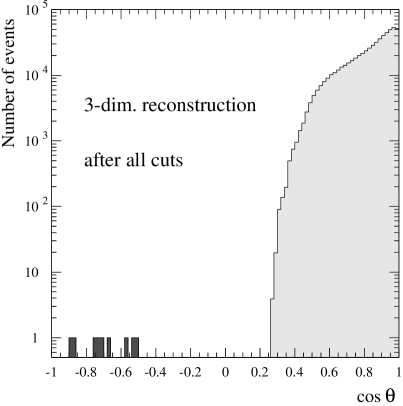
We have reconstructed events taken with NT-96 from April to August 1996 (70.3 days). Nine events were reconstructed as upward going muons, passed all quality cuts and triggered at least 9 channels at 3 strings. This compares to 8.7 events expected from atmospheric neutrinos. Fig.5 displays one of the neutrino candidates. Top right the times of the hit channels are shown as as function of the vertical position of the channel. At each string we observe the time dependence, characteristically for upward moving particles.
Table 1: Number of events surviving various trigger/cut levels
| Trigger/cut | Experiment | MC atm | MC atm | MC atm |
|---|---|---|---|---|
| 70 days | 70 days | |||
| 6/3 | 51.6 | |||
| (1)+upward rec’d | 49.7 | |||
| (2)+quality cuts 1-4 | 5088 | 454 | 6361 | 17.3 |
| (3)+quality cut 5 | 30 | 0 | - | 9.9 |
| (4)+9/3 | 9 | 0 | - | 8.7 |
Table 2: The fraction of events after the quality cuts relative to the number of events surviving pre-criteria and reconstruction for the triggers 6/3 and 9/3
| Trigger cond. | Experiment | MC atm | MC from |
|---|---|---|---|
| 6/3 | 0.19 | 0.21 | 0.20 |
| 9/3 | 0.044 | 0.056 | 0.175 |
Applying eq.2 not only to pairs at the same string, but to all pairs of hit channels, one can construct an allowed region in both and . For neutrino events this region is requested to include regions below the horizon. This is demonstrated at the bottom right picture of fig.5. The same holds for the other eight events, one of which is shown in fig.6a). Fig.6b), in contrast, shows an ambiguous event not passing all quality cuts and giving, apart from the upward solution, also a downward solution. In this case we assign the event to the downward sample.
The resulting angular distribution is presented in fig.7a). Fig.7b) shows the measured angular distribution of the 9 neutrino candidates weighted with the acceptance and compares it to the spectrum of atmospheric neutrinos which was taken from [17]. Table 3 gives the number of hit channels and of hit strings, and the zenith angle for the nine neutrino candidates. The average number 12 of hit channels agrees within errors with the expected number of 11.2, the mean is 0.91, only one event has a value (2.45) close to the cut limit of 3.


Table 3: Parameters for the nine upward muon candidates
| 1. | 14 | 4 | 134.7o |
| 2. | 19 | 4 | 152.3o |
| 3. | 10 | 3 | 120.4o |
| 4. | 16 | 4 | 145.5o |
| 5. | 11 | 4 | 121.8o |
| 6. | 9 | 4 | 138.6o |
| 7. | 9 | 3 | 132.6o |
| 8. | 11 | 4 | 136.9o |
| 9. | 9 | 4 | 125.3o |

4 Identification of Nearly Vertically Upward Moving Muons
Different to the standard analysis, the method presented in this section relies on the application of a series of cuts which are tailored to the response of the telescope to nearly vertically upward moving muons. The cuts remove events far away from the opposite zenith including fake events. Fake events are mostly due misinterpreted atmospheric muons with true zenith angles close to the horizon, and to pair and bremsstrahlung showers below the array which may give rise to upward traveling light fronts. The method does not aim a full reconstruction of all spatial parameters. Therefore, also events with hits at only one or two strings are included in the analysis. The candidates identified by the cuts are afterwards fitted in order to determine the zenith angle.
4.1 Definition of the cuts
In order to optimize the cuts with respect to the signal-to-noise ratio, the following Monte Carlo samples have been generated and analyzed:
-
•
Atmospheric neutrinos below horizon ( triggered events corresponding to 53 years data taking).
-
•
Minimum ionizing atmospheric muons with zenith angles ( triggered events corresponding to 3.6 years data taking).
-
•
showers generated by downward muons close to the array. Showers have been generated in a m3 box which includes the detector center. The energies ranged from 10 GeV to 10 TeV and were normalized to atmospheric muons (energy and angular distribution, and production probability for bremsstrahlung, triggered events corresponding to 10 years data taking)
We included all events with 4 hits along at least one of the four strings.
4.1.1 Timing
The first criterion cuts on the times measured along each of those individual strings with more than 1 hit. It applies to all combinations of hit channels along the string:
cut 1: .
The are the arrival times at channels , and is their vertical distance. With = 5 nsec accounting for the timing error, the condition (i.e. =0) would cut for a signal traveling vertically upward with the speed of light, .
Setting to 1 nsec/m, the acceptance cone around the opposite zenith is slightly increased. Fig.8 shows the effective area for muons from atmospheric neutrinos as a function of after cut 1. All following cuts are applied to the sample of events passing cut 1.

4.1.2 Event Length
Events close to the vertical tend to be much more elongated than hit patterns due to showers close to the array, and also than fake downward muons, see fig.9. The following cut is the next powerful after cut 1 with respect to fake event rejection:
cut 2:
with and being the numbers of the highest and the lowest floor, respectively, which contain hit channels. Numbers are counted from top to bottom. This cut defines a rather sharp energy threshold at 10 GeV.

4.1.3 Maximum Amplitude
The distribution of the maximum amplitude in an event, , differs strongly between atmospheric muons (mean value 23 photoelectrons), naked-muon fake events and shower events.
cut 3: photoelectrons,
accepts 90 % of the signal and removes about 50 % of the shower events (for the parameter distributions underlying this and the following cut values, see [11].
4.1.4 Center of Gravity
Naturally, events due to showers which emit light traveling upward within the detector deposit most light in the lower part of the array. From the distribution of the center of gravity of hit channels for signal and for shower events (not shown), we derive a cut on the coordinate of the center of gravity:
cut 4: m,
with being the amplitude of the th channel and the number of all hit channels.
4.1.5 Causality Condition
The timing cut 1 refers to the time differences between hit channels along one string. However, one can also relate the hits at different strings to each other assuming the particle is moving nearly straight upward. For this reason, we define a parameter
Here, and are the coordinates of the lowest and the highest fired channel at a string with , respectively, and and are the corresponding times. is the coordinate of a hit channel at another string. In the case of a straight upward muon, the time measured for this channel should be close to .
From the distribution of the largest values of found for each event, we derive the following ”causality cut”:
cut 5: max nsec.
4.1.6 Minimum time difference between top and bottom channels
According to cut 2, (), the distance between top and bottom hit channels should be at least 50 m. This corresponds to a travel time of 166 nsec for a relativistic muon. However, the actual difference in arrival times may be slightly lower due to light scattering, shower particles accompanying the muon and experimental errors. We request that for all combinations of top and bottom hits from various strings
cut 6: 150 nsec
where denotes the string number.
4.2 Application to Experimental Data
Within 70 days of effective data taking, events with the muon trigger have been taken. 8608 of them have 4 hits at one string and pass cut 1. Table 4 summarizes the number of events from all 3 events samples (MC signal and background, and experiment) which survive the subsequent cuts. The experimental sample consists of events taken within 70.3 days effective live time with the hardware trigger . The Monte Carlo samples are normalized to the same time interval.
Table 4: The expected number of atmospheric neutrino events and background events, and the observed number of events after cuts 1–6.
| after cut No | 1 | 2 | 3 | 4 | 5 | 6 |
|---|---|---|---|---|---|---|
| atm. , MC | 11.2 | 5.5 | 4.9 | 4.1 | 4.8 | 3.5 |
| background, MC | 7106 | 56 | 41 | 16 | 1.1 | 0.2 |
| experiment | 8608 | 87 | 66 | 28 | 5 | 4 |
The disagreement between background Monte Carlo and experiment in the first columns is mostly due to the fact that the Monte-Carlo was simplified in order to save CPU time and does not include low energy showers ( 10 GeV) accompanying the muon. Whereas the number of MC background events continues to fall with additional cuts, experimental data and MC signal events apparently reach a kind of asymptotic value which is only slightly affected by the last cut. The parameters of the four experimentally selected events are given in table 5 together with the results of the zenith angle fit. We note that all parameters values fall in the most probable range for signal events which had passed the time cut. Moreover, they are not close to the cut limits, i.e., a reasonable variation of the cuts would not change the number of events passing the cuts. We conclude that we have separated 4 atmospheric neutrino candidates with expectation values of 3.5 for the signal itself and 0.2 for the background from fake events.
Table 5: Fit results for the four upward muon candidates surviving all cuts 1–6
| /NDF | |||||||||
| (p.e.) | (m) | (nsec) | (nsec) | (degree) | |||||
| 19 | 4 | 12 | 12.5 | 34.8 | 0 | 190 | 152 | 0.44 | |
| 9 | 2 | 12 | 21.0 | 23.5 | 38 | 270 | 161 | 0.05 | |
| 9 | 2 | 10 | 13.0 | 26.0 | 22 | 202 | 162 | 0.14 | |
| 7 | 2 | 10 | 4.0 | 32.0 | 23 | 188 | 170 | 0.39 |
The first of the four events is the gold plated 19-hit event which was also found in the full-reconstruction analysis. Fig.10 shows the second event with 9 hits at 2 strings. Fig.11 gives the angular distribution of the four events compared to the effective area after all cuts. With a nearly flat distribution for atmospheric neutrinos over the small range considered, the observed events should be distributed according to the effective area. In fact, the distribution of the four observed events is compatible with this assumption.


4.3 Limit on the Flux of Muons from the Center of the Earth
One class of candidate particles for cold dark matter has an interaction strength typically for the weak scale. Weakly Interacting Massive Particles (WIMPs) would have been produced during the big bang and are diffusing through the universe. They are expected to be scattered off coherently by nuclei, e.g. in the Sun or the Earth. Loosing energy they eventually fall below the escape velocity and are gravitationally trapped at the center of these bodies. Once accumulated, annihilation processes set on. The WIMP density builds up until equilibrium is reached. The leptonic decays due to annihilation into heavy quarks or W-pairs yield neutrinos of energies in the GeV-to-TeV range, depending on the WIMP mass. The most favoured candidate for WIMPs is the neutralino. In the Minimal Supersymmetric Standard Model (MSSM), neutralinos are linear combinations of the neutral gauginos , and of the neutral higgsinos . The lightest of these combinations would be the stable candidate for cold dark matter. The neutralino capture rate in celestial bodies, the annihilation cross sections, the fragmentation functions into fermions, gauge bosons and Higgs particles depend on the various parameters of the MSSM (see [12, 13] and references therein).
Underground detectors like Baksan, MACRO and Kamiokande set upper limits on the flux of muons from the center of the Earth of a few times cm-2 sec-1 [14, 16, 15]. These limits already exclude a certain region of the SMMS parameter space. Neutralino masses below 25 GeV are excluded by LEP.
Table 5 shows the number of events detected in NT-96 within four zenith angle regions about the opposite zenith, and compares it to expectations from atmospheric neutrinos. From the non-observation of a significant excess, the flux limits given in the third column are obtained. They are compared to the limits given by Baksan, MACRO and Kamiokande in the last 3 columns. In spite of the effective area of NT-96 for nearly vertically muons being about 1000 m2 (see fig.11), the limits obtained are 4-7 times wore than the best published values, since the only 70 days have been analyzed until now. However, the result illustrates the potential of underwater experiments with respect to the search for muons due to neutralino annihilation.
Table 5: The number of events detected (”Data”) and expected from atmospheric neutrinos (”Bg”) for NT-96, as well as the C.L. upper limits on the muon flux from the center of the Earth for four regions of zenith angles obtained NT-96, Baksan, MACRO and Kamiokande.
| Flux limit ( cm-2 sec | ||||||
| Zenith | Data | Bg | NT-96 | Baksan | MACRO | Kamiokande |
| angles | ||||||
| 4 | 3.7 | |||||
| 3 | 2.6 | |||||
| 2-3 | 2.3 | |||||
| 1 | 1.3 | |||||
5 Conclusions
Twelve neutrino candidates have been separated from 70 days effective lifetime of the four-string detector NT-96 in Lake Baikal. Nine of them have hits at 3 strings and are fully reconstructed (zenith and azimuth angle). The other three events have hits at 2 strings but still yield an unambiguous zenith reconstruction. The observed number as well as the angular distribution coincide with expectations from atmospheric neutrinos.
This is the first successful experimentum crucis for the operation of underwater neutrino telescopes. From the agreement with expectations, we derive an upper flux limit of cm-2 sec-1 for muons with zenith angle and 10 GeV in excess of those expected from atmospheric neutrinos. Such muons might have been produced in neutralino annihilations in the center of the Earth.
At present, the NT-200 telescope is taking data. It contains twice the number of optical modules as NT-96. From the fully operational NT-200 array, about one neutrino event per day is going to be separated. NT-200 will be primarily used to study atmospheric neutrinos and to search for upward muons from WIMP annihilation.
References
- [1] I.A.Belolaptikov et al., Astropart. Phys. 7 (1997) 263.
- [2] Y.Fukuda et al., Phys.Lett. B335 (1994) 237.
- [3] Y.Fukuda et al., Phys.Lett. B433 (1998) 9.
- [4] W.M.Allison et al., Phys.Lett.B391 (1997) 491.
- [5] M.Ambrosio et al., Phys.Lett.B357 (1998) 481.
- [6] V.A.Balkanov et al., Proc. 25-th ICRC, Durban, South Africa (1997) 7, 173.
- [7] L.B.Bezrukov et al., Proc. 2nd Workshop on the Dark Side of the Universe, World Sci. Publ., Singapore 1996, 221, and astro-ph/0901161.
- [8] I.A.Sokalski and Ch.Spiering (eds.), The Baikal Neutrino Telescope NT-200, BAIKAL 92-03 (1992).
- [9] R.I.Bagduev et al., DESY 98-091, Nucl.Instr.Meth.A420 (1999) 138.
- [10] S.N.Boziev et al., INR preprint P-0630, Moscow 1989.
- [11] V.A.Balkanov et al., Preprint INR 0972/98 (Moscow 1998) and Zh.Djilkibaev, Proc.Workshop on Simulation and Analysis Methods for Large Neutrino Telescopes,Zeuthen 1998.
- [12] A.Bottino et.al, Astropart.Phys. 3 (1995) 65.
- [13] L.Bergström, J.Edsjö and P.Gondolo, Phys.Rev. D55 (1997) 1765.
- [14] M.M.Boliev et al.,Nucl.Phys. 48 (Proc.Suppl.) 83.
- [15] M.Mori et al., Phys. Rev. D48 (1993) 5505.
- [16] T.Montaruli et al., Proc 25th ICRC, Durban, South Africa (1997) 7, 185.
- [17] L.V.Volkova, Sov.J.Nucl.Phys. 31 (1980) 784.