email: svaneck@astro.ulb.ac.be, ajorisse@astro.ulb.ac.be
The Henize sample of S stars
Abstract
This paper is the first one in a series investigating the properties of the S stars belonging to the Henize sample (205 S stars with and ) in order to derive the respective properties (like galactic distribution and relative frequencies) of intrinsic (i.e. genuine asymptotic giant branch) S stars and extrinsic (i.e. post mass-transfer binary) S stars. High-resolution (R=30 000 to 60 000) spectra covering the range Å have been obtained for 76 S stars, 8 M stars and 2 symbiotic stars.
The Å and Å blends involving a Tc i line were analysed separately and yield consistent conclusions regarding the presence or absence of technetium. Only one ‘transition’ case (Hen 140 = HD 120179, a star where only weak lines of technetium are detectable) is found in our sample. A resolution greater than R is clearly required in order to derive unambiguous conclusions concerning the presence or absence of technetium. The Tc/no Tc dichotomy will be correlated with radial velocity and photometric data in a forthcoming paper.
Key Words.:
Stars: late-type – Stars: AGB and post-AGB – Stars: evolution – Stars: abundances – binaries: symbiotic1 Introduction
S stars have been identified as a class of peculiar red giants by Merrill (Merrill22 (1922)). Basically, the S stars emerge as a sequence parallel to the M stars as far as temperature is concerned, but with enhanced abundances of s-process elements. The chief observational difference between M and S spectra is the presence of ZrO bands in the latter. The s-process overabundances in S stars are explained in the framework of the Thermally Pulsing Asymptotic Giant Branch (TPAGB) evolution. Thermal instabilities (called thermal pulses) that affect the helium-burning shell of these stars have two important consequences: they provide the proper environment for the nucleosynthesis of s-process elements, and they trigger an envelope response (the third dredge-up) that allows the s-process elements and carbon to be brought to the surface [see e.g. Mowlavi (Mowlavi (1997)) for a review].
Technetium is an s-process element with no stable isotope that was first identified in the spectra of some M and S stars by Merrill (Merrill52 (1952)). 99Tc, with a laboratory half-life of yr, is the only technetium isotope produced by the s-process. The high temperatures encountered during thermal pulses strongly shorten the effective half-life of 99Tc ( yr at K, Cosner et al. Cosner (1984)) but the large neutron densities at these high temperatures more than compensate the reduction of 99Tc life-time (Mathews et al. Mathews (1986)) and enable a substantial technetium production. Third dredge-up episodes then carry technetium to the envelope, where it decays steadily at its terrestrial rate of yr. Starting from an abundance corresponding to the maximum observed one, technetium should remain detectable during yr (Smith & Lambert Smith (1988)). If the dredge-up of heavy elements occurs after each thermal pulse (occurring every yr), virtually all s-process enriched TPAGB stars should exhibit technetium lines.
However, Straniero et al. (Straniero (1995)) advocated that the s-process nucleosynthesis mainly occurs during the interpulse. When technetium is engulfed in the subsequent thermal pulse, it will decay at a fast rate because of the high temperature, and will not be replenished if there is no neutron source operating within the pulse itself. The conclusion that s-process enriched TPAGB stars should necessarily exhibit technetium would then be challenged. Nevertheless, all the S stars identified as TPAGB stars by Van Eck et al. (Van Eck98 (1998)) thanks to the HIPPARCOS parallaxes turned out to be Tc-rich. A survey of technetium in a large sample of S stars like the Henize sample may be expected to provide further constraints on the s-process environment in AGB stars (e.g. interpulse s-process versus thermal-pulse s-process, thermal-pulse duration and temperature versus 99Tc half-life).
Not all S stars exhibit Tc lines though (Little-Marenin & Little Little-Marenin (1979), Little et al. Little (1987)), but technetium-poor stars (also called extrinsic, as opposed to technetium-rich, intrinsic S stars) are currently believed to emerge from a totally different evolutionary history: because they are members of binary systems (Brown et al. Brown (1990), Jorissen et al. Jorissen93 (1993), Johnson et al. Johnson (1993), Jorissen et al. Jorissen (1998)), they rather owe their chemical peculiarities to the accretion of s-process-rich matter from their companion (formerly a TPAGB star, now an undetected white dwarf). They are technetium-poor, because enough time has elapsed for the technetium to decay since the mass transfer event. The 99Tc half-life is indeed much shorter than any stellar evolutionary timescale (but the TPAGB). Such a polluted giant star will be classified either as a G or K giant with enhanced heavy elements (i.e. as a barium star) or, if it has cooled enough for the ZrO molecular bands to appear, as a technetium-poor S star.
Besides technetium detection, several spectroscopic criteria (of various efficiencies) aiming at distinguishing extrinsic from intrinsic S stars have been mentioned in the literature [e.g. oxygen isotopic ratio (Smith & Lambert Smith90 (1990)), presence of the He I line (Brown et al. Brown (1990)), zirconium isotopic ratio (Busso et al. Busso (1992))], but technetium detection appears to be, by far, the most secure and tractable way to unmask extrinsic S stars.
This unmasking operation is crucial when deriving fundamental stellar quantities such as the third dredge-up luminosity threshold (commonly measured as the minimum luminosity of S stars). Evolutionary timescales of TPAGB stars can be strongly in error if the considered star samples are polluted by non-AGB, mass-transfer S stars.
We therefore decided to study a large and properly defined sample of S stars in order to disentangle the two sub-families and to study their respective characteristics. The Henize sample of S stars (Henize Henize (1960), as listed in Stephenson Stephenson (1984)) consists of 205 S stars south of and brighter than . Radial velocity data, low- and high-resolution spectroscopy, as well as Geneva photometry have been collected over several years. The present paper deals with high-resolution technetium spectra for 72 Henize stars. Some additional K, M and symbiotic stars data are also presented. Results concerning binarity and photometry, as well as the global analysis of the different data sets, are postponed to a forthcoming paper.
2 Observations and reduction
2.1 Instrumental set-up
The high-resolution spectra used in the present study were obtained during several runs (1991-1998) at the European Southern Observatory, with the Coudé Echelle Spectrometer (CES) fed by the 1.4m Coudé Auxiliary Telescope (CAT). The 1991-1993 runs were performed with the short camera (f/1.8) and CCD #9 (RCA SID 503 thinned, backside illuminated, pixels of m), whereas the long camera (f/4.7) and CCD #38 (Loral/Lesser thinned, backside illuminated, UV flooded, pixels of m) were used during the 1997-1998 runs. Details on these configurations can be found in Lindgren & Gilliotte (Lindgren (1989)) and Kaper & Pasquini (Kaper (1996)). The resolution ranges from 0.14Å (R=30 000) to 0.07Å (R=60 000) for a central wavelength of 4250Å. The spectra approximately cover the wavelength range 4230-4270Å.
2.2 Stellar samples
The observed stars are a subset of the sample of 205 S stars collected by Henize (Henize (1960)) from his objective-prism survey (with a dispersion of 450Å/mm at H) of ZrO stars south of and brighter than . Given the limitations on the CAT pointing and on the detectors sensitivity, only stars with , and (translating into 70 objects) could be observed in a reasonable amount of time, i.e. less than 1h30 per star. A few bright redder stars could also be observed (but see the discussion on SC stars in Sect. 3.2). A sample of bright M stars with an excess at m [indicative of a possibly detached dust shell; see Zijlstra et al. (Zijlstra (1992))], as well as the two symbiotic stars RW Hya and SY Mus, and some radial-velocity standards have also been observed. Three non-Henize S stars from our radial-velocity monitoring (Udry et al. Udry (1998)) have been included as well. The log of the observations, including the instrumental setting, is given in Table 1 and, for Henize stars, in Table 2.
The first column identifies the star by its HD, HR or BD number. The spectral type is quoted next. The next two columns list the civil date of the observation (day month year) and the Julian date (JD - 2 448 000.5). The column CCD provides the instrumental setting (9-sh: CCD #9 short camera; 38-l: CCD #38 long camera). The next column indicates the spectral resolution. The next six columns give, for the two considered technetium blends (at 4262Å and 4238Å, respectively), the (Doppler-shift corrected) central wavelength of the technetium blend ( - 4200Å), the standard deviation on the Doppler shift (, in Å) and the signal-to-noise ratio (see text). The technetium-rich (y) or technetium-poor (n) status is given next, while the last column contains additional remarks
| HD/BD | type | cdate | Jdate | CCD | R | 4262Å blend | 4238Å blend | Tc | Remarks | ||||
| S/N | S/N | ||||||||||||
| M stars | |||||||||||||
| HR 4938 | M3.5III | 160393 | 1063.3 | 9-sh | 45000 | 62.104 | 0.012 | 41 | 38.366 | 0.028 | 29 | n | V789 Cen |
| HR 5064 | K5-M0III | 150393 | 1062.3 | 9-sh | 45000 | 62.097 | 0.010 | 76 | 38.353 | 0.030 | 61 | n | |
| HR 5134 | M5III | 150393 | 1062.3 | 9-sh | 45000 | 62.069 | 0.015 | 70 | 38.356 | 0.037 | 53 | n | V744 Cen |
| M stars with 60m excess | |||||||||||||
| 73341 | M3/M4III | 300593 | 1138.0 | 9-sh | 45000 | 62.103 | 0.011 | 33 | 38.370 | 0.030 | 25 | n | SAO 236108 |
| 91094 | M1III | 300593 | 1138.0 | 9-sh | 45000 | 62.099 | 0.014 | 39 | 38.357 | 0.025 | 34 | n | SAO 250981 |
| 179199 | M2III | 290593 | 1137.4 | 9-sh | 45000 | 62.097 | 0.017 | 18 | 38.354 | 0.032 | 15 | n | SAO 162305 |
| 181620 | M2III | 290593 | 1137.4 | 9-sh | 45000 | 62.109 | 0.016 | 29 | 38.368 | 0.025 | 23 | n | V4415 Sgr;SAO 211215 |
| Symbiotic stars | |||||||||||||
| 100336 | M4.5 | 160393 | 1063.2 | 9-sh | 45000 | 62.094 | 0.020 | 11 | 38.347 | 0.029 | 8 | n | SY Mus |
| 117970 | M2 | 150393 | 1062.2 | 9-sh | 45000 | 62.115 | 0.011 | 31 | 38.363 | 0.042 | 24 | n | RW Hya |
| Non-Henize S stars | |||||||||||||
| 1760 | M5-6Se | 300792 | 834.4 | 9-sh | 30000 | 62.230 | 0.020 | 65 | 38.142 | 0.030 | 55 | y | T Ceti (also M5-6Ib-II) |
| ∘2601 | S3*3 | 310197 | 2480.2 | 38-l | 60000 | 62.097 | 0.007 | 22 | 38.365 | 0.024 | 16 | n | |
| ∘1900 | S4/6 | 240298 | 2869.0 | 38-l | 60000 | 62.239 | 0.029 | 15 | 38.256 | 0.035 | 11 | y | |
| ∘4356 | S4*3 | 290593 | 1137.3 | 9-sh | 45000 | 62.210 | 0.015 | 19 | 38.079 | 0.033 | 11 | y | see note |
| Radial velocity standards | |||||||||||||
| 80170 | K5III | 240298 | 2869.1 | 38-l | 60000 | 62.099 | 0.011 | 84 | 38.356 | 0.018 | 66 | n | |
| 108903 | M3.5III | 240298 | 2869.3 | 38-l | 60000 | 62.104 | 0.012 | 233 | 38.372 | 0.016 | 182 | n | Cru A |
Note: The S star BD∘4356 = GCGSS 1193 = SAO 125493 = IRAS 20062+0451 has been erroneously associated by MacConnell (MacConnell (1982)) with the nearby (non-S) star BD∘4354. The coordinates in the original paper are nevertheless correct. Since then, this error has propagated in the literature (Stephenson Stephenson (1984), Jorissen et al. Jorissen93 (1993), Chen et al. Chen (1995), Jorissen et al. Jorissen (1998), Udry et al. Udry (1998)), although in all these papers the measured star was indeed the S star BD∘4356.
| Hen | GC- | HD/DM | type | cdate | Jdate | CCD | R | 4262Å blend | 4238Å blend | Tc | Remarks | ||||
|---|---|---|---|---|---|---|---|---|---|---|---|---|---|---|---|
| GSS | S/N | S/N | |||||||||||||
| 1 | 3 | 310 | S3,1 | 210991 | 521.2 | 9-sh | 30000 | 62.107 | 0.008 | 36 | 38.375 | 0.013 | 34 | n | |
| 2 | 39 | 9810 | S2,1 | 210991 | 521.3 | 9-sh | 30000 | 62.094 | 0.015 | 21 | 38.372 | 0.014 | 18 | n | |
| 3 | 104 | 29704 | S: | 210991 | 521.3 | 9-sh | 30000 | 62.088 | 0.019 | 26 | 38.396 | 0.016 | 23 | n | |
| 5 | 139 | S3,3 | 010297 | 2481.0 | 38-l | 60000 | 62.089 | 0.007 | 18 | 38.394 | 0.010 | 12 | n | ||
| 6 | 141 | S5,2 | 300197 | 2479.1 | 38-l | 60000 | 62.091 | 0.008 | 22 | 38.379 | 0.015 | 11 | n | ||
| 7 | 178 | 40706 | S2,1 | 150393 | 1062.0 | 9-sh | 45000 | 62.126 | 0.022 | 22 | 38.367 | 0.025 | 20 | n | |
| 8 | 202 | ∘2449 | S5,6 | 010297 | 2481.1 | 38-l | 60000 | 62.227 | 0.020 | 18 | 38.194 | 0.042 | 14 | y | |
| 9 | 204 | ∘1381 | S3,3 | 160393 | 1063.0 | 9-sh | 45000 | 62.099 | 0.008 | 16 | 38.349 | 0.024 | 13 | n | |
| 14 | 242 | ∘3019 | S2,5 | 160393 | 1063.1 | 9-sh | 45000 | 62.104 | 0.004 | 13 | 38.363 | 0.023 | 10 | n | |
| 16 | 248 | S: | 310197 | 2480.2 | 38-l | 60000 | 62.258 | 0.019 | 13 | 38.172 | 0.014 | 7 | y | ||
| 18 | 294 | ∘3719 | S6,8e | 150393 | 1062.0 | 9-sh | 45000 | 62.072 | 0.032 | 13 | 38.378 | 0.033 | 10 | n | |
| 19 | 328 | 310197 | 2480.1 | 38-l | 60000 | 62.229 | 0.015 | 16 | 38.233 | 0.021 | 12 | y | |||
| 20 | 342 | ∘3132 | 310197 | 2480.0 | 38-l | 60000 | 62.230 | 0.016 | 27 | 38.120 | 0.017 | 16 | y | ||
| 28 | 390 | 62340 | S4,4 | 010297 | 2481.1 | 38-l | 60000 | 62.079 | 0.016 | 36 | 38.381 | 0.011 | 26 | n | |
| 31 | 434 | 65152 | S1,1 | 150393 | 1062.1 | 9-sh | 45000 | 62.093 | 0.009 | 31 | 38.369 | 0.026 | 27 | n | |
| 34 | 446 | S7,2 | 010297 | 2481.1 | 38-l | 60000 | 62.254 | 0.022 | 39 | 38.193 | 0.013 | 30 | y | X Vol | |
| 35 | 447 | ∘435 | S1,1 | 300197 | 2479.1 | 38-l | 60000 | 62.078 | 0.010 | 19 | 38.375 | 0.026 | 11 | n | |
| 36 | 448 | ∘5393 | S3,1 | 150393 | 1062.1 | 9-sh | 45000 | 62.222 | 0.011 | 22 | 38.141 | 0.028 | 17 | y | |
| 37 | 456 | ∘3702 | S4,2 | 010297 | 2481.2 | 38-l | 60000 | 62.260 | 0.004 | 19 | 38.090 | 0.017 | 12 | y | |
| 39 | 461 | ∘601 | S6,2 | 010297 | 2481.2 | 38-l | 60000 | 62.238 | 0.004 | 31 | 38.118 | 0.014 | 21 | y | |
| 41 | 474 | ∘5131 | S4,2 | 010297 | 2481.2 | 38-l | 60000 | 62.219 | 0.027 | 31 | 38.210 | 0.019 | 23 | y | |
| 43 | 487 | ∘5801 | S4,4 | 240298 | 2869.1 | 38-l | 60000 | 62.099 | 0.012 | 15 | 38.348 | 0.026 | 10 | n | |
| 45 | 490 | ∘5117 | 010297 | 2481.3 | 38-l | 60000 | 62.212 | 0.015 | 25 | 38.147 | 0.019 | 18 | y | ||
| 57 | 559 | S4,2 | 310197 | 2480.2 | 38-l | 60000 | 62.221 | 0.021 | 21 | 38.145 | 0.019 | 14 | y | ||
| 63 | 588 | ∘5772 | S4,1 | 300197 | 2479.2 | 38-l | 60000 | 62.103 | 0.013 | 15 | 38.364 | 0.017 | 10 | n | |
| 64 | 591 | ∘6970 | S7/5e | 010297 | 2481.3 | 38-l | 60000 | 62.252 | 0.010 | 17 | 38.181 | 0.031 | 7 | y | |
| 66 | 593 | ∘5803 | S5,2 | 310197 | 2480.3 | 38-l | 60000 | 62.226 | 0.029 | 18 | 38.138 | 0.013 | 12 | y | |
| 79 | 653 | S5,2 | 240298 | 2869.2 | 38-l | 60000 | 62.097 | 0.011 | 19 | 38.388 | 0.023 | 14 | n | ||
| 80 | 656 | S5,6 | 150393 | 1062.2 | 9-sh | 45000 | 62.254 | 0.017 | 15 | 38.138 | 0.022 | 12 | y | KN Car | |
| 88 | 667 | ∘8296 | S5,2 | 300197 | 2479.3 | 38-l | 60000 | 62.220 | 0.012 | 15 | 38.122 | 0.008 | 10 | y | |
| 89 | 668 | S3,1 | 300197 | 2479.3 | 38-l | 60000 | 62.223 | 0.018 | 18 | 38.091 | 0.012 | 9 | y | ||
| 90 | 672 | ∘3378 | S5,6 | 240298 | 2869.2 | 38-l | 60000 | 62.083 | 0.008 | 22 | 38.372 | 0.021 | 16 | n | |
| 95 | 693 | S4,2 | 300593 | 1138.0 | 9-sh | 45000 | 62.229 | 0.016 | 12 | 38.138 | 0.020 | 8 | y | ||
| 97 | 696 | S5,2 | 290593 | 1137.1 | 9-sh | 45000 | 62.224 | 0.006 | 21 | 38.148 | 0.033 | 16 | y | HP Vel | |
| 101 | 704 | S5,4 | 240298 | 2869.3 | 38-l | 60000 | 62.247 | 0.037 | 21 | 38.165 | 0.032 | 15 | y | Z Ant | |
| 104 | 714 | 95013 | S5,4 | 300593 | 1138.1 | 9-sh | 45000 | 62.208 | 0.015 | 10 | 38.176 | 0.008 | 6 | y | |
| 108 | 720 | 95875 | S3,3 | 300197 | 2479.3 | 38-l | 60000 | 62.087 | 0.014 | 34 | 38.368 | 0.017 | 21 | n | |
| 119 | 778 | 104361 | S3,3 | 010297 | 2481.4 | 38-l | 60000 | 62.084 | 0.010 | 27 | 38.377 | 0.015 | 16 | n | |
| 121 | 792 | ∘8661 | S4,6e | 300593 | 1138.1 | 9-sh | 30000 | 62.098 | 0.016 | 10 | 38.374 | 0.035 | 8 | n | |
| 123 | 795 | ∘7642 | S4,2 | 160393 | 1063.3 | 9-sh | 45000 | 62.096 | 0.013 | 20 | 38.358 | 0.027 | 14 | n | CSV101280 |
| 126 | 802 | S4,2 | 240298 | 2869.4 | 38-l | 60000 | 62.100 | 0.018 | 17 | 38.368 | 0.022 | 12 | n | ||
| 129 | 808 | ∘8238 | S4,4 | 290593 | 1137.1 | 9-sh | 45000 | 62.073 | 0.018 | 14 | 38.384 | 0.034 | 11 | n | |
| 132 | 813 | ∘869 | S4,6 | 300593 | 1138.2 | 9-sh | 30000 | 62.081 | 0.011 | 12 | 38.355 | 0.038 | 9 | n | |
| 133 | 814 | 114586 | S5,4 | 240298 | 2869.3 | 38-l | 60000 | 62.073 | 0.008 | 20 | 38.367 | 0.021 | 16 | n | |
| 137 | 824 | ∘7894 | 160393 | 1063.3 | 9-sh | 45000 | 62.088 | 0.013 | 22 | 38.366 | 0.028 | 14 | n | ||
| 138 | 826 | 118685 | S6,2 | 150393 | 1062.3 | 9-sh | 45000 | 62.092 | 0.008 | 32 | 38.367 | 0.027 | 25 | n | -71 963 |
| 140 | 832 | 120179 | S3,1 | 310197 | 2480.3 | 38-l | 60000 | – | – | 36 | – | – | 27 | y | see text |
| 140 | 832 | 120179 | S3,1 | 300593 | 1138.2 | 9-sh | 30000 | – | – | 26 | – | – | 20 | y | see text |
| 141 | 834 | 120460 | S8,5 | 230597 | 2592.2 | 38-l | 60000 | 62.250 | 0.044 | 19 | 38.181 | 0.018 | 12 | y | VX Cen |
| 143 | 839 | 122434 | S3,1 | 010297 | 2481.4 | 38-l | 60000 | 62.092 | 0.013 | 27 | 38.372 | 0.019 | 19 | n | -41 8409 |
| 147 | 858 | ∘10393 | S3,3 | 290593 | 1137.2 | 9-sh | 45000 | 62.084 | 0.024 | 9 | 38.356 | 0.015 | 7 | n | |
| 149 | 864 | 130859 | S4,2 | 150393 | 1062.4 | 9-sh | 45000 | 62.102 | 0.007 | 13 | 38.370 | 0.023 | 10 | n | |
| 150 | 867 | 131217 | S6,2 | 010892 | 836.0 | 9-sh | 30000 | 62.093 | 0.012 | 6 | 38.376 | 0.037 | 5 | n | |
| 162 | 927 | S5,2 | 300593 | 1138.3 | 9-sh | 30000 | 62.239 | 0.016 | 18 | 38.181 | 0.039 | 14 | y | ||
| 173 | 962 | S4,2 | 300593 | 1138.3 | 9-sh | 30000 | 62.096 | 0.015 | 9 | 38.336 | 0.044 | 7 | n | ||
| 175 | 974 | 156957 | S6/3+ | 310792 | 835.1 | 9-sh | 30000 | 62.243 | 0.032 | 21 | 38.142 | 0.027 | 16 | y | V635 Sco |
| 177 | 977 | ∘12687 | S: | 230597 | 2592.4 | 38-l | 60000 | 62.232 | 0.032 | 24 | 38.107 | 0.027 | 12 | y | |
| 178 | 978 | 157335 | S5,4 | 300593 | 1138.4 | 9-sh | 30000 | 62.272 | 0.020 | 10 | 38.118 | 0.049 | 6 | y | V521 Oph |
| 179 | 994 | 160379 | S5,2 | 150393 | 1062.4 | 9-sh | 45000 | 62.090 | 0.012 | 17 | 38.369 | 0.025 | 13 | n | |
| 182 | 1010 | 163896 | S4,2 | 310792 | 835.2 | 9-sh | 30000 | 62.082 | 0.008 | 25 | 38.376 | 0.027 | 22 | n | V745 Sgr |
| 183 | 1014 | 164392 | 310792 | 835.1 | 9-sh | 30000 | 62.089 | 0.013 | 26 | 38.369 | 0.029 | 22 | n | ||
| 186 | 1023 | 165774 | S4,6 | 210991 | 521.0 | 9-sh | 30000 | 62.090 | 0.011 | 30 | 38.375 | 0.012 | 26 | n | |
| 187 | 1025 | 165843 | S2,1 | 300593 | 1138.4 | 9-sh | 30000 | 62.084 | 0.014 | 20 | 38.388 | 0.038 | 14 | n | |
| 191 | 1056 | 171100 | S5,4 | 310792 | 835.2 | 9-sh | 30000 | 62.244 | 0.021 | 19 | 38.166 | 0.035 | 15 | y | V3574 Sgr |
| 193 | 1074 | ∘14695 | S4,2 | 300792 | 834.2 | 9-sh | 30000 | 62.106 | 0.006 | 9 | 38.344 | 0.018 | 8 | n | |
| 197 | 1195 | 191630 | S4,4 | 210991 | 521.0 | 9-sh | 30000 | 62.216 | 0.014 | 50 | 38.147 | 0.011 | 42 | y | |
| 199 | 1212 | 310792 | 835.3 | 9-sh | 30000 | 62.094 | 0.013 | 14 | 38.363 | 0.021 | 12 | n | |||
| 201 | 1275 | ∘15676 | S3,3 | 300792 | 834.3 | 9-sh | 30000 | 62.098 | 0.013 | 15 | 38.366 | 0.045 | 13 | n | |
| 202 | 1294 | S5,7: | 210991 | 521.1 | 9-sh | 30000 | 62.270 | 0.034 | 27 | 38.191 | 0.011 | 17 | y | Gru | |
| 203 | 1295 | S4,4 | 300792 | 834.3 | 9-sh | 30000 | 62.067 | 0.017 | 12 | 38.358 | 0.033 | 12 | n | ||
| 204 | 1303 | S6,6 | 310792 | 835.3 | 9-sh | 30000 | 62.116 | 0.016 | 19 | 38.368 | 0.023 | 17 | n | CSV103101 | |
2.3 Data reduction and S/N ratio
The CCD frames were corrected for the electronic offset (bias) and for the relative pixel-to-pixel response variations (flat-field). Wavelength calibration was performed from thorium lamp spectra taken several times per night. An optimal extraction of the spectra was performed according to the method of Horne (Horne (1986)). The whole reduction sequence was performed within the ‘long’ context of the MIDAS software package.
The signal-to-noise (S/N) ratio was estimated for each spectrum in the following way: three S/N values were computed for the three best exposed CCD lines (along the dispersion axis), in the neighborhood of the spectral region of interest (either 4262Å or 4238Å). These three S/N values were then combined according to Eq. 17 of Newberry (Newberry (1991)). When the exposure time on a given star has been split in two (in order to reduce cosmics detrimental effect), the final S/N ratio was computed using Eq. 18 of Newberry (Newberry (1991)). The degradation of the S/N ratio due to flat-field correction has not been taken into account, since flat-fields have little degrading effect for the low S/N values under consideration. The S/N ratio values are listed in Tables 1 and 2 for each target star. Because of the CCD spectral response, the S/N ratio near 4238Å is systematically lower than the one near 4262Å.
3 Analysis
3.1 Fit of the technetium blends
The three strong resonance lines of Tc i are located at 4238Å, 4262Å and 4297Å, with intensity ratios of 3:4:5. All three lines are severely blended (Little-Marenin & Little 1979, their Table III). With the adopted instrumental configurations, a single exposure spans 35 to 50Å; it is thus possible to observe simultaneously the 4238Å and 4262Å lines. In this analysis we follow the guidelines provided in the landmark paper of Smith & Lambert (Smith (1988)) and therefore concentrate on the most useful 4262Å line, while the 4238Å line is used as an independent confirmation.
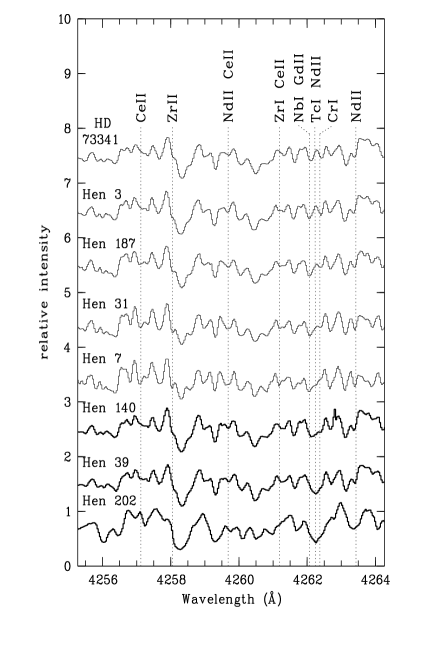
Fig. 1 shows examples of spectra in the 4262Å region for an M3-4 giant (HD 73341) and for seven S stars (four being technetium-poor: Hen 3, 187, 31, 7 and three technetium-rich: Hen 140, 39 and 202 = Gru). It can be seen that the Tc Å line is blended with two features; the bluest includes primarily Nb i (4262.050Å) and Gd ii (4262.087Å), and the reddest Cr i (4262.373Å) (see Fig. 1). A weaker contribution of Nd ii at 4262.228Å, almost on the top of the Tc i line, may also be present. These composite features are much weaker than the Tc i resonance line at its maximum strength; moreover, the Nb i-Gd ii blend and the Tc i line are 0.18Å apart. Therefore the shape and location of the Nb i-Gd ii (-Tc i) blend (hereafter called feature) clearly depends on whether it contains the technetium line or not. Quantitatively, the minimum of a gaussian fitted to a Tc-containing feature is shifted redward by Å with respect to the minimum of a gaussian fitted to a no-Tc feature; such a shift is easily detectable on our spectra (compare Hen 3 or Hen 7 with Hen 39 on Fig. 1).
In practice, each spectrum has been rebinned to zero-redshift in the following way: 10 nearby (Å on either side) apparently unblended stellar features with unambiguous identification, are adopted as wavelength standards. Gaussian profiles are fitted to these lines and provide a mean redshift. The wavelength of the feature is then computed as the minimum of a gaussian centered on the feature of the redshift-corrected spectrum. Typical uncertainties on the wavelength amount to 0.013Å for technetium-poor stars and 0.020Å for technetium-rich stars (as derived from the standard deviation on the mean redshift).
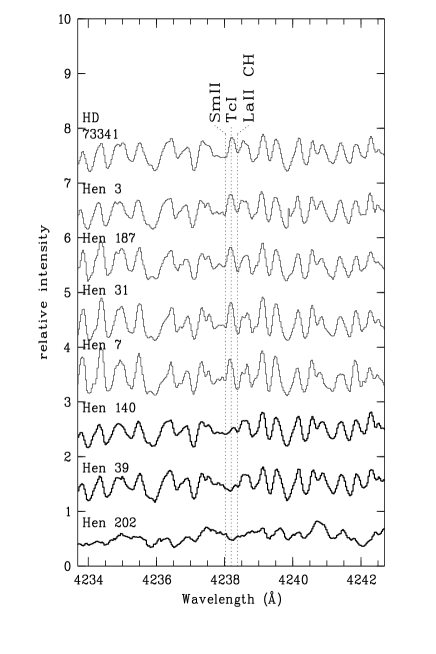
The same method is applied to the 4238Å technetium line, where the CH-La ii blend has been taken as the feature (Fig. 2). Typical uncertainties on the wavelength are slightly larger (0.023Å for Tc-rich S stars and 0.025Å for Tc-poor S stars) because of the lower S/N ratio and the stronger blending at 4238Å. Results are listed in Tables 1 and 2; the and features always yield consistent results regarding the absence or presence of technetium, except for Hen 140 (=HD 120179).
This star is indeed unique in having very weak technetium features (see Figs. 1 and 2). A second spectrum, taken 3.5 years later, is almost identical to the one displayed in Fig. 1 and 2. The blind application of gaussian fitting to the feature of Hen 140 yields a central wavelength that would qualify it as Tc-poor; however, the extreme weakness of the pseudo-emission separating the LaII-CH blend from the SmII line as seen in Hen 140 (Fig. 2) is unusual for Tc-poor stars, and suggests the presence of a weak technetium line, as confirmed from the appearance of the feature. We therefore believe that Hen 140 is the unique example in our sample of an S star with very weak Tc lines.
In all the other cases, technetium (non-) detection relies on the location of the minimum of a gaussian fitted to the (or ) blend.
Are there, with this method, risks (i) to misclassify as Tc-rich a truly Tc-poor star, and (ii) to misclassify as Tc-poor a truly Tc-rich star? We show in the remaining of this section that both risks are most probably non-existent in the present study.
Error (i) could, in principle, affect very luminous Tc-poor stars, because their large macroturbulence would broaden their feature, which could then possibly mimick a Tc-rich feature.
In order to test this hypothesis, gaussian filters of different widths have been applied to Tc-poor spectra, so as to make their line widths comparable to those of the stars classified as Tc-rich. This simulation clearly shows that even the largest macroturbulence value observed in our sample (T Ceti) is not large enough to make truly Tc-poor stars appear as Tc-rich from the broadening of their feature. That conclusion is even more stringent when considering the feature. However, this risk cannot be excluded for very luminous stars (class I or II) if observed at lower resolution (R ).
Error (ii) could, in principle, occur for stars displaying a ‘weak technetium line’ (weaker than the Tc lines of Hen 140 discussed above) with an intensity not large enough to shift the blend redward from the Tc-poor wavelength. In fact, some stars in our sample exhibit an ‘ambiguous’ blend, in the sense that the pseudo-emission located between the Nb i-Gd ii lines and the Cr i line becomes very weak or even disappears, mimicking a ‘weak technetium line’ (a typical example is Hen 7 on Fig. 1). Such a star is classified by our method as technetium-poor, for the minimum of the blend remains unchanged with respect to the no-Tc cases.
In fact, all intermediates exist between the ‘unambiguous’ Tc-poor blends (with a clear central pseudo-emission, see HD 73341 and Hen 3 on Fig. 1) and the ‘ambiguous’ blends (where this pseudo-emission is absent, as in Hen 7); two typical transition cases are plotted on Fig. 1 (Hen 187 and Hen 31). These ‘ambiguous’ spectra were taken during different observing runs; the shape of the blend is independent of the resolution and of the S/N ratio of the spectra.
Do these ‘ambiguous’ spectra correspond to stars with a weak technetium line, intermediate between the clear Tc-poor and Tc-rich cases? In fact these ‘ambiguous’ spectra are clearly different from the spectum of the weakly Tc-rich star Hen 140, for their feature is identical to the feature of the unambiguous Tc-poor stars (Fig. 2), which clearly indicates that technetium is absent in these stars.
It may therefore be concluded that our method of gaussian fit to the and features is able to properly separate technetium-rich from technetium-poor S stars.
What then causes the variety of features observed in Fig. 1 for technetium-poor S stars? The spectral sequence going from Hen 3 to Hen 7 on Fig. 1 is not a temperature sequence. The temperature of the stars of our sample have been derived from the color index using the Ridgway et al. (Ridgway (1980)) calibration, the magnitudes from Catchpole et al. (Catchpole79 (1979)) and our Geneva photometry. Although the bulk of technetium-rich S stars are clearly cooler than technetium-poor S stars (see also Van Eck et al. Van Eck98 (1998)), there is no sign whatsoever of a possible correlation between the shape of the blend of technetium-poor stars and their temperature. MOOG (Sneden Sneden (1974)) synthetic spectra (for stars with TK as derived from their index) indicate that neither gravity nor metallicity can significantly modify the blend.
A closer inspection of the spectral sequence of Fig. 1 (from HD 73341 to Hen 7) reveals that several lines become stronger as the central pseudo-emission of the blend weakens. The major contributors to these features, identified with the help of synthetic spectra, are indicated on the top of Fig. 1. It is noteworthy that all these elements are s-process elements. The sequence of spectra (drawn with a thin line) in Fig. 1 is thus, from top to bottom, a sequence of increasing s-process line strengths (s-process lines being weak, as expected, in the M star HD 73341). The line which progressively blends the feature of technetium-poor stars is thus probably an s-process line as well. Since it cannot be technetium (see above), a good candidate is the 4262.228Å line of Nd ii, or perhaps the wing of the Gd ii line at 4262.087Å.
It is not surprising to find a wide range of s-process enhancements among technetium-poor S stars, since these stars have accreted their s-process-enriched matter from a companion star. Hence the level of chemical peculiarities is not linked to the evolutionary status of the star, but rather depends upon the amount of s-process accreted matter (see Jorissen et al. Jorissen (1998) for a detailed discussion).
These s-process lines are more difficult to see in the technetium-rich S stars, probably because in these cooler and more luminous stars, lines are broader (because of a larger macroturbulence) and the molecular blanketing is more severe.
3.2 Misclassified and SC stars
The method outlined in Sect. 3.1 cannot be applied to four stars of our sample which exhibit peculiar spectra (Hen 22, 135, 154 and 198). In order to check the assignment of the Henize stars to spectral type S, low-resolution spectra ( nm, ÅÅ) have been obtained for all stars from Hen 3 to Hen 165 at ESO on the 1.52m telescope equipped with the Boller & Chivens spectrograph and grating #23 (Van Eck et al. Van Eck (1999)).
Two misclassified stars have been uncovered: Hen 22 and Hen 154 show no sign of ZrO bands whatsoever in their spectra. Besides, Hen 22 is classified as ‘S:’ by Henize. Both stars cannot be dwarfs because their NaD and MgH 4780Å features are too weak. Their prominent Ca i 4455Å line and their weak CN 7895Å band point towards them being giant stars rather than supergiants. Type Ia supergiants can certainly be ruled out because their absolute magnitudes ( and -7.5 for G8Ia and K3-5I respectively, Landolt-Börnstein Landolt (1982)) would result in much too large heights above the galactic plane (7.5 kpc for Hen 154 and 13.2 kpc for Hen 22). Hen 154 is probably a late G giant (G8), and Hen 22 a mid-K giant (K3-5). These assignments are compatible with the Geneva photometry available for these two stars.
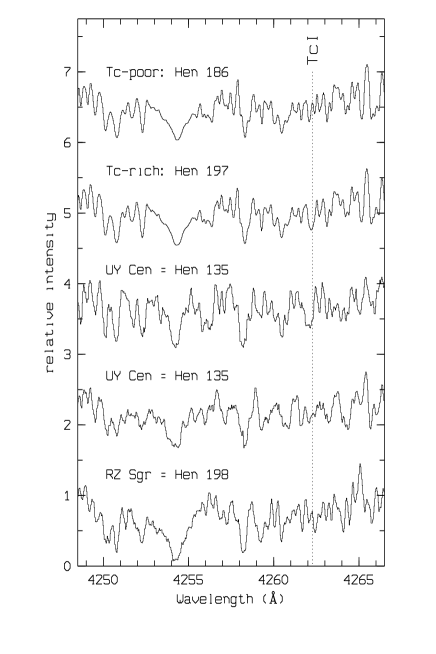
As far as Hen 135 and Hen 198 are concerned, Fig. 3 shows that the spectra of these stars are very different from those of other S stars of the Henize sample. Many spectral features adopted as wavelength standards, as well as the technetium blend, are difficult or even impossible to identify in the spectra of Hen 135 and Hen 198. In fact, we show below that these two stars are the only two SC stars in the subsample of Henize S stars observed with the CAT111 Although the Henize sample contains several SC stars, they are usually too red, hence too faint at 4250Å, to be observed with the CAT.. Hen 135 () and Hen 198 () were indeed the only very red stars () which were bright enough to allow spectra to be taken in the violet.
SC stars are known to have very peculiar spectra. Their spectrum is filled with strong atomic lines and almost no molecular bands in the optical, a consequence of their C/O ratio being very close to unity (Scalo Scalo (1973)). Catchpole & Feast (Catchpole71 (1971)) define SC stars from the following three criteria: (i) extremely strong Na D lines, (ii) drop in the continuum intensity shortward of 4500Å, and (iii) bands of ZrO and CN simultaneously present (though quite weak), as well as general resemblance of the spectrum (i.e. regarding ‘the absolute and relative strength of metal lines’) with that of UY Cen.
Hen 135 (=UY Cen) is thus the prototype SC star. Our two spectra of that star (taken in March 1993 and January 1997, see Fig. 3) are quite different; in particular the shape of the feature has changed noticeably. Therefore it is hazardous to infer the technetium content of UY Cen from these data alone without the help of appropriate model atmospheres and synthetic spectra, which is beyond the scope of this paper.
Hen 198 (=RZ Sgr) has an Se-type spectrum; Stephenson (Stephenson (1984)) quotes the HD catalogue noting that ‘the spectrum is similar to class N, but does not belong to that class’. It is probably associated with a reflection nebula (Whitelock Whitelock94 (1994)). RZ Sgr is a large-amplitude ( mag) SRb-type variable ( d). Its H emission, as well as the TiO and ZrO band strengths, are variable. Catchpole & Feast (Catchpole76 (1976)) also note that the Zr:Ti ratio of RZ Sgr is unusually high for an S star, and rather close to the one of N-type carbon stars.
Although RZ Sgr has not been classified as an SC star,
it shares many common features with that family.
Indeed, it reasonably meets the three criteria mentioned
above for SC stars:
(i) Reid and Mould (Reid (1985)) measured
the strength of the Na D lines
for several S, SC and C stars, including RZ Sgr.
A spectrophotometric index of 1.07 is found for RZ Sgr, much larger
than typical values for
S stars (0.22 for BD∘4592 and 0.28 for NQ Pup),
but comparable to values obtained for SC stars
(0.55 for LMC 441, 1.73 for R CMi, 2.57 for VX Aql).
Thus RZ Sgr has abnormally strong Na D lines with respect to other S stars.
(ii) The ultraviolet flux deficiency of SC stars is clearly apparent from photometric data in the Geneva system. Indeed, the mean wavelengths of the and filters are = 4227Å and = 5488Å (Rufener & Nicolet Rufener (1988)); therefore the index is highly sensitive to the ultraviolet flux deficiency of SC stars occurring for Å. SC stars have , whereas the bulk of S stars have . In that respect again, RZ Sgr () is typical of SC stars.
(iii) ZrO is present (although weak) in RZ Sgr; we found no information about the possible presence of CN bands. Infrared CO bands are stronger in RZ Sgr than in many other S and SC stars (Whitelock et al. Whitelock85 (1985)), probably locking a great quantity of carbon.
The IRAS colours of RZ Sgr also share many similarities with SC stars: it is located in a region of the (,) color-color diagram (‘region E’ as defined by Jorissen & Knapp JorissenKnapp (1998)) containing mainly SC stars with large 60m excess and often resolved shells (see also Young et al. Young (1993)).
All these arguments therefore indicate that RZ Sgr is closely related to the SC family. As pointed out for UY Cen, the 4262Å and 4238Å lines of Tc i are very difficult to analyse in SC stars. An assignment of these two stars to either the Tc-rich or Tc-poor group has therefore not been attempted here. Abia & Wallerstein (Abia (1998)) nevertheless suggest that SC stars are Tc-rich, based on a quantitative analysis.
4 Discussion
4.1 The technetium dichotomy


The lower part of Fig. 4 shows the frequency histogram of the wavelength of the spectral feature for stars of Tables 1 and 2. The stars of our sample clearly segregate in two groups. The average wavelength of the bluer group is 4262.093Å; this group thus corresponds to Tc-poor S stars. The average wavelength of the redder group is 4262.235Å, thus revealing the contribution of the Tc i 4262.270Å line to the Gd ii-Nb i blend. The standard deviation on the wavelengths is 0.012Å for Tc-poor stars and 0.017Å for Tc-rich stars. These values are in good agreement with the estimated errors on the wavelength (0.013Å for Tc-poor and 0.020Å for Tc-rich stars, Sect. 3.1).
The two groups are clearly separated by a 0.08Å gap, with no intermediate cases. Therefore, in order to distinguish Tc-poor from Tc-rich stars (on our spectra of resolution in the range 30 000-60 000), a delimiting wavelength of 4262.16Å may be safely adopted.
A similar conclusion holds for the feature (Fig. 5), where a boundary wavelength of 4238.29Å unambiguously separates the two kinds of S stars. Fig. 5 further shows that the diagnostics provided by the and features are consistent with each other.
For comparison purpose the frequency histogram of the wavelength of the spectral feature as obtained by Smith & Lambert (Smith (1988)) is plotted in the upper part of Fig. 4, for their sample of MS and S stars (their Table 2). The segregation into Tc-poor and Tc-rich S stars (with 4 stars falling on their boundary wavelength at 4262.14Å) is not as clean as with our higher resolution spectra.
The small number of ‘transition stars’ in our sample (i.e. stars with weak Tc lines, the only case being Hen 140) is noteworthy. This result may provide constraints on the evolution with time of the technetium abundance along the TPAGB (Smith & Lambert Smith (1988); Busso et al. Busso (1992)) and clearly deserves further studies. For example, it would be of interest to investigate whether the small number of S stars with weak technetium lines found in our sample implies that the very first objects to dredge-up heavy elements on the TPAGB are not S stars but rather M stars. Indeed, the Tc detection threshold might not coincide with the ZrO detection threshold, but be slightly lower (i.e. stars would appear Tc-rich before being ZrO-rich); this would explain the puzzling Tc-rich M stars discovered by Little-Marenin & Little (Little-Marenin (1979)) and Little et al. (Little (1987)). It is moreover necessary to disentangle abundance effects from atmospheric effects on the technetium line strength.
Although a more detailed study is deferred to a forthcoming paper, it may already be mentioned at this point that the Tc/no-Tc dichotomy reported in this paper is not due to technetium being entirely ionized in the warmer S stars. Indeed, the Tc i/(Tc i + Tc ii) ratio is still in the warmest S stars (Teff=3800 K) while it amounts to at Teff=3500 K and to at Teff=3000 K, according to the Saha ionization equilibrium formula (with representative electron densities taken from model atmospheres).
4.2 M stars with 60m excess and symbiotic stars
None of the four M stars with 60m excess taken from the sample of Zijlstra et al. (Zijlstra (1992)) show technetium. This observation clearly indicates that these stars, which are surrounded by cool dust dating back to a former episode of strong mass loss, do not currently experience heavy elements synthesis followed by third dredge-ups. The same conclusion holds true for the two observed symbiotic stars (SY Mus and RW Hya).
5 Conclusion
High-resolution spectra have been obtained and analysed to infer the technetium content of 76 S, 8 M and 2 symbiotic stars. The presence or absence of technetium was deduced from the shape of two blends involving technetium at 4238Å and 4262Å (more precisely: from the wavelength of their minimum). However this method does not apply to SC stars. Two misclassified S stars (Hen 22 and Hen 154) have emerged. The technetium (non-)detection at 4238Å is consistent with the result at 4262Å. Only one ‘transition’ case (Hen 140 = HD 120179, a star where only weak lines of technetium are detectable) is found in our sample.
A resolution in excess of is definitely required to provide unambiguous conclusions regarding presence or absence of technetium. For example, at 4262Å, an s-process line (possibly Nd ii) is suspected to sometimes mimick a weak technetium line (although the 4238Å feature clearly shows that technetium is absent). The shape of the 4262Å feature varies from one Tc-poor star to another, depending on the s-process overabundance level, which is in turn a function of the amount of accreted matter by these binary S stars.
Among the 70 analysed Henize S stars, 41 turn out to be technetium-poor and 29 technetium-rich. That fraction may not be used, however, to infer the relative frequencies of intrinsic and extrinsic S stars, since the subsample of Henize S stars observed with the CAT is biased towards the brightest and bluest stars. The frequency of extrinsic/intrinsic S stars will be derived from the whole data set in a forthcoming paper.
Acknowledgements.
This research has made use of the Simbad database, operated at CDS, Strasbourg, France. S.V.E. thanks F.R.I.A. (Belgium) for financial support.References
- (1) Abia C., Wallerstein G., 1998, MNRAS 293, 89
- (2) Brown J.A., Smith V.V., Lambert D.L., Dutchover E.Jr., Hinkle K.H., Johnson H.R., 1990, AJ 99, 1930
- (3) Busso M., Gallino R., Lambert D.L., Raiteri C.M., Smith V.V., 1992, ApJ 399, 218
- (4) Catchpole R.M., Feast M.W., 1971, MNRAS 154, 197
- (5) Catchpole R.M., Feast M.W., 1976, MNRAS 175, 501
- (6) Catchpole R.M., Robertson B.S.C., Lloyd Evans T.H.H., Feast M.W., Glass I.S., Carter B.S., 1979, Circulars of the South African Astronomical Observatory, Vol 1, Nr 4, p 61
- (7) Chen P.S., Gao H., Jorissen A., 1995, A&AS 113, 51
- (8) Cosner K.R., Despain K.H., Truran J.W., 1984, ApJ 283, 313
- (9) Horne K., 1986, PASP 98, 609
- (10) Johnson H.R., Ake T.B., Ameen M.M., 1993, ApJ 402, 667
- (11) Jorissen A., Frayer D.T., Johnson H.R., Mayor M., Smith V.V., 1993, A&A 271, 463
- (12) Jorissen A., Knapp G. R., 1998, A&AS 129, 363
- (13) Jorissen A., Van Eck S., Mayor M., Udry S., 1998, A&A 332, 877
- (14) Henize K.G., 1960, AJ 65, 491
- (15) Kaper L., Pasquini L., 1996, CAT+CES Operating Manual, ESO, 3p6CAT-MAN-0633-0001
- (16) Landolt-Börnstein, Numerical Data and Functional Relationships in Science and Technology, New Series, Hellwege ed., Astronomy and Astrophysics, vol 2, subvol b, 1982
- (17) Lindgren H., Gilliotte A., 1989, The Coudé Echelle Spectrometer, The Coudé Auxiliary Telescope, ESO Operating Manual No. 8
- (18) Little-Marenin I.R., Little S.J., 1979, AJ 84, 1374
- (19) Little S.J., Little-Marenin I.R., Hagen-Bauer W., 1987, AJ94, 981
- (20) MacConnell D.J., 1982, A&AS 48, 355
- (21) Mathews G.J., Takahashi K., Ward R.A., Howard W.M., 1986, ApJ 302, 410
- (22) Merrill P.W., 1922, ApJ 56, 457
- (23) Merrill P.W., 1952, ApJ 116, 21
- (24) Mowlavi N., 1997, in: Tours Symposium on Nuclear Physics III, eds. M. Arnould, M. Lewitowicz, Y.T. Oganessian, M. Ohta, H. Utsunomiya, T. Wada, AIP Conf. Proc. 425, p507
- (25) Newberry M.V., 1991, PASP 103, 122
- (26) Reid N., Mould J., 1985, ApJ, 299,236
- (27) Ridgway S.T., Joyce R.R., White N.M., Wing R.F., 1980, ApJ 235, 126
- (28) Rufener F., Nicolet B., 1988, A&A 206, 357
- (29) Scalo J.M., 1973, ApJ 186, 967
- (30) Sneden C., 1974, Ph. D. Thesis, University of Texas, Austin
- (31) Smith V.V., Lambert D.L., 1988, ApJ 333, 219
- (32) Smith V.V., Lambert D.L., 1990, ApJS 72, 387
- (33) Stephenson C.B., 1984, The General Catalogue of Galactic S Stars, Publ. Warner & Swasey Observ. 3,1
- (34) Straniero O., Gallino R., Busso M., Chiefei A., Raiteri C. M., Limongi M., Salaris M., 1995, ApJ 440, L85
- (35) Udry S., Mayor M., Van Eck S., Jorissen A., 1998, A&AS 131, 25
- (36) Van Eck S., Jorissen A., Udry S., Mayor M., Pernier B., 1998, A&A 329, 971
- (37) Van Eck S., Jorissen A., 1999, in preparation
- (38) Whitelock P., 1994, MNRAS 270, L15
- (39) Whitelock P., Catchpole R.M., 1985, MNRAS 212, 873
- (40) Young K., Phillips T.G., Knapp G.R., 1993, ApJS 86, 517
- (41) Zijlstra A.A., Loup C., Waters L.B.F.M., de Jong T., 1992, A&A 265, L5