e-mail:nanda@prl.ernet.in,anand@prl.ernet.in 22institutetext: Joint Astronomy Center, 660 N. A’ohōkū Place, University Park,Hilo, HI 96720, USA
e-mail:cdavis@jach.hawaii.edu
Shocked Molecular Hydrogen from RNO 91
Abstract
We report the detection of the H2 =1-0 S(1) line at 2.122m, from RNO 91 in the L43 dark cloud, which is known to be a T Tauri star surrounded by a 1700AU disk structure (containing ices) and a weak outflow. The non-detection of the H2 =2-1 S(1) line at 2.247m suggests shock excitation rather than fluorescence. The emission is extended spatially up to 9 in the north-south direction. The line intensity peak (FWHM 3) corresponds to the star RNO 91 which is embedded in a cocoon of gas and dust. The observed H2 emission from this cocoon may be attributed to embedded Herbig-Haro like knots. The H2 line flux in the central is estimated to be ergs sec-1cm-2, which indicates a mass flow rate of M⊙ yr-1. Furthermore, narrow band image taken through H2 1-0 S(1) filter is presented, which reveal a tilted disk and bipolar outflow structure that agrees with earlier observations and models. We show that this disk/outflow system is a unique case.
Key Words.:
stars: formation - infrared: spectrum - outflows: HH knots - stars: pre-main-sequence1 Introduction
The near-IR molecular hydrogen emission lines are recognised as being important tools in studies of star formation (Shull & Beckwith shul (1989)). The excitation of these lines involves mainly two competing processes: (i) shock heating and (ii) UV fluorescence (Burton bur92 (1992)). It is possible, however, to distinguish between these two processes by measuring the ratios of intensities of lines arising from two different vibrational levels (Sternberg & Dalgarno ster (1989), Hora & Latter hor (1994)). The origin of shocked molecular hydrogen emission from the spatially unresolved region close to the star can originate from outflows or from accretion shocks in a disk, as in the case of Infrared Companions (IRC’s) (Herbst et al. her95 (1995), Koresko et al. kor (1997)). RNO 91()is one of the only two known PMS stars in the L43 dark cloud in Ophiuchus. It was classified as a M0.5 type T Tauri star by Leverault (lev (1988)), based on an optical spectrum that showed strong H emission. An outflow driven by this star was identified at millimeter wavelengths and shown to have spatially separated red-shifted and blue-shifted lobes (Leverault lev (1988), Myers et al. myr (1987), Bence et al. ben (1998)). However, optical images and spectra obtained by Schild et al. (sch (1989)) showed that the outflow does not have any emission indicative of shocked material around RNO 91. Optical and infrared photometry (U-band to L-band) was obtained by Myers et al.(myr (1987)). Heyer et al. (heyr (1990)) obtained the JHK photometry and H-band polarimetry of this object which showed a disk type structure for the first time. Weintraub et al. (wein (1994), hereafter, W94) demonstrated by their K-band polarimetric image and 3-5 m spectra that RNO 91 is surrounded by a disk-like structure of radius 1700 AU comprising frozen H2O, CO and possibly XCN. They also showed that the polarization center does not coincide with the intensity peak identified as RNO 91. Our speculation that this result indicates an IRC to RNO 91 was quickly laid to rest by the Shift and Add imaging by Aspin et al. (asp (1997)) (hereafter A97), which does not show any secondary source within a 3.7 square region. In this paper we present near-infrared spectra and narrow band images of the object in the K band region. We also report the detection of the H2 = 1-0 S(1) line at the source and discuss its implications.
2 Observations and Data Reduction
Near infrared spectroscopic observations were made on March 25, 1998 at Gurushikhar 1.2 m Infrared Telescope (GIRT), Mt. Abu, India. A Near Infrared Camera / Grating Spectrometer based on a HgCdTe focal plane array was used to obtain the observations. The grating spectrometer was used in a configuration that yielded a resolving power of = 1000 with a 1/pixel plate scale. The slit was two pixels wide and oriented along the N-S axis. The atmospheric seeing and image motions were below during the observations, which was measured from imaging data obtained just before the spectroscopic observations. Data acquisition and reduction were done using standard procedures. We used the RNO 91 K band photometric fluxes (0.48 Jy) given by Myers et al. (myr (1987)) for flux calibrating the spectrum.
Narrow band (m) images through H2 (m), Br(m) and continuum (m) filters were obtained by the United Kingdom Infrared Telescope (UKIRT) Service Observing Program on September 8, 1998 using the facility near-IR imager IRCAM3. IRCAM3 employs a InSb array; the optics used gives a pixel scale of 0.280″. There was a small defocusing problem that occurred during these observations due to variable seeing, resulting in image elongation in the N-E, S-W direction. These uncertainties were estimated to be about 1.2. Continuum subtraction was not carried out because of the focusing problems in these images. It should also be noted that there is some ghosting that had occurred in these images. These are identified as ghost images since they occur at exactly the same position with respect to the main source both in object and standard star frames.
3 Results
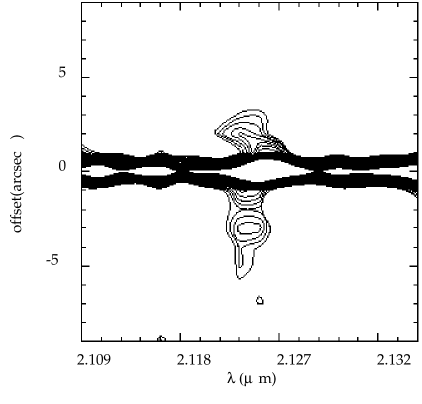
The contour map of the spectrum shown in figure 1 displays the extended H2 emission along the N-S direction (the slit axis) corresponding to the outflow axis. The intensity peaks at -3 and +2 represent H2 knots in the outflow. From gaussian fits to the continuum emission profile at different positions along the dispersion axis, we find that the FWHM of the continuum strip (measured N-S) is about 3.0, although the seeing on the night of observation was between 1.5-2.0. The extra width in the stellar continuum strip could be attributed to scattered light from the cocoon surrounding the star. We have therefore extracted the source spectrum by integrating the emission along three and then five rows, representing an on-source area of and . The relative intensities of the photospheric NaI and CaI features remained the same in these two extractions. However, in the -wide extraction, the 2.122m line intensity was considerably smaller relative to the photospheric features. This result confirms that the broadening of the continuum strip is indeed due to scattered star light.

Figure 2 shows the spectrum of RNO 91 in the wavelength region m to m. The spectrum is obtained by integrating nine rows, covering 9 along the N-S slit axis centered around the star. The spectrum displays prominently the H2 =1-0 S(1)line at m and the photospheric NaI and CaI absorption features at m and m respectively. The 2-1 S(1) line at 2.247m is below the noise level. The spectrum also displays the Br emission line at 2.167m. These features are marked in the figure. Most of the other features seen in absorption are telluric in nature (Chelli et al. chel (1997)).
The excitation mechanism for H2 emission can be inferred from the 2-1 S(1)/1-0 S(1) flux ratio (e.g. Luhman et al. luhm (1998)). An estimated upper limit to the 2-1 S(1) line flux yields this ratio to be 0.16 or less, pointing strongly towards shock excitation. However, flourescent excitation in a high density regime may also produce a “shock-like” 2-1 S(1)/1-0 S(1) ratio, because of thermalisation of low-energy vibrational levels (Sternberg & Dalgarno ster (1989), Burton et al. bur90 (1990)). In a high density region one would still expect to see emission from the =3 level at 10% of the 1-0 S(1) line (rather than 1%, as is expected in a shock; see e.g. Luhman et al. luhm (1998)). However, in our spectrum the 3-2 S(3) line is unresolved from NaI absorption, and the 3-2 S(1) line is outside the wavelength range.
We resolve this issue by estimating the two most crucial parameters that decide the efficiency of the UV fluorescence, namely, the gas number density and the UV flux scaling parameter (see Sternberg and Dalgarno ster (1989)). We estimate an upper limit for the gas number density to be cm-3, considering an A 9 (Myers et al. myr (1987)), an outer disk radius of 1700AU (W94), and an inner disk radius of 0.01AU corresponding to the dust evaporating radius for an M0 star. Note that this density is for a gas disk of 1700AU and the actual regions from where we expect the H2 emission are well below a radius of 200-300AU. On the other hand, the UV flux scaling parameter for an M0 type star is much less than 1. From these, the UV fluorescence is expected to be of little significance for the excitation of H2 lines.

Figure 3 shows a narrow band image through H2 filter, without continuum subtraction. The disk structure and an outflow lobe in the south can be seen clearly. These structures are more evident in this narrow band image, than in the earlier K′ image of Hoddap (hod (1994)) or the polarimetric image of W94. W94 had shown the existence of frozen H2O, CO and possibly XCN in a disk structure of radius 1700AU around RNO 91. The existence of these ices on grains within this disk structure was proven by the absorption features found in a m spectra. Their K-band polarimetric map also conforms with models of scattering from disks (Whitney & Hartmann whit (1992)). W94 suggest a scenario with a flared disk viewed at an angle of with the northern outflow lobe tilted away from the observer. The narrow band image shown in figure 3 (note specifically the patch of continuum emission to the south of RNO 91) clearly support this scenario. In addition, it can be seen from fig 1 that the H2 emission is extended more in the southern direction than in the northern direction which also confirms the tilt of the outflow axis, the northern lobe of the outflow being obscured near the source by the disk structure.
4 Discussion
From the spectrum we measure an H2 flux of 7 ergs sec-2 cm-2 (integrated over 3 rows, representing an area on-source of ). If we attribute this flux to shocks, we can estimate the mass flow rate using the relation
| (1) |
where is the ratio of the total energy in the shock to the strength of the 1-0 S(1) line, is the observed H2 line luminosity, and the shock velocity. We adopt a value for of 30 km s-1, a value that is optimum for producing H2 line emission. We also assume that (Smith smth (1995)). Together, these yield an estimate for mass flux of M⊙ yr-1.
As demonstrated in the previous section, the relative change in the intensity of H2 from that of the photospheric features in the spectra extracted with different widths of the continuum strip shows that the H2 emission close to the star likely originates from a region different to that traced by the photospheric lines. The fact that the H2 line emission is extended along our N-S slit strongly suggests that the H2 is associated with an outflow. By observing line emission coincident with the RNO 91 stellar continuum, we may therefore be tracing the outflow all the way back to the source. The total flux measured from the observed extended emission (integrated over 9 rows representing an area on-source of ) is 1.5 ergs sec-2 cm-2. This represents an average flux distribution of 3.5 ergs sec-2 cm-2sr-2. Assuming (Davis & Eislöffel dave (1995)), the extinction corrected S(1) line flux yields a net H2 luminosity of 0.002L⊙. Using the estimated value of and the kinematic age of the outflow, the H2 luminosity can be shown to represent a net warm H2 mass of M⊙, where, a long flow with a velocity of 30 km s-1 is used to calculate the age of the outflow.
The H2 line flux measured from within the central 3 could be associated with the near-IR counterparts of HH knots embedded within the cocoon that are excited by the outflow and accretion shocks in a disk. However, excitation of all of the observed “on-source” H2 emission due to infall is not feasible, since the mass accretion rates derived from such infall will produce a K-band extinction (Herbst et al. her95 (1995)) that is an order of magnitude higher than the measured value by Myers et al. (myr (1987)). But some fraction of the observed emission could originate from accretion shocks, with the rest from the outflow, as in the case of T Tauri. It is interesting to note that the high resolution images obtained via Shift and Add imaging at UKIRT by A97 reveal a nebulous feature which is about north of the star. This could be a shock excited feature in the outflow. Alternatively, this feature – in conjunction with the fainter features to the S-W of the star – appears to be part of an ellipse whose major axis is 200AU as measured by us using the published images of A97. In fact these features may be visualized in terms of a disk tilted by 30 to the north. The absence of any feature to the south may be attributed to the obscuration of the disk by the outflow. These arguments support the W94 data and their model, as do our narrow band images shown in Figure 3.
While gas and dust disks are known to exist around PMS stars (Beckwith et al. beck90 (1990), Dutrey et al. dut (1994)), there exists a small sample of objects with disk structures that contain icy mantles where ices are found on dust particles in the protostellar envelopes (see Chiar et al. chiar (1998) and references therein). RNO 91 possesses by far the largest icy gas/dust disk structure (20″) and also shows shocked H2 originating in an outflow and possibly an accretion disk. These features make RNO 91 unique and an interesting object for further studies in millimeter and infrared wavelengths.
5 Conclusions
An infrared spectrum of RNO 91 shows emission of shocked molecular hydrogen from an outflow in the N-S direction and from a spatially unresolved region close to RNO 91. We estimate a mass flow rate of M⊙ yr-1, based on the line fluxes from this spatially unresolved region around RNO 91. The line fluxes from the spatially extended outflow yield L⊙ representing net warm H2 mass of M⊙. The outflow seen here in H2 emission, extending roughly N-S, appears to support the tilted disk outflow model of W94, where the northern flow lobe is tilted away from us at an angle of to the plane of the sky. Our narrow band images also support this scenario. We suggest that the H2 flux from the spatially unresolved region around the source could originate in “HH-type” knots embedded in the cocoon surrounding the star. However, accretion shocks cannot entirely be ruled out based on our observations. We argue that RNO 91 is a unique disk/outflow system.
Acknowledgements.
This work is supported by the Department of Space, Government of India. The United Kingdom Infrared Telescope is operated by the Joint Astronomy Centre on behalf of the U.K. Particle Physics and Astronomy Research Council. The Imaging data reported here were obtained as part of the UKIRT Service Programme (obtained for us by Antonio Chrysostomou).References
- (1) Aspin, C., Puxley, P. J., Hawarden, T. G., Paterson, M. J., & Pickup, D. A., 1997, MNRAS, 284, 257 (A97)
- (2) Beckwith, S. V. W., Gatley, I., Matthews, K., & Neugebauer, G., 1978, ApJ, 223, L41
- (3) Beckwith, S. V. W., Sargent, A. I., Chini, R. S., & Gusten, R., 1990, 99, 924
- (4) Bence, S. J., Padman, R., Isaak, K. G., Wiedner, M. C., & Wright, G. S., 1998, MNRAS, 299, 965
- (5) Burton M.G., 1992, Aust. J. Phys., 45, 463
- (6) Burton M.G., Hollenbach D.J., Tielens A.G.G.M., 1990, ApJ, 365, 620
- (7) Chelli, A., Cruz-Gonzalez, I., Salas, L., Ruiz, E., Carrasco, L., & Recillas, E., 1997, in eds. Malbet, F., & Castets, A., Low Mass Star Formation - From Infall to Outflow, poster proceedings of IAU Symp. No. 182.
- (8) Chiar, J. E., Gerakines, P. A., Whittet, D. C. B., Pendleton, Y. J., Tielens, A. G. G. M., Adamson, A. J., & Boogert, A. C. A., 1998, ApJ, 498, 716
- (9) Davis, C. J., & Eisloffel, J., 1995, A & A, 300, 851
- (10) Dyck, H. M., Simon, T., & Zuckerman, B., 1982, ApJ, 255, L103
- (11) Dutrey, A., Guilloteau, S., & Simon, M. 1994, A & A, 286, 149
- (12) Herbst, T. M., Koresko, C. D., Leinert, C. 1995, ApJ, 444, L93
- (13) Herbst, T. M., Beckwith, S. V. W., Glindemann, A., Tacconi-Garman, L. E., Kroker, H., & Krabbe, A. 1996, AJ, 111, 2403
- (14) Heyer, M. H., Ladd, E. F., Myers, P. C., & Campbell, B., 1990, AJ, 99, 1585
- (15) Hodapp, K. W., 1994, ApJSS, 94, 615
- (16) Hora J.L., Latter, W.B., 1994, ApJ, 437, 281
- (17) Koresko, C. D., Herbst, T. M., & Leinert, Ch., 1997, ApJ, 480, 741
- (18) Leverault, R. M., 1988, ApJ, 330, 897
- (19) Luhman K.L., Engelbracht C.W., Luhman, M.L., 1998, ApJ, 499, 799
- (20) Myers, P. C., Fuller, G. A., Mathieu, R. D., Beichman, C. A., Benson, P. J., Schild, R. E., & Emerson, J. P., 1987, ApJ, 319, 340
- (21) Myers, P. C., Heyer, M., Snell, R. L., & Goldsmith, P. F 1988, ApJ, 324, 907
- (22) Schild, R., Nicholas, W., & Mathieu, R. D., 1989, AJ, 97, 1110
- (23) Shull, J. M., & Beckwith, S., 1982, ARA&A, 20, 163
- (24) Smith, M. D. 1995, A & A, 296, 789
- (25) Sternberg, A., Dalgarno A., 1989, ApJ, 338, 197
- (26) Weintraub, D. A., Tegler, S. C., Kastner, J. H., & Rettig, T., 1994, ApJ , 423, 674 (W94)
- (27) Whitney, B. & Hartmann, L. 1992, ApJ, 395, 529