The Fossil Starburst in M82††thanks: Based on observations with the NASA/ESA Hubble Space Telescope, obtained at the Space Telescope Science Institute, which is operated by the Association of Universities for Research in Astronomy (AURA), Inc., under NASA contract NAS 5-26555.
Abstract
We present high-resolution optical and near-infrared HST
observations of two adjacent regions in the fossil starburst region in
M82, M82 B1 and B2. The presence of both the active and the fossil
starburst in M82 provides a unique physical environment to study the
stellar and dynamical evolution of star cluster systems.
The cluster population in B2 is more heavily affected by internal
extinction than that in B1, amounting to an excess extinction in B2 of
mag. Preliminary age estimates
date the cluster population in the fossil starburst between and years. The radial luminosity profiles of
the brightest clusters are more closely approximated by power laws than
by a Gaussian model, in particular in their wings, which favors a slow
star formation scenario.
keywords:
galaxies: evolution, galaxies: individual (M82), galaxies: photometry, galaxies: starburst, galaxies: star clusters, galaxies: stellar content1 M82, the prototypical starburst galaxy
Observations at all wavelengths from radio to X-rays are consistent with a scenario that tidal interactions between M82 and another member galaxy of the M81 group has channeled large amounts of gas into the central regions of M82 during the last several 100 Myr (e.g., Telesco 1988, Rieke et al. 1993). This has induced a starburst which has continued for up to about 50 Myr. All of the bright radio and infrared sources associated with the active starburst are confined to the galaxy’s center, lying within a radius of pc, and corresponding spatially with bright optical structures, labeled M82 A, C, and E in O’Connell & Mangano (1978, OM78).
However, evidence exists that this is not the only major starburst episode to have occurred in M82. A region at about 1 kpc NE from the galactic center, M82 B (cf. OM78), has exactly the properties one would predict for a fossil starburst with a similar amplitude to the active burst. Marcum & O’Connell (1996) find a sharp main-sequence cut-off of the composite stellar system in M82 B, corresponding to an age of 100–200 Myr and an average extinction of mag. Region A, on the other hand, is only consistent with a very young population ( Myr) and is more heavily affected by extinction ( mag). By extrapolating region B’s surface brightness ( mag arcsec-2 [OM78], after correction for foreground extinction) back to an age of 10 Myr we estimate that its surface brightness was magnitudes brighter (cf. the Bruzual & Charlot [1996, BC96] stellar population models), similar to that presently observed in the active starburst.
HST imaging of the bright central regions of M82 resolved these into a swarm of young star cluster candidates, with a FWHM of pc () and mean (O’Connell et al. 1994, 1995), brighter than any globular cluster in the Local Group.
This is the nearest rich system of such objects; such “super star clusters” have also been discovered with HST in other interacting and amorphous systems, and in dwarf and starburst galaxies (e.g., Holtzman et al. 1992, Whitmore et al. 1993, O’Connell et al. 1994, Conti et al. 1996, Ho 1997, Carlson et al. 1998, Watson et al. 1998, among others). Their diameters, luminosities, and – in several cases – masses are consistent with these being young globular clusters formed as a result of recent gas flows (e.g., van den Bergh 1995, Meurer 1995, Ho & Filippenko 1996). It is possible that most of the star formation in starbursts takes place in the form of such concentrated clusters. Our observations of M82 do not reveal similar cluster formation outside the active and the fossil starburst regions.
Under the assumption that region B is indeed a fossil starburst site, it is expected that it originally contained a complement of luminous clusters similar to that now observed in region A. The combination of observations of both the active and the fossil starburst sites in M82 therefore provides a unique physical environment for the study of the stellar and dynamical evolution of these star cluster systems.
2 HST observations of the M82 central region
The fossil starburst region, M82 B, was observed on September 15, 1997, with both WFPC2 and NICMOS on board the HST. We imaged two adjacent square fields (Planetary Camera [PC] field of view, pix-1) in the M82 B region in the F439W, F555W and F814W passbands, with total integration times of 4400s, 2500s and 2200s, respectively, for region “B1”, and 4100s, 3100s and 2200s, respectively, for region “B2”. These observations were obtained using four exposures per filter, covering a large range in integration times to facilitate the removal of cosmic ray events. The F439W, F555W and F814W filters have roughly similar characteristics to the Johnson-Cousins broad-band B, V and I filters, respectively.
In the near-infrared (NIR) we chose to use NICMOS Camera-2 ( pix-1), which provided the best compromise of resolution and field of view. We acquired 4 partially spatially overlapping exposures in both the F110W and F160W filters (approximately similar to the Bessell J and H filters, respectively) in a tiled pattern; the integrations, of 512s each, were taken in MULTIACCUM mode to preserve dynamic range and to correct for cosmic rays.
3 Selection procedure
3.1 Selection of real sources in a highly disturbed area
Unfortunately, the separation of real sources from artefacts in M82 B is problematic, due to significant small-scale variations in the amplitude of the background emission, which are largely caused by the highly variable extinction. For this reason, we cannot use standard unsharp masking techniques to remove this background, since this produces significant residual emission along the dust features.
An initial visual examination of the multi-passband observations revealed a multitude of faint point sources that become increasingly obvious with increasing wavelength. To include in our source selection a maximum number of real and a minimum amount of spurious sources (due to, e.g., dust features, weak cosmic rays, or poisson noise in regions of high surface brightness or at the CCD edges), we decided to cross correlate source lists obtained in individual passbands. We performed extensive checks to find the best selection criterions and thus to minimize the effects introduced by artefacts on the one hand and the exclusion of either very red or very blue sources on the other.
We chose our detection thresholds such that the number of candidate sources selected from the images in all passbands were comparable, of order 4000. Then, we cross correlated the source lists obtained in the individual passbands. Finally, we determined which combination of passbands resulted in the optimal matching of sources detected in both the blue and the NIR passbands. This source selection procedure lead us to conclude that a final source list obtained from the cross correlation of the candidate sources detected in the F555W and F814W filters would contain the most representative fraction of the M82 B-region source population.
However, an initial visual examination of the cross-correlated V and I-band sources showed that the automated detection routine had returned non-detections as well as artefacts that were clearly associated with dust features. It also showed that the quality of the resulting sources for photometric follow-up was highly variable. Therefore, we decided to check the reality of all cross-correlated sources by examining them visually, in both passbands, at the same time classifying them in terms of contrast, sharpness, and the presence of nearby neighbors. Moreover, we added (and verified) the 30% of the sources in each field that were missed by the automated detection routine, but were clearly real sources, and were recognized as such by the visual examination of both the V and the I-band images.
The final source lists thus obtained contain 737 and 642 verified sources in M82 B1 and B2, respectively.
3.2 Synthetic and observed star fields as control fields
We estimated the completeness of our object list by randomly and uniformly adding 500 synthetic point sources of input magnitudes between 20.0 and 25.0 mag to the observed images in both the F555W and the F814W filters. The PSFs of the synthetic point sources were obtained from observational PSFs, and scaled to the desired magnitudes. The effects of crowding in our simulated star fields are small: only 1–2% of the simulated objects were not retrieved due to crowding or overlap of adjacent sources.
For the uniformly distributed simulated sources, we established the 50% completeness limits at F555W and 23.3 mag (for B1 and B2, respectively) and at F814W mag.
In addition to these synthetic star fields, we used our Cen HST observations in the F555W passband, obtained as part of program 6053 (PI O’Connell, Cycle 5), to verify the reduction procedures and the accuracy of our photometry.
3.3 Separating star clusters from stars
We based the distinction between stars and more extended sources in the M82 B fields on the statistical differences between the size characteristics of the populations of real sources in these fields and those of the stars in the Cen control field. To do so, we added a scaled version of the Cen field to the M82 B fields, such that the output magnitudes of the majority of the Cen stars were in the same magnitude range as those of the M82 B sources, in the latter reference frame.
We determined characteristic sizes of both our M82 B verified sources and the Cen stars, using a Gaussian fitting routine. Although the true luminosity profiles of the star clusters in M82 B may differ from Gaussians (Sect. 5), this method allows us to distinguish between compact and extended sources. A comparison between the distribution of characteristic stellar sizes from the globular cluster field with those of the verified sources in M82 B revealed that the population of extended sources in M82 B is well-represented by sources with pixels. Therefore, in the following we will consider those sources with and V-band magnitude brighter than the 50% completeness limit to be part of our verified cluster samples. They contain 128 and 218 cluster candidates in B1 and B2, respectively.
4 Stellar population synthesis: tracing the evolution
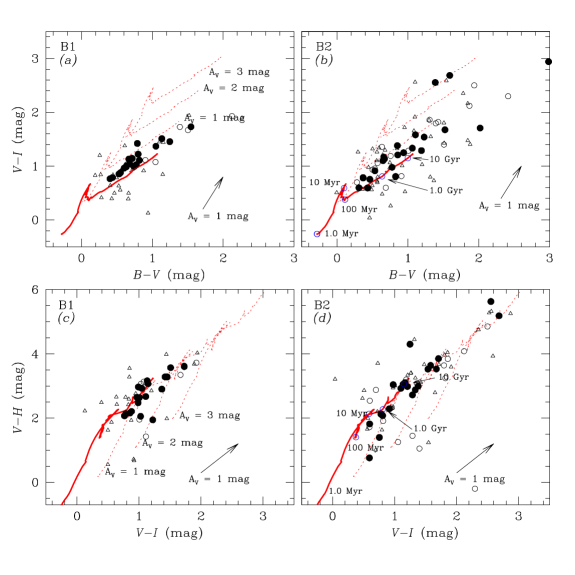
A close examination of the color distributions in both fields reveals that the cluster population in B2 displays a peak at redder colors, whereas the dispersion in colors is larger than in the B1 region, in particular on the redward side. Both these observations hint at a more heavily obscured globular cluster population in B2. Under the assumption that the candidate cluster populations in B1 and B2 are coeval, which is likely if they originated in the same starburst, the differences between their color distributions can entirely be attributed to extinction effects, amounting to an excess extinction in B2 of mag.
Their color-magnitude diagrams (CMDs) reveal that the brightest young cluster candidates have approximately identical colors and magnitudes in either region: mag, and ; this indicates that these are mainly unaffected by extinction.
We take as tentative color limits for the determination of the intrinsic age spread in the M82 B cluster population and . The limits on the blue side are set by the colors of the bluest cluster candidates; the red limits are the colors of the brightest (supposedly unobscured) clusters in either field, since from this color range, most cluster colors can be achieved with up to 2(–3) magnitudes of visual extinction, which is not an unreasonably large amount, considering the highly variable extinction features seen in the images. Employing the BC96 initial burst models yields ages between and yr, assuming solar metallicity. From the optical–near-infrared color-color diagrams shown in Fig. 1, we derive a lower limit to the allowed age range for the bulk of the cluster population of 200–300 Myr, entirely consistent with the age estimates obtained from the optical CMDs.
5 Cluster luminosity profiles in close-up

In Fig. 2 we present the light profiles of the five brightest star cluster candidates in each field. These objects have sufficient S/N ratios and are relatively isolated, thus enabling us to follow the light profiles out to reasonably large radii.
Several cluster radial luminosity functions have recently been used in the literature, the simplest of them being a two-dimensional Gaussian. Alternatively, more complex models have been used, that are better representations of the true stellar light distribution in globular clusters. The most general of these is the mathematically convenient function of surface brightness as a function of radius r, proposed by Elson et al. (1987):
| (1) |
which reduces to a modified Hubble law for . In fact, Elson et al. (1987) found, for 10 rich star clusters in the LMC, that , with a median .
From these figures, it is obvious that even though all three fitting functions may represent the inner profiles relatively well, the discrepancy between the results in the outer parts is a strong argument in favor of the more extended modified Hubble or (“Elson”) profiles.
Elson et al. (1987) try to explain the approximate power-law behavior of the LMC cluster profiles at large radii in terms of different star formation time scales. They argue that the observations probably favor slow star formation. Under these circumstances and by assuming a high star formation efficiency, relaxation of a sufficiently clumpy gaseous protocluster through clump-clump or clump-star two-body encounters may produce the observed power-law luminosity profiles.
Some of the star clusters show evidence for asymmetrical structure, which may mean that they contain subclumps, or have not yet reached dynamical equilibrium. A visual inspection of these clusters shows that they are noticeably elongated. In the case of these clusters in particular, we may be witnessing ongoing merging processes. However, to strengthen this suggestion, we will need spectroscopic follow-up observations. Similar subclustering has been observed in the super star clusters in NGC 1569 (O’Connell et al. 1994) and some of the rich LMC star clusters (e.g., Fischer et al. 1993).
References
- [] Bruzual, G., Charlot, S., 1996, in: Leitherer, C., Alloin, D., Fritze-von Alvensleben, U., et al., 1996, PASP 108, 996
- [] Carlson, M.N., Holtzman, J.A., Watson, A.M., et al., 1998, AJ 115, 1778
- [] Conti, P.S., Leitherer, C., Vacca, W.D., 1996, ApJ 461, L87
- [] Elson, R.A.W., Fall, S.M., Freeman, K.C., 1987, ApJ 323, 54
- [] Fischer, P., Welch, D.L., Mateo, M., 1993, AJ 105, 938
- [] Ho, L.C., 1997, in: Starburst Activity in Galaxies, eds. Franco, J., Terlevich, R., Tenorio-Tagle, G., Rev. Mex. A. A. Conf. Series, Vol. 6, Mexico City: IAUNAM, p. 5
- [] Ho, L.C., Filippenko, A.V., 1996, ApJ 472, 600
- [] Holtzman, J.A., Faber, S.M., Shaya, E.J., et al., 1992, AJ 103, 691
- [] Marcum, P., O’Connell, R.W., 1996, in: From Stars to Galaxies: The Impact of Stellar Physics on Galaxy Evolution, eds. Leitherer, C., Fritze-von Alvensleben, U., Huchra, J., San Francisco: ASP, p. 419
- [] Meurer, G.R., 1995, Nat 375, 742
- [] O’Connell, R.W., Gallagher, J.S., Hunter, D.A., 1994, ApJ 433, 65
- [] O’Connell, R.W., Gallagher, J.S., Hunter, D.A., Colley, W.N., 1995, ApJ 446, L1
- [] O’Connell, R.W., Mangano, J.J., 1978, ApJ 221, 62
- [] Rieke, G.H., Loken, K., Rieke, M.J., Tamblyn, P., 1993, ApJ 412, 99
- [] Telesco, C.M., 1988, ARA&A 26, 343
- [] van den Bergh, S., 1995, Nat. 374, 215
- [] Watson, A.M., Gallagher, J.S., Holtzman, J.A., et al., 1996, AJ 112, 534
- [] Whitmore, B.C., Schweizer, F., Leitherer, C., Borne, K., Robert, C., 1993, AJ 106, 1354