e-mail: holland@obs.aau.dk 22institutetext: Astronomical Observatory, University of Copenhagen, Juliane Maries Vej 30, DK-2100 Copenhagen Ø, Denmark
e-mail: jens@astro.ku.dk
Star-Forming Regions near GRB 990123††thanks: Based on observations with the NASA/ESA Hubble Space Telescope, obtained at the Space Telescope Science Institute, which is operated by the Association of Universities for Research in Astronomy, Inc., under NASA contract NAS5-26555.
Abstract
We reduced the Hubble Space Telescope Space Telescope Imaging Spectrograph images of the gamma-ray burst GRB 990123 that were obtained on 8–9 February 1999 and find , which corresponds to a flux of Jy for the optical transient 16.644 days after the burst’s peak. The probable host galaxy has ( Jy) and the optical transient is located ( kpc) south of the galaxy’s nucleus. We fit and subtracted a scaled point-spread function to the optical transient and found evidence for three bright knots situated within ( kpc) of the optical transient. Each knot has , a rest-frame -band luminosity of –, and a star-formation rate of at least – yr-1. The knots are centrally concentrated with full-width at half-maximum of ( kpc). Their sizes and luminosities are consistent with their being star-forming regions. The optical transient is located ( kpc) southeast of the centre of one of these knots.
Key Words.:
Gamma rays: bursts – Galaxies: starburst1 Introduction
On 23 January 1999 BeppoSAX detected GRB 990123, one of the strongest recorded gamma-ray bursts (GRBs) (Heise H99 (1999); Piro P99 (1999)). The optical transient (OT) associated with this GRB reached a peak magnitude of (Akerlof & McKay AM99 (1999)) only 47 seconds after the initial detection. Spectroscopic observations with the Nordic Optical Telescope (Hjorth et al. HA99 (1999); Andersen et al. AC99 (1999)), and the Keck Telescope (Kelson et al. KI99 (1999); Kulkarni et al. KD99 (1999)), showed strong metallic absorption lines with redshifts of , suggesting that the OT is located either in, or behind, an absorbing system at . Andersen et al. (AC99 (1999)) placed an upper limit of on the redshift of based on ultraviolet photometry and the absence of Lyman- forest lines. For a Friedman cosmology with km s-1, , and a redshift of corresponds to Mpc and a distance modulus of . This means that the OT reached a peak absolute -band magnitude of 111All magnitudes are in the rest frame of the observer, unless otherwise noted., which gives an intrinsic luminosity of , approximately times brighter than a Type I supernova. For an isotropic burst the implied energy release approached – erg, using BATSE fluence (Kippen K99 (1999)).
There are two broad families of models for GRBs, both of which are related to the end stages of the lives of massive stars, and both of which predict that GRBs should trace the star-formation rate in the Universe (e.g. Wijers et al. WB98 (1998)). The first family is the exploding object family, which includes the “failed supernova” model of Woosley (W93 (1993)) and the “hypernova” model of Paczyński (P98 (1998)). These models predict that the progenitors of GRBs are short-lived objects with low space velocities, so GRBs should be found within kpc of the star-forming regions where the progenitors formed. The second family of models is the binary progenitor family, which includes the binary neutron star (NS-NS) model of Narayan et al. (NP92 (1992)) and the merger of a black hole and a neutron star (BS-NS) model of Paczyński (P91 (1991)). These models predict that GRB progenitors will have high space velocities, due to two supernova explosions having occurred in the progenitor’s binary system, so the GRB could be found a significant distance from the star-forming region where the progenitor was formed. OTs have been associated with several GRBs, and most of these OTs have been located within of a faint galaxy. Redshifts have been measured for four of these candidate host galaxies and all are located at cosmological distances.
2 The Data
Hubble Space Telescope (HST) observations of the OT associated with GRB 990123 were made between 23:06:54 UT on 8 February 1999 and 03:21:43 UT on 9 February 1999 as part of the Cycle 8 proposal GO-8394 (Beckwith B99 (1999)) in order to identify the host galaxy and to study the region around the OT. These observations consisted of six 1300 second exposures taken with the Space Telescope Imaging Spectrograph (STIS) in its Clear Aperture (50CCD) mode. Each exposure was split into two 650 second sub-exposures to allow for the removal of cosmic rays. A six-position spiral dithering pattern, with offsets of pixels (), was used. The CCD gain was set to 1 /ADU, and the read-out noise was 4 /pixel. The data was processed through the standard STIS pipeline and immediately made available to the astronomical community.
Fruchter et al. (1999a ) reported a preliminary magnitude of for the OT based on the HST images. Bloom et al. (1999b ) used this data to derive magnitudes for the OT and for the purported host galaxy, and noted that there may be a small star-forming region to the north of the OT. Fruchter et al. (1999b ) also derived magnitudes for the OT and the host galaxy, and determined a decay rate for the flux from the OT which suggests that the light from the OT may have been beamed for the first days after the burst, and then made a transition to and isotropic expansion.
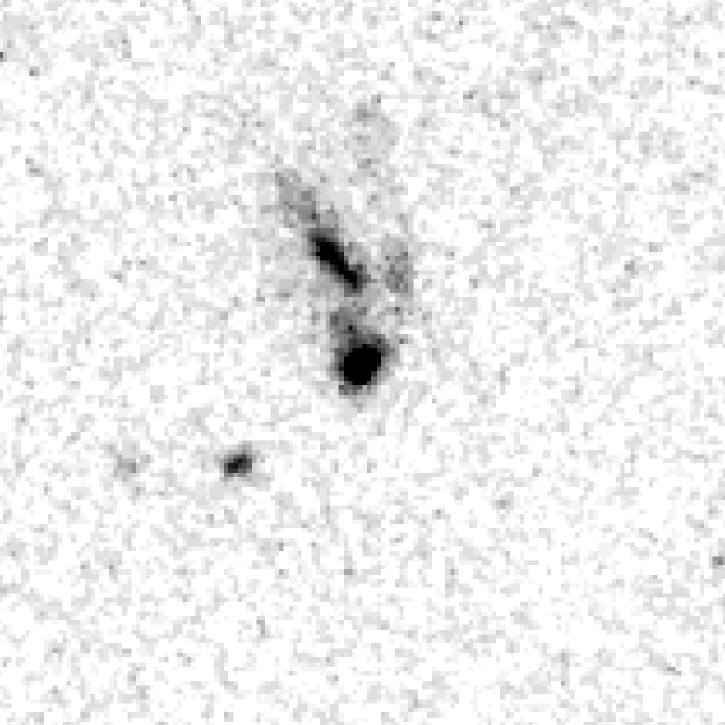
We combined the six STIS images using the Dither (v1.2) software (Fruchter & Hook FH99 (1999)) as implemented in IRAF222Image Reduction and Analysis Facility (IRAF), a software system distributed by the National Optical Astronomy Observatories (NOAO). (v2.11.1)/STSDAS (v2.0.2). A “pixfrac” value of 0.5 was used, and the final output image had a scale of /pixel. Fig. 1 shows the details of the OT and the probable host galaxy. We found the location of the OT to be (J2000 coordinates) based on the World Coordinate System information in the STIS image headers. We have taken the centroid of the bright elliptical object to the north of the OT (Bloom et al. [1999b ]’s object A) to be the nucleus of the host galaxy. It is located at . The OT is situated ( kpc) south of the nucleus of the host galaxy ( east of north).
3 The Magnitude of the Optical Transient
We estimated the total magnitude of the OT by performing aperture photometry with an aperture radius of . The local sky was measured in an annulus with an inner radius of and a width of . The photometry aperture and sky annulus were chosen to maximize the signal-to-noise from the OT and to minimize the contamination from the host galaxy and the nebulosity seen near the OT. The integrated magnitude depends slightly ( mag) on the sizes of the aperture and sky annulus since the OT is situated near several bright knots in the outer regions of the host galaxy. No aperture correction was applied since the uncertainties in the background subtraction are larger than the aperture correction. The STIS Instrument Handbook gives a zero point in the system of for the 50CCD (clear) imaging mode, which corresponds to a zero-point flux of Jy. This zero point gives a calibrated magnitude for the OT of , which corresponds to a flux of Jy. We assume that the OT has a power-law spectrum of the form where (Bloom et al. 1999a ) and the zero-point flux for the STIS in its 50CCD (clear) imaging mode yields Jy. Fruchter et al. (1999b ) note that the STIS magnitude of an object with a power-law spectrum is largely independent of due to the symmetric shape of the 50CCD (clear) bandpass. We converted the magnitude to the Johnson -band and Kron-Cousins -band using this power-law spectrum and the photometric zero-points from Fukugita et al. (FS95 (1995)). The resulting calibration equations are and , where is the observed count rate in ADU/s on the drizzled image.
4 Star-Forming Regions Near GRB 990123
In order to examine the substructure near the OT we used DaoPhot II (Stetson S87 (1987)) to subtract the light from the OT. We constructed a point-spread function (PSF) using STIS CCD observations of a star field in the Galactic globular star cluster Omega Centaurus. These images were taken with the STIS in the 50CCD (clear) imaging mode as part of the Cycle 7 proposal 7079 and were combined and drizzled in exactly the same way that the images of GRB 990123 were (output scale /pixel, “pixfrac” ). Fig. 2 shows the STIS image of the region around the OT with the light from the OT subtracted.
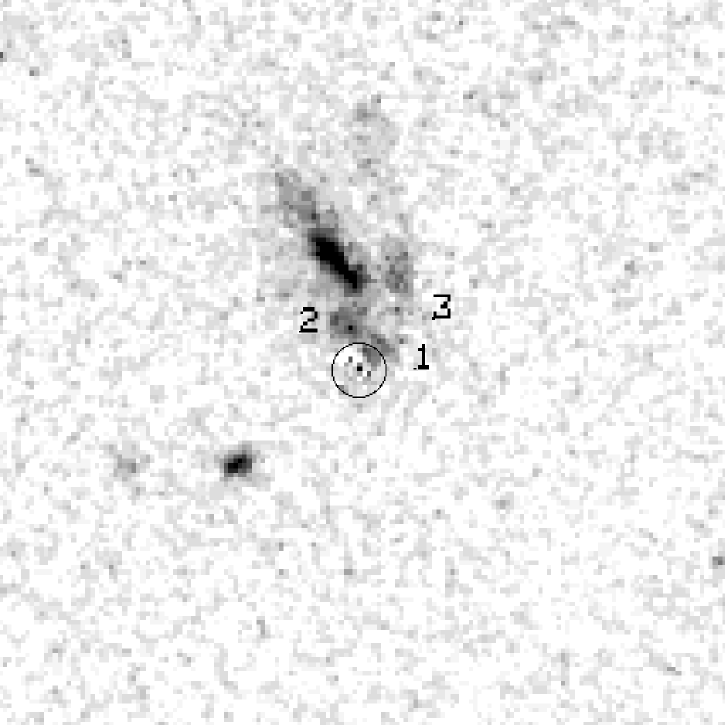
The host galaxy appears to be a large irregular galaxy with several non-axisymmetric components. The total magnitude of the galaxy (excluding the OT) is . Castro-Tirado et al. (CT99 (1999)) find a flat spectrum () consistent with a starburst galaxy. Adopting this spectrum, and assuming no internal reddening in the galaxy, we find and for the host galaxy, corresponding to fluxes of Jy and Jy respectively. The total luminosity is . There is a large amount of unresolved light around the galaxy, and an arc-like feature can be seen ( kpc) west of the nucleus. This structure is ( kpc) long and ( kpc) wide with a bright knot (#3 A1 [Bloom et al. 1999b ]) at its southern end. Two more small knots can be seen to the north (#2 A2 [Bloom et al. 1999b ]) and northwest of the OT (#1). The locations, and distances from the OT, for these knots are listed in Table 1. The final column gives the Bloom et al. (1999b ) identifications. The magnitudes, fluxes, and rest-frame -band luminosities for each knot are listed in Table 2. The uncertainties in the magnitudes and fluxes are mag and nJy respectively. The uncertainties in the total luminosities are .
| Knot | (kpc) | ID | |||
|---|---|---|---|---|---|
| 1 | 15:25:30.30 | 44:45:59.2 | 1.3 | ||
| 2 | 15:25:30.31 | 44:45:59.3 | 2.2 | A2 | |
| 3 | 15:25:30.28 | 44:45:59.5 | 4.1 | A1 |
| Knot | nJy | nJy | SFR | |||
|---|---|---|---|---|---|---|
| 1 | 28.3 | 17.2 | 28.1 | 17.4 | 0.09 | |
| 2 | 28.1 | 20.7 | 27.9 | 20.9 | 0.11 | |
| 3 | 28.0 | 22.7 | 27.8 | 22.9 | 0.12 |
The central regions of all three knots are well fit by the PSF, which suggests that the knots are centrally concentrated. The drizzled image has a resolution of /pixel ( kpc/pixel). Therefore, we conclude that most of the light is concentrated in the inner kpc of each knot. This is comparable with the sizes of star-forming regions and H II regions in the local Universe. The PSF does not, however, provide a good fit to the outer regions of the knots. There is excess light left in the images of each knot after the scaled PSFs have been subtracted. This suggests that the knots consist of dense, centrally concentrated cores embedded in extended structures. The apparent full-width at half-maximum (FWHM) of each knot is while the PSF has FWHM . Correcting the apparent knot diameters for the width of the PSF gives intrinsic FWHMs of ( kpc) for the knots. This is consistent with the knots containing embedded star-forming regions.
Knot #1 is partially covered by the OT and not clearly visible until the OT is subtracted. We believe that this knot is a real feature and not an artifact of the PSF subtraction since similar features are not seen when the PSF is used to subtract stars from the Omega Centaurus images. Fig. 2 shows no systematic change in intensity between the northeast half of the knot, which was not obscured by the OT, and the southwest half, which was obscured by the OT. This also suggests that the knot is not an artifact of the PSF subtraction. To test the ability of PSF subtraction to reveal structure under the OT we generated a series of artificial stars with the same magnitude as the OT. These stars were put on the three knots, and in empty parts of the image near the OT, then PSFs were fit and subtracted for each artificial star. We found that the knots were clearly visible after the artificial stars were removed, although the knots located under artificial stars appeared less centrally concentrated after the artificial stars were subtracted. Comparing the recovered magnitudes of the isolated artificial stars with those of the artificial stars situated on the knots suggests that we are able to detect knots with that are located under the OT.
The OT for GRB 990123 is located on the southeast edge of knot #1. This knot is the most likely source of the metallic absorption lines seen in the spectra of the OT (Andersen et al. AC99 (1999); Kulkarni et al. KD99 (1999)), although we can not rule out the possibility that the absorption lines are due to a very small, undetected, faint knot located under the OT. Such absorption systems are often associated with high column densities of hydrogen, which in turn are associated with star formation. We used Eq. 2 of Madau et al. (MP98 (1998)) to estimate the star-formation rate (SFR) in each of the knots listed in Table 1, assuming a flat () spectrum. For a rest-frame wavelength of Å corresponds to an observed wavelength of Å, so we computed the observed flux at Å by extrapolating between the - and -band fluxes. These were computed for each knot in the same manner as was done for the host galaxy (see Sect. 3). The estimated SFRs for each knot, assuming a Salpeter initial mass function, are listed in Table 2. For a Scalo initial mass function multiply the SFR by 1.55. The uncertainty in each SFR is yr-1. These SFRs assume that there is no dust, or obscured star formation, in the knots. This is probably a poor assumption if the knots are star-forming regions. Therefore, our derived SFRs should be considered a lower limit on the true SFR in each knot.
The OT is located at a projected distance of ( kpc) from the nucleus of the host galaxy. Bloom et al. (BS98 (1998)) calculated that % of the GRBs from NS-NS and BS-NS progenitors in galaxies with a shallow gravitational potential will occur within 5 kpc of the nucleus of the host galaxy and % will occur within 30 kpc. This is consistent with the location of the OT relative to the nucleus of the host galaxy. If the progenitor is a failed supernova, or a hypernova, then the OT should be located within a few hundred parsecs of the star-forming region (Paczyński P98 (1998)). The GRB 990123 OT is located at a projected distance of ( kpc) southeast of the centre of the nearest knot (#1), which is larger than the expected separation if the GRB was due to the explosion of a massive star, yet consistent with the NS-NS and BS-NS hypotheses. We wish to stress that this conclusion depends on there being no faint star-forming region directly under the OT. Further observations will be needed, after the OT has faded, to determine if there are other small star formation regions that are currently hidden by the OT.
Acknowledgements.
We would like to thank S. Beckwith of the Space Telescope Science Institute for making the HST/STIS observations of GRB 990123 available to the astronomical community. We would also like to thank H. Ferguson for his useful comments. S. H. is supported by the Danish Centre for Astrophysics with the HST. This work was supported by the Danish Natural Science Research Council.References
- (1) Akerlof, C. W., & McKay, T. A., 1999, GCN Circ. 205
- (2) Andersen, M. I., et al., 1999, Science, in press
- (3) Beckwith, S., 1999, GCN Circ. 254
- (4) Bloom, J. S., Sigurdsson, S. & Pols, O. R., 1998, MNRAS, in press (astro-ph/9805222)
- (5) Bloom, J. S., et al., 1999a, GCN Circ. 240
- (6) Bloom, J. S., et al., 1999b, ApJL, submitted (astro-ph/9902182)
- (7) Cardelli, J. A., Clayton, G. C., & Mathis, J. S., 1989, ApJ, 345, 245
- (8) Castro-Tirado, A. J., et al., 1999, Science, 283, in press
- (9) Fruchter, A. S., & Hook, R. N., 1999, PASP, submitted, (astro-ph/9808087)
- (10) Fruchter, A. S., Sahu, K., Ferguson, H., Livio, M., & Metzger, M., 1999a, GCN Circ. 255
- (11) Fruchter, A. S., et al., 1999b (astro-ph/9902236)
- (12) Fukugita, M., Shimasaku, K., & Ichikawa, T., 1995, PASP, 107, 945
- (13) Heise, J., et al. 1999, Nature, submitted
- (14) Hjorth, J., et al., 1999, GCN Circ. 219
- (15) Kelson, D. D., Illingworth, G. D., Franx, M., Magee, D., van Dokkum, P. G., 1999, IAUC 7096
- (16) Kippen, R. M., 1999, GCN Circ. 224
- (17) Kulkarni, S. R., et al. 1999, Nature, submitted (astro-ph/9902272)
- (18) Madau, P., Pozzetti, L., & Dickinson, M., 1998, ApJ, 498, 106
- (19) Narayan, R., Paczyński, B., & Piran, T., 1992, ApJ, 395, L83
- (20) Paczyński, B., 1991, Acta. Astron., 41, 257
- (21) Paczyński, B., 1998, ApJ, 494, L45
- (22) Piro, L., 1999, GCN Circ. 199
- (23) Rieke, G. H., & Lebofsky, M. J., 1985, ApJ, 288, 618
- (24) Schlegel, D. J., Finkbeiner, D. P., & Davis, M., 1998, ApJ, 500, 525
- (25) Stetson, P. B., 1987, PASP, 99, 191
- (26) Wijers, R. A. M. J., Bloom, J. S., Bagla, J. S., & Natarajan, P., 1998, MNRAS, 294, 113
- (27) Woosley, S. E., 1993, ApJ, 405, 273