Analysis of the sensor characteristics of the Galileo dust detector with collimated Jovian dust stream particles
H. Krüger, E. Grün, A. Heck, S. Lammers
Max-Planck-Institut für Kernphysik, Saupfercheckweg 1, 69117 Heidelberg, Germany
Abstract
The Dust Detector System onboard Galileo records dust impacts in the Jupiter system. Impact events are classified into four quality classes. Class 3 – our highest quality class – has always been noise-free and, therefore, contains only true dust impacts. Depending on the noise environment, class 2 are dust impacts or noise. Within from Jupiter (Jupiter radius, ) class 2 shows clear indications for contamination by noise. We analyse the dust data from Galileo’s prime Jupiter mission (1996 and 1997), separate dust impacts from noise events and derive a complete denoised set of Galileo dust data (class 2 and class 3). Collimated streams of nanometer-sized dust particles which have been detected throughout the Jovian system (Grün et al. 1998, JGR, 103, 20011-20022) are used to analyse the sensitive area and the field of view of the dust detector itself. The sensitive area for stream particles which trigger class 3 events is . This is almost a factor of ten smaller than the total sensitive area for class 2 impacts (). Correspondingly, the field of view of the detector for class 3 stream particles is reduced from to . The magnetometer boom and other instruments on board Galileo cause a significant shadowing of the field of view of the dust sensor. Our analysis is supplementary to ground calibrations of the dust instrument because the low masses and high speeds of the stream particles could not be achieved in the laboratory. Our new results have important consequences for the analysis of dust in the Jupiter system.
1 Introduction
On 7 December 1995 the Galileo spacecraft arrived at Jupiter and was deflected into a highly eccentric orbit about the planet. Galileo carries a dust impact ionization detector on board (Grün et al. 1992a). Dust particles which hit the sensor are recognized by up to three independent charge signals (Fig. 1). Impact events are classified into four quality classes and six ion charge () amplitude ranges (Grün et al. 1995a, hereafter Paper I, Krüger et al. 1998a) which lead to 24 individual categories. Each impact is counted by one of 24 accumulators. No indications for contamination by noise have ever been seen in class 3, our highest quality class. In interplanetary space, class 2 was also noise-free, whereas classes 1 and 0 contained noise events in their lowest ion amplitude ranges (Baguhl et al. 1993, Grün et al. 1995b,c, hereafter Papers II and III).
During Galileo’s passage through the high radiation environment in the inner Jovian magnetosphere on 7 December 1995, however, class 1 and class 2 showed indications for noise contamination (Krüger et al. 1998a, hereafter Paper IV): these events occurred at all sensor pointing directions. Data obtained later during Galileo’s orbital tour about Jupiter showed the same behaviour in the class 0, class 1 and class 2 events when Galileo was in the inner Jovian system, within about from Jupiter (Jupiter radius, ). In contrast to the behaviour of events in these lower classes, such a wide spread in impact direction was not seen for class 3. The noise events in the lower quality classes are probably caused by high energetic electrons in Jupiter’s magnetosphere.
Throughout the Jovian system Galileo has detected collimated streams of tiny dust particles (Grün et al. 1997, 1998). The behaviour of the impact direction of these particles shows significant differences depending upon whether they are recognized as class 2 or class 3 impacts. No such difference has ever been observed for particles measured with the Galileo and Ulysses dust sensors in interplanetary space. From the instrumental point of view the main difference between class 2 and class 3 is that class 3 events have three charge signals (electron, ion and channeltron signal) whereas only two charge signals are required for class 2 (Paper IV). Most of the class 2 impacts have no channeltron signal.
In this paper we investigate the noise in the class 2 data and derive a ’denoised’ data set which contains class 2 dust impacts together with class 3 impacts. Class 3 has always been noise-free. This complete data set of impacts from Galileo’s orbital tour about Jupiter is then used for an analysis of the field of view of the dust sensor itself.
2 Noise characterization
The Galileo spacecraft configuration is shown in Fig. 2. Galileo is a dual-spinning spacecraft and the rotation angle (ROT) measures the viewing direction of the dust detector (DDS) at the time of a dust particle impact. During one spin revolution of the spacecraft the rotation angle scans through a complete circle of . At rotation angles of and the sensor axis lies nearly in the ecliptic plane, and at it is closest to ecliptic north. DDS rotation angles are taken positive around the negative spin axis of the spacecraft. This is done to easily compare Galileo impact direction data with those taken by Ulysses which, unlike Galileo, has the opposite spin direction.
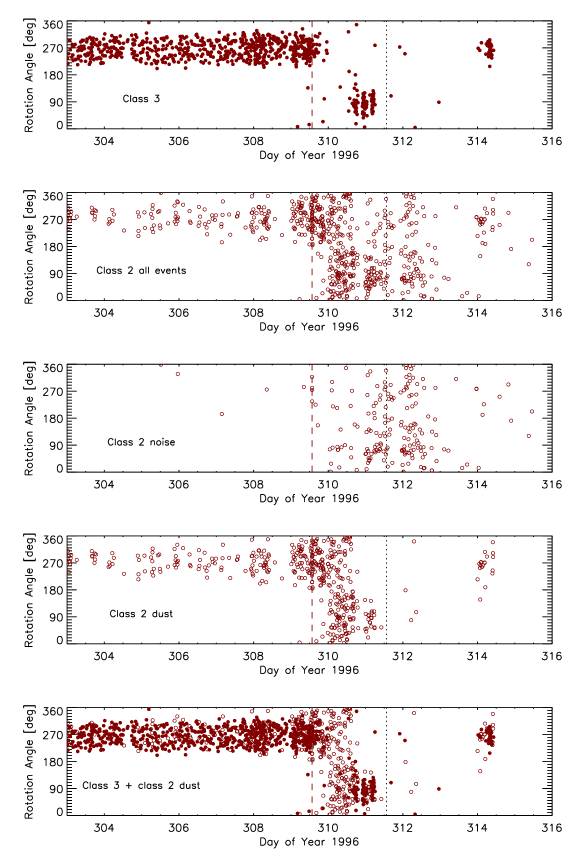
Figure 3 shows the rotation angle for class 2 and class 3 events detected in the lowest ion amplitude range for Galileo’s third orbit about Jupiter (C3). During this orbit Galileo had a close encounter with Callisto. During the other orbits of Galileo about Jupiter the rotation angle showed a very similar behaviour (Grün et al. 1998) and we use C3 as a typical example. The spacecraft trajectory for the C3 orbit is shown in Grün et al. (1998) and is not repeated here.
The upper panel in Fig. 3 shows class 3 dust impacts. When Galileo approached the inner Jovian system dust impacts were detected at a rotation angle of about (day 303 to 309). About a day after Callisto closest approach (day 309.57) the rotation angle shifted by and the dust particles were detected with rotation angles of (day 310 and 311). A few particles were again detected with rotation angles of on day 314. This behaviour of class 3 dust impacts has been discussed in detail by Grün et al. (1997, 1998). It can be explained by streams of nanometer-sized dust particles which are ejected from the inner Jovian system with very high velocities (about , Zook et al. 1996). Io has recently been identified as the probable source for these particles (Krüger et al. 1998b, A. Graps et al. in prep.).
In the second panel of Fig. 3 we show the class 2 events detected in the same time period. The number of class 2 events shown is apparently lower than the number of class 3 impacts. This, however, is an effect of the classification scheme used in the dust detector. The full information of class 3 events is preferentially transmitted to Earth. From the accumulator data we know that class 2 events are in reality more abundant than class 3 impacts.
During approach to the inner Jovian system the class 2 events were detected with rotation angles of which is identical with the behaviour of the class 3 impacts at this time (days 303 to 309). Right after the C3 encounter, however, the approach direction of the class 2 events widened and they were sensed with all rotation angles until day 313. This spread in rotation angle occurred in the inner Jovian system when Galileo was within about from Jupiter (days 310 to 313). The same occurred during all other passages of Galileo through the inner Jovian system, which are not shown here. In this time interval the rotation angle pattern of class 2 differs completely from that of class 3. We interpret this marked difference between events in both quality classes within from Jupiter as a clear indication for noise contamination in class 2 in this distance range. This is in contrast to the behaviour further away from Jupiter (days 303 to 309) where both classes show a very similar rotation angle pattern which indicates that here class 2 is very likely noise-free and contains mostly true dust impacts.
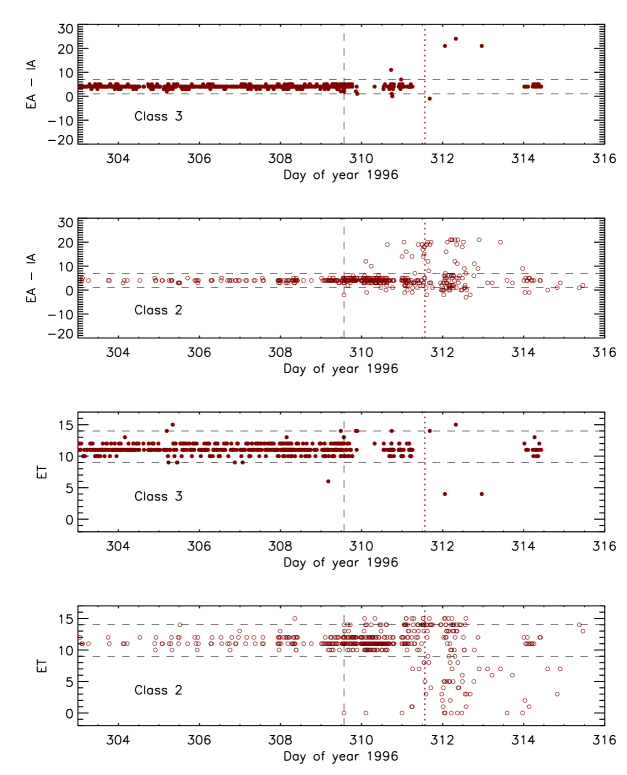
This marked difference between class 2 and class 3 events during impact or noise events (charge amplitudes, charge rise times, time differences and coincidences between the charge signals) has been used to derive criteria for a clear noise identification. Figure 4 shows two of the parameters investigated: 1. the difference between the charge measured on the target, , and that measured on the ion collector grid, , (in digital units), and 2. the rise time of the target signal (ET in digital units).
The class 3 impacts show a very small spread in with a mean value of about 4. This is in agreement with laboratory measurements at the Heidelberg dust accelerator which, for dust impacts, showed target signals usually 2 to 6 units larger than the ion charge signals: . Only four class 3 impacts have values larger than ten, and there are only three impacts with a value of one or smaller. Outside (day 303 to 309) the class 2 events show the same behaviour in as class 3 impacts. Within , however, shows a much larger spread in class 2. Very large values exceeding 20 and small values of one or smaller are frequent.
The rise time values, ET, of the target signal show a very similar characteristic: outside the digital values measured for class 2 cluster between 9 and 14 which is the same range as that measured for most of the class 3 impacts. In the inner Jovian system, however, all possible digital rise time values between 0 and 15 have been found. A very similar boundary for class 2 events at has also been found for other parameters which are not shown here: the rise time of the ion collector signal, , the time difference between the target and the ion collector signals, , the time difference between the target and the entrance grid signals, , the charge signal measured at the channeltron, , etc.
In order to separate noise events from true dust impacts in class 2 we have assumed that class 3 is noise-free and derived boundaries for the various impact parameters from the spread of the above-listed parameters for class 3 far away from Jupiter. All events which fulfill the criteria listed in Tab. 1 are classified as noise events. All other events are considered true class 2 dust impacts. The criteria applied to events in the lowest amplitude range AR1 are different from those in the higher amplitude ranges AR2 to AR6. The events classified as noise by the criteria listed in Tab. 1 are shown in the third panel of Fig. 3. They are strongly concentrated towards the time of perijove passage, and their rotation angle distribution is nearly isotropic. This is in clear contrast to the rotation angle pattern of the class 3 impacts in this time interval (days 310 to 313, top panel of Fig. 3).
The criteria given in Tab. 1 separate rather well dust stream particles from probable noise events. We derived these criteria from a pure analysis of the data rather than a consideration of physical mechanisms that can trigger noise events in the dust sensor. Future investigations have to show if these criteria can also successfully be applied to other populations of dust particles like, for example, the secondary ejecta particles we have detected close to the Galilean satellites (Grün et al. 1998).
3 The ’denoised’ Galileo dust data
Class 2 dust impacts after denoising are shown separately in the fourth panel of Fig. 3. They are combined with class 3 impacts in the fifth panel. The ’swarm’ of class 2 events detected with all rotation angles close to perijove passage has nearly completely disappeared. Before day 309 and on day 314 class 2 impacts show nearly the same behaviour as class 3 which indicates that the noise separation derived in the previous section is quite reliable. The gap in class 3 on day 310 is filled with class 2 impacts which have a large spread in rotation angle. This is a clear difference between class 2 and class 3, and it is a real difference. A similar spread in class 2 was also seen during most of the other satellite encounters when Galileo was in the inner Jovian system. This feature will be discussed in Sect. 4.
2,822 class 2 events detected during Galileo’s Jupiter mission in 1996 and 1997 (G1 to E12 orbits) fulfill the noise criteria in Tab. 1. Given a total number of 7,507 class 2 events detected by the dust sensor in the same time period (Tab. 2) the fraction of noise events in class 2 is 38%. The complete data set for 1996 and 1997 now contains 10,660 true class 2 (4,685) and class 3 (5,975) dust impacts. 97% of these are small dust particles detected in the lowest amplitude range AR1.
The noise separation criteria developed in the present analysis have been applied to class 1 and class 0 events without success. More than 80% (5,302) of all events in these two classes are in the lowest amplitude range AR1 which was very sensitive to noise even in the low-noise interplanetary environment. Therefore, the identification of true dust impacts in these two categories in the data obtained within the Jovian system will be very difficult. The remaining 20% (1,076) of class 0 and class 1 events in higher amplitude ranges almost completely populate the second amplitude range AR2. Even if dust impacts could be identified in these data, this would only marginally increase the total number of 10,660 dust impacts in class 2 and class 3. We therefore consider class 2 and class 3 impacts as the complete set of dust data from Galileo’s orbital tour about Jupiter.
A very small number of class 3 events detected in the inner Jovian system also fulfills the noise criteria for class 2 listed in Tab. 1 as can be seen in Fig. 4. A future analysis has to show if this is indeed noise. The total number of such class 3 events in the data set from the Jovian system is expected to be less than one percent and, theerfore, is probably irrelevant.
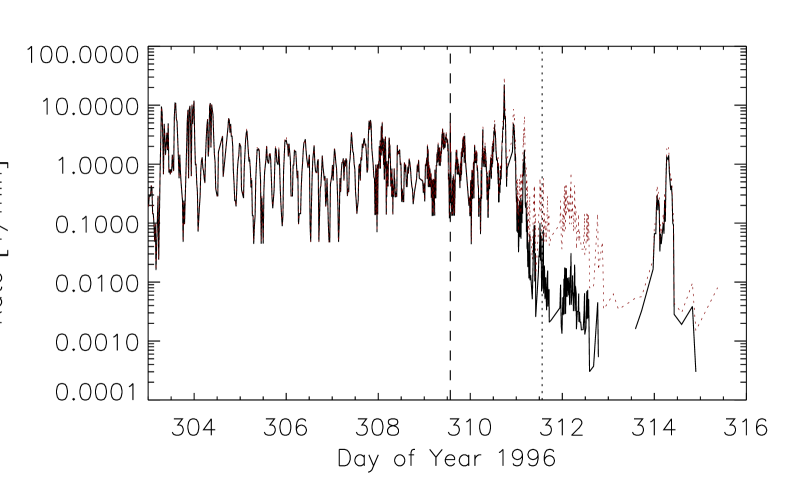
During Galileo’s Jupiter mission the memory of DDS is typically read out every 7 or 21 minutes and the data are directly transmitted to Earth. The latest event detected between two readouts in each of the six amplitude ranges plus one older event from any one of the six amplitude ranges is transmitted with its full information (charge signals, rotation angle etc. measured during the impact or noise event, Paper I). Because the stream particles populate only the lowest amplitude range (AR1), some of them are lost if there is more than one event between two readouts, or, in other words, if the event rate exceeds one per 7 or 21 minutes. This occurs quite frequently during Galileo’s orbital tour in the Jovian system and only a fraction of all particles can be transmitted with their full information. Therefore, the impact rate has to be determined from the accumulators of the instrument (Paper I) since every impact or noise event is counted with one of 24 accumulators irrespective of whether it is transmitted to Earth with its full information or not. The accumulators, however, cannot discriminate between noise and true dust impacts. Hence, rates deduced from the class 2 accumulators contain noise especially in the inner Jovian system.
With dust impacts now being separable from noise events, the class 2 event rate deduced from the class 2 accumulators (Paper I) can be ’cleaned’ from noise. The dashed line in Fig. 5 shows the event rate (noise plus dust impacts) deduced from the class 2, AR1 accumulator. By calculating the ratio between the number of noise events and the total number of events (true dust impacts plus noise events) within a certain time interval, an empirical noise correction (relative noise fraction ) can be applied to the impact rate. The corrected impact rate is shown as a solid line in Fig. 5. Each rate value has been corrected by the relative noise fraction determined from an interval half a day before until half a day after the time of the rate point to be corrected. The largest noise correction occurred around perijove passage.
4 The rotation angle pattern of small class 2 and class 3 dust particles
In this section we use the denoised dust data set derived in the previous section to analyse the field of view (FOV) of the dust sensor for class 2 and class 3 impacts.
4.1 Spacecraft configuration
To understand the directional behaviour of the impacts one has to know the FOV of DDS and the configuration of the Galileo spacecraft. The spacecraft configuration is shown in Figure 2. The DDS instrument is mounted underneath the magnetometer boom (MAG, Kivelson et al. 1992). The Plasma Subsystem (PLS, Frank et al. 1992) and the Energetic Particles Detector (EPD, Williams et al. 1992) are mounted sideways to the boom. The 140∘ FOV of DDS is indicated. Note that the magnetometer boom, PLS and EPD are in the FOV of DDS. The significance of the obscuration by these instruments becomes obvious in Fig. 6 which shows the FOV of DDS seen by an imaginative observer ’sitting‘ in the center of the target (i.e. on the sensor axis). The parts of the FOV obscured by the boom, PLS and EPD are at the top. In the following the angle w.r.t. the sensor axis will be called impact angle. Note that the boom obscures the FOV in -Z direction down to an impact angle of .
DDS is mounted underneath the magnetometer boom at an angle of 60∘ with respect to the positive spin axis (+Z direction, JPL Galileo document GLL-3-180C, page 70). An angle of 55∘ has been erroneously stated before. Simulations of the Jupiter dust stream particles show that the instrument viewing geometry which corresponds to a 60∘ angle gives better agreement with the observed impact directions of the particles than that corresponding to a 55∘ angle (Heck 1998).
4.2 Data
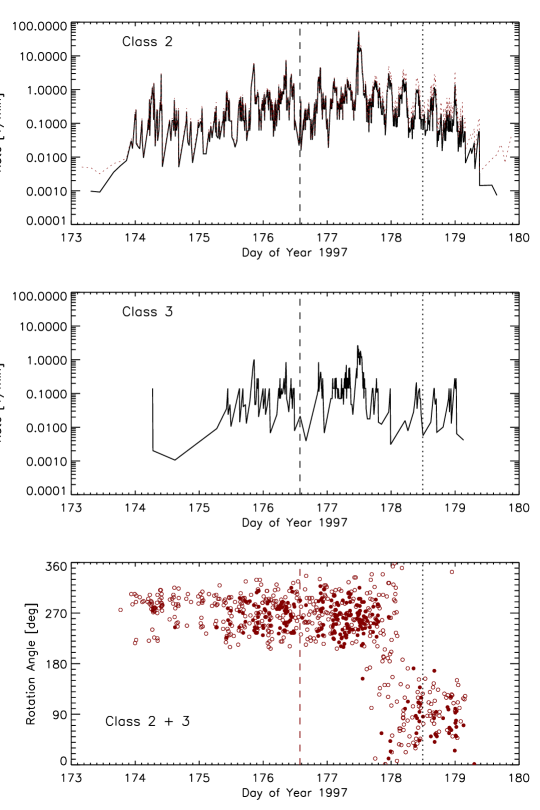
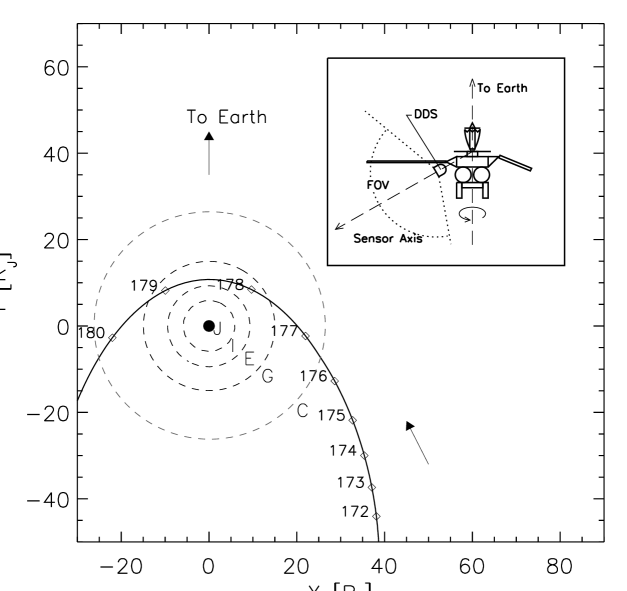
In order to compare the directional behaviour of the class 2 and class 3 dust impacts we use data from the Callisto 9 (C9) orbit as a representive example. Similar features have been seen during most of the other orbits of Galileo through the inner Jovian system. Figure 7 shows the impact rates and the rotation angle for small class 2 and class 3 impacts when Galileo was approaching the inner Jovian system. The trajectory of the C9 orbit is shown in Fig. 8. The most important features in the impact rates of both classes which are relevant for this analysis are: The rate of class 2 impacts increased by more than an order of magnitude on day 174.0. Such a strong increase occurred in the class 3 impact rate about 1.4 days later (175.4). Furthermore, the impact rate of class 3 shows a gap on day 178.0 to 178.4 which is not seen in class 2. A similar gap has also been reported for the class 3 rate detected during the first four orbits of Galileo’s mission about Jupiter (Grün et al. 1998).
The bottom panel of Fig. 7 displays the rotation angle (ROT) of the dust particles in both classes. The delay in the onset of class 3 impacts by 1.4 days with respect to class 2 which was already recognized in the impact rate is easily seen: class 2 starts on day 174.0 and class 3 on day 175.4 (except for three rare earlier impacts which were detected during a spacecraft turn). When Galileo was approaching the inner Jovian system (days 174 to 177.5, cf. Fig. 8), the particles were detected with . The distribution of class 2 particles over this range of 140∘ differs from that of class 3: between day 174.0 and day 175.4 most of the class 2 impacts are seen at rotation angles larger than 270∘. Furthermore, the region has very few class 2 impacts in this time span. Such a behaviour is not seen in the class 3 impacts after day 175.4: they do not show such a gap at .
In the inner Jovian system (day 178.0) the rotation angle of particles in both classes shifted by 180∘. This shift is coincident with the drop in the class 3 impact rate (see the top panel of Fig. 7). At this time the rotation angle for class 2 widened to nearly 360∘ and the class 2 impact rate did not show a significant drop.
A closer look at the impacts with rotation angles of 270 reveals that the range of the rotation angles for class 2 is wider than that for class 3. This is illustrated in Fig. 9. The first panel shows the distribution of the rotation angles for all class 2 impacts detected between day 173.5 and day 177.5. 80% of all particles are contained between the two dashed lines and the dash-dotted line shows the mean value. The second panel shows the same histogram for class 3. Two things are obvious in the diagrams: a) the distribution of class 2 impacts is broader than that of class 3: 79∘ for class 2 vs. 59∘ for class 3, and b) the distribution of class 2 shows a lack of particles with rotation angles smaller than 270∘.
To summarise, we have found four differences in the behaviour of the rotation angle between class 2 and class 3 impacts:
-
1)
The onset of class 3 impacts is delayed with respect to class 2,
-
2)
The distribution of class 2 rotation angles is asymmetric,
-
3)
The distribution of class 2 rotation angles is broader than that of class 3,
-
4)
The gap in class 3 impacts during the shift by 180∘ is ‘filled’ with class 2.
4.3 Analysis
We will now discuss one by one the four differences between class 2 and class 3 impacts listed above.
1) The delay of class 3 w.r.t class 2: the Jovian dust streams are collimated streams of nanometer-sized particles moving on curved trajectories outward from the inner Jovian system with velocities in excess of (Zook et al. 1996, Grün et al. 1998). Analysis of the angular momentum shows that particles on such trajectories can reproduce the onset of impacts, the shift in rotation angle when Galileo approaches Jupiter and the disappearance of impacts right after perijove passage (Grün et al. in prep.). The time difference in the onset of class 2 and class 3 impacts can be attributed to different approach directions of the particles:
When Galileo is on the outer part of its orbit far away from Jupiter but moving towards the planet, the particles approach Galileo ’head-on’ from the antenna direction, i.e. more or less parallel to the spacecraft spin axis (see also Grün et al. 1998). Particles approaching from this direction cannot be detected by DDS (cf. Fig. 2). When Galileo moves closer to Jupiter, the angle between the particles’ approach direction and the spacecraft spin axis increases. At a certain position of Galileo, the particles begin to enter the FOV of the sensor (day 174.0 in the case of C9) and the first class 2 impacts occur. Later when the stream has moved further into the FOV the first class 3 impacts are detected (day 175.4). Still later when the particles approach from the anti-Earth direction the rotation angle shifts by (day 178.0).
There is no generic difference between dust particles which can trigger class 2 or class 3 events. Apart from other charge rise time and coincidence criteria, three charge signals – electron, ion and channeltron signal – are required for a class 3 event, whereas only two are necessary for class 2 (Paper IV). The delay in the onset of the class 3 impacts indicates that dust particles which approach the detector under large impact angles can trigger only class 2 events (cf. Fig. 2). They do not create a channeltron signal and hence cannot create a class 3 event. Only particles approaching the detector under smaller impact angles can trigger channeltron signals. In other words, the sensitive area for class 3 must be smaller than that for class 2. We will analyse the sensitive area and the FOV for class 3 impacts in Sect. 5
2) The asymmetry in the rotation angle distribution of class 2: this can be understood as being due to shadowing caused by the magnetometer boom and the PLS and EPD instruments: particles which approach the sensor at rotation angles of from the -Z direction and impact angles between to hit the boom, EPD or PLS instead of the dust sensor. Hence, the boom is responsible for the lack of class 2 events at rotation angles of in the lowest panel of Fig. 7. On the other hand, particles which enter the sensor under such large impact angles can only trigger class 2 events. Hence, the asymmetry in the rotation angle distribution is only seen in class 2. Some time later, when the stream has moved closer to the sensor axis, the dust particles can also trigger class 3 events: only a small gap is seen in the rotation angle distribution of class 3 at about 270∘ (second panel of Fig. 9).
3) The widths of the rotation angle distributions for both classes: the smaller width of the rotation angle distribution of class 3 compared with class 2 is consistent with a reduced sensitive area as discussed above: during one spin revolution the stream sweeps across the FOV of DDS. Particles which enter the detector from close to the edge of the FOV can trigger only class 2 events, whereas for class 3 the particles must be closer to the sensor axis. Hence, the rotation angle for a class 3 detection must be closer to 270∘ than for a class 2 impact.
4) The ’filling‘ of the gap in class 3 by class 2 particles: finally, to understand the class 2 impacts during the gap in class 3 one has to consider the viewing geometry of DDS during one full spin revolution of Galileo. Since DDS is mounted at 60∘ with respect to the positive spin axis of the spacecraft and its FOV is 70∘ half cone, particles approaching from within 10∘ of the positive spin axis can be detected at all rotation angles (Fig. 2). Because of the consideration above, however, this is true only for class 2 impacts which were indeed detected with all rotation angles on day 178.0. At this time the dust stream approached Galileo from the anti-Earth direction. Due to the reduced sensitive area for particles which can trigger class 3 events and the corresponding reduced sensitive cone angle, class 3 events are missing at this time.
5 The sensitive area for small class 3 dust impacts
The previous discussion has shown that the FOV of DDS for class 3 impacts is significantly smaller than the usually adopted value of (Grün et al. 1992a). The analysis, however, was only qualitative so far. The collimated Jovian dust streams (Grün et al. 1997, 1998) allow for an exact determination of the sensitive area for dust particles which can trigger class 3 events.
We consider a subset of particles which approach the sensor with impact angle when the sensor points to a rotation angle of . The ratio between the number of such class 3 impacts, , and the total number of such impacts (class 2 and class 3 together), , is proportional to the ratio between the sensitive area for class 3 impacts, , and the total sensitive area of the sensor, :
Because Galileo moves about Jupiter, the dust stream particles approach the sensor at rotation angles of within several degrees along the sensor axis only at specific times. The times when this occurs have been determined from a study of the angular momentum of the stream particles and their trajectories (Grün et al. in prep). These times are given in Tab. 3. Due to the spacecraft spin (about three revolutions per minute), particles approach the sensor parallel to the sensor axis only during a very short time interval, namely when the sensor points exactly towards a rotation angle of . Thus, the number of particles with is very small. In order to have sufficiently large numbers of particles, we take all dust impacts from a one day interval ( days) around the times given in Tab. 3 and a rotation angle interval of (). We assume that the particles’ approach direction is still close to the sensor axis in these time and rotation angle intervals.
Due to the low data transmission capability of Galileo, not all detected particles could be transmitted to Earth with their full information (cf. Sect. 3). All particles, however, have been counted with one of 24 accumulators (Paper I). For the particles which were only counted the rotation angle is unknown. The fraction of counted particles to that for which the full information was received on Earth depends on the class: class 3 is transmitted to Earth with a higher priority than class 2. To correct for this incomplete data transmission, a correction factor can be derived from the numbers of events counted with the accumulators of both classes for the lowest amplitude range (AR1), and . The accumulators give the numbers of events independent of the rotation angle, and the class 2 accumulator also contains noise events. Assuming that the full information of an event is transmitted to Earth with the same priority independent of the rotation angle, the number derived from the accumulator can simply be scaled with the ratio between the number of particles detected with , (), and the number of particles detected over the full rotation angle range (), :
For the number of events derived from the class 2 accumulator, , only the fraction has been taken into account (cf. Sect. 3). Table 3 lists the numbers required to calculate the sensitive area of the dust sensor for small class 3 impacts. Only data from 1997 have been used. In earlier data sets unknown numbers of accumulator overflows occurred, especially in class 2, which makes the determination of unreliable for those orbits. The mean ratio of the sensitive areas derived from the seven 1997 orbits is . Given the total sensitive area of (Grün et al. 1992a), the sensitive area for class 3 impacts becomes .
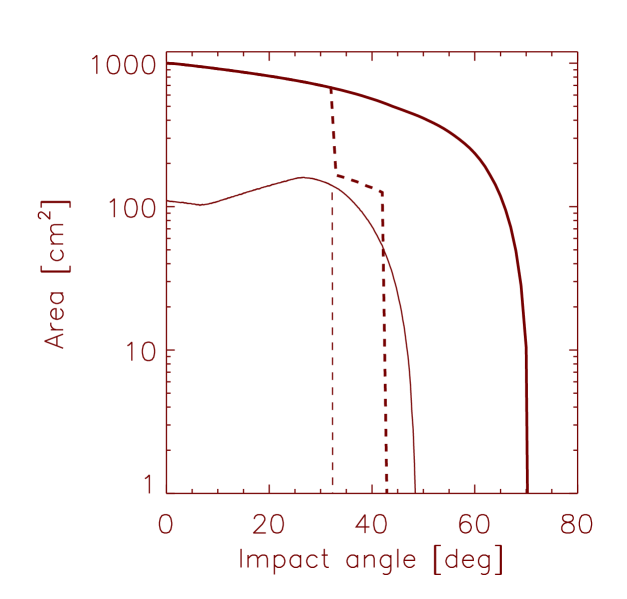
The sensitive area of the Galileo dust sensor as a function of impact angle has been published by Grün et al. (1992a) for a total sensitive area of . The corresponding sensor opening angle is . The above newly determined sensitive area for small class 3 impacts allows for a new calculation of this function (Fig. 10). A sensitive area of for particles approaching the sensor parallel to the sensor axis has been adopted. Due to shielding by the channeltron housing the sensitive area is a ring with the channeltron in its center (cf. Fig. 1). Starting from an initial value of the sensitive area rises with increasing impact angle and reaches a maximum of for impact angles close to . The sensitive area for impact angles of is smaller than that for larger angles because the channeltron housing shields a larger area for smaller angles. (Fig. 1). For particles approaching at impact angles significantly larger than the sensitive area drops because shielding by the sensor’s side walls becomes important. At an impact angle of the sensitivity drops to zero. A special case are particles which approach the sensor from within about of the -Z direction where shielding of the boom becomes important (Fig. 6): for impact angles larger than the sensitivity drops to zero because particles hit the boom instead of the sensor target. The width of the region where no class 2 particles have been detected with rotation angles from day 174.0 to day 175.4 (Fig. 7, Sect. 4.3 point 2) reflects the width of the boom (Fig. 6).
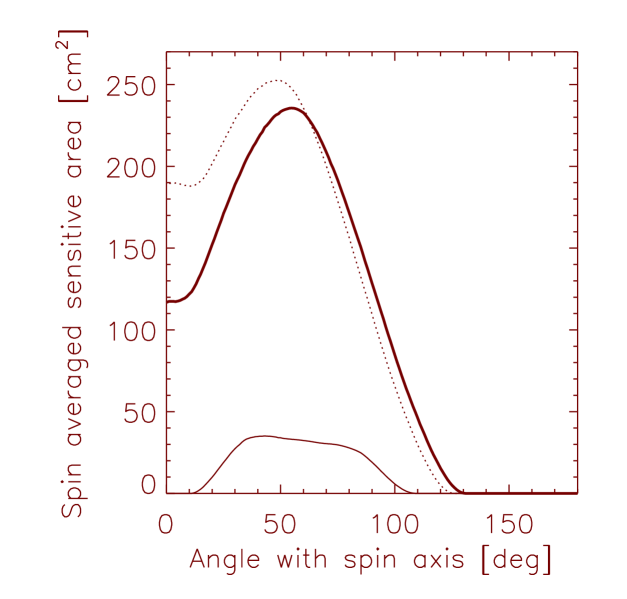
The angular sensitivity averaged over one spin revolution of Galileo can be found in Grün et al. (1992b, note that a mounting angle of 55∘ has been used in that analysis). This calculation is repeated in Fig. 11, for a mounting angle of 60∘. The upper curve has been calculated with a sensitive area of the dust sensor of which corresponds to a FOV of . The lower curve shows the spin-averaged sensitivity for a sensitive area of . The spin-averaged FOV is now reduced to and has a gap between and . The upper curve in Fig. 11 explains the widening of the rotation angle of the class 2 impacts on day 178.0 and the bottom panel explains why the class 3 impacts show a ’gap’ at the same time: with the reduced sensitive area for small class 3 impacts no particles approaching from the direction parallel to the positive spin axis (anti-Earth direction) can be detected anymore. The spin averaged sensitive area for small class 3 impacts has a maximum of which is a factor of 7 smaller than the maximum of the total sensitive area (, compare the lower and the upper curve in Fig. 11). This is in good agreement with the ratio between the class 3 and the total impact rates of stream particles detected during the orbits E6 to E12 (not only the short time intervals considered in Tab. 3).
6 Summary and Conclusions
Galileo dust data obtained within about from Jupiter show clear indications of noise contamination in their second highest event class (class 2). The highest event class (class 3) is almost totally noise-free. We have derived criteria to reject the noise events in class 2 and obtained a denoised set of dust data. This set of class 2 and class 3 dust impacts is now considered as the complete set of dust data from Galileo’s prime Jupiter mission. The present work extends the number of dust particles identified in the Jovian system by almost a factor of 2 with respect to earlier works which could use only class 3 (e. g. Grün et al. 1998). Since, on average, class 2 impacts of stream particles have been detected further away from Jupiter than class 3 impacts, the space sampled by the Galileo dust measurements in the Jovian system is extended with the new data set.
Investigations of dust in the Jupiter system will benefit from the new extended data set in various ways. Time series analysis relies on data sets for long time periods. Presently ongoing work which aims at the determination of the ultimate source of the Jupiter dust streams (A. Graps et al. in prep.) significantly benefits from the extended data set. Impact rates of stream particles are now about a factor of 9 higher than reported earlier (Grün et al. 1998, which used only class 3 particles). A few impacts have been detected in the vicinity of the Galilean satellites during close flybys at these moons which have been created by impacts of other dust particles onto the surfaces of the moons. Only with the extended noise-free data set a detailed investigation of the spatial distribution of these dust grains has become possible (Krüger et al. 1999).
The nanometer-sized Jupiter streams have been used to analyse the sensitive area and the FOV of the detector itself. Small dust particles which approach the sensor under large impact angles cannot create an impact plasma cloud which is large enough to trigger a channeltron signal. The sensitive area for small class 3 dust impacts is which is almost a factor of 10 smaller than the total sensitive area of the detector which is valid for class 2 (). The corresponding FOV is instead of . Shadowing of the sensor FOV by the magnetometer boom, the Energetic Particles Detector and the Plasma Subsystem is recognized in the data.
The sensitive area of the dust sensor averaged over one spacecraft spin revolution has been calculated for the reduced FOV. Because the dust sensor is mounted with an angle of to the spacecraft spin axis and the sensor FOV is reduced to only half cone angle, small particles approaching the sensor to within parallel to the spacecraft spin axis cannot trigger class 3 events.
Only the very fast () nanometer-sized stream particles have been used for our analysis of the FOV because they approached the sensor as collimated streams. With particles approaching the sensor from a wide range of directions the reduced FOV would have been hardly recognizable. According to our present understanding, the reduction of the sensitive area for class 3 applies only to these very fast and tiny particles which originate from the Jupiter system. They create impact charge signals in amplitude range AR1 only. We do not expect a significant reduction of the sensitive area for bigger particles which create charge signals in higher amplitude ranges (AR2 to AR6). Even particles which are bigger and slower than the stream particles () and which are recognized as class 3 impacts should ”see“ the total unreduced sensitive area.
Thus, conclusions obtained earlier about interplanetary dust (Grün et al. 1997) and interstellar dust (Landgraf 1998) are not affected by the reduced FOV for class 3. Also results about the dust populations in the Jupiter system other than the stream particles (Grün el al. 1998) remain unchanged. Furthermore, results about the Jupiter dust streams obtained from measurements in interplanetary space (Grün et al., 1993, 1996) remain unaffected because they used (among other parameters) the average impact direction rather than the widths of the streams.
The reduced FOV for class 3 can be used for an estimate of the dispersion of the dust streams which approach the detector from a source close to Jupiter. From the time difference between the onset of class 2 and class 3 impacts and the shift of the impact angle during this time interval we can estimate how strongly collimated the streams are. In the case of C9 the time difference is 1.4 days and the shift in impact angle in this time interval is (which is the difference between the FOV for class 2 and class 3). From Fig. 7 it is evident that within a few hours the impact rate increased from a very low background level to about one impact within 10 minutes. This implies that the width of the dust streams is only a few degrees and it is consistent with theoretical considerations (Horanyi et al. 1997, Grün et al. 1998).
A drop in the class 3 impact rate has been repeatedly observed when Galileo was approaching Jupiter during its orbital tour about the planet (Grün el al. 1998). This drop occurred around the times when the particles seemed to approach from all rotation angles. Formerly, it could be only partially explained by a dawn-dusk asymmetry in the release of dust particles from the Io torus (Horanyi et al. 1997; Heck 1998). The reduction in the sensitive area of the dust instrument found in the present analysis nicely explains the drop in the class 3 impact rate which is not seen in class 2.
In an analysis of the angular momentum of the stream particles Grün et al. (in prep.) constrain the possible distance range of the source from Jupiter. This analysis relies on the impact direction of the particles onto the detector (impact angle). Agreement with the onset of the class 3 impacts could only be achieved with the reduced sensitive area.
It should be noted that our analysis of the sensor FOV could not have been done during ground calibration in the laboratory. The stream particles are much faster and smaller than particle speeds and masses achieveable with the dust accelerator (Grün et al. 1992a).
Acknowledgments. The authors appreciate valuable discussions with Kai-Uwe Thiessenhusen during the preparation of the manuscript. We thank the referees, D. P. Hamilton and J. A. M. McDonnell, for valuable suggestions which improved the presentation of our results. We also thank the Galileo project at JPL for effective and successful mission operations. This work has been supported by Deutsches Zentrum für Luft- und Raumfahrt e.V. (DLR).
References
Baguhl, M., Grün, E., Linkert, D., Linkert, G. and Siddique, N., Identification of ’small’ dust impacts in the Ulysses dust detector data. Planet. Space Sci. 41, 1085-1098, 1993
Frank, L. A., Ackerson, K. L., Lee, J. A., English, M. R. and Pickett, G. L. The Plasma Instrumentation for the Galileo mission. Space Sci. Rev. 60, 283-307, 1992
Grün, E., Fechtig, H., Hanner, M.S., Kissel, J., Lindblad, B-A., Linkert, D., Linkert, G., Morfill, G.E. and Zook, H.A., The Galileo Dust Detector. Space Sci. Rev. 60, 317-340, 1992a
Grün, E., Fechtig, H., Giese, R.H., Kissel, J., Linkert, D., Maas, D., McDonnell, J.A.M., Morfill, G.E., Schwehm, G. and Zook, H.A., The Ulysses dust experiment. Astron. Astrophys. Suppl. Ser. 92, 411-423, 1992b
Grün, E., Zook, H.A., Baguhl, M., Balogh, A., Bame, S.J., Fechtig, H., Forsyth, R., Hanner, M.S., Horanyi, M., Kissel, J., Lindblad, B.-A., Linkert, D., Linkert, G., Mann, I., McDonnell, J.A.M., Morfill, G.E., Phillips, J.L., Polanskey, C., Schwehm, G., Siddique, N., Staubach, P., Svestka, J. and Taylor, A., Discovery of jovian dust streams and interstellar grains by the Ulysses spacecraft. Nature 362, 428-430, 1993
Grün, E., Baguhl, M., Fechtig, H., Hamilton, D.P., Kissel, J., Linkert, D., Linkert, G. and Riemann, R., Reduction of Galileo and Ulysses dust data. Planet. Space Sci. 43, 941-951, 1995a (Paper I)
Grün, E., Baguhl, M., Divine, N., Fechtig, H., Hamilton, D. P., Hanner, M. S., Kissel, J., Lindblad, B.-A., Linkert, D., Linkert, G., Mann, I., McDonnell, J. A. M., Morfill, G. E., Polanskey, C., Riemann, R., Schwehm, G., Siddique, N., Staubach P. and Zook, H. A., Three years of Galileo dust data. Planet. Space Sci., 43, 953-969, 1995b (Paper II)
Grün, E., Baguhl, M., Divine, N., Fechtig, H., Hamilton, D.P., Hanner, M.S., Kissel, J., Lindblad, B.-A., Linkert, D., Linkert, G., Mann, I., McDonnell, J.A.M., Morfill, G.E., Polanskey, C., Riemann, R., Schwehm, G., Siddique, N., Staubach, P. and Zook, H.A., Two years of Ulysses dust data, Planet. Space Sci. 43, 971-999, 1995c (Paper III)
Grün, E., Baguhl, M., Hamilton, D. P., Riemann, R., Zook, H. A., Dermott, S., Fechtig, H., Gustafson, B. A., Hanner, M. S., Horányi, M., Khurana, K. K., Kissel, J., Kivelson, M., Lindblad, B.-A., Linkert, D., Linkert, G., Mann, I., McDonnell, J. A. M., Morfill, G. E., Polanskey, C., Schwehm, G., and Srama, R., Constraints from Galileo observations on the origin of jovian dust streams, Nature, 381, 395-398, 1996.
Grün, E., Krüger, H., Dermott, S., Fechtig, H., Graps, A., Gustafson, B. A., Hamilton, D. P., Hanner, M. S., Heck, A., Horányi, M., Kissel, J., Lindblad, B.-A., Linkert, D., Linkert, G., Mann, I., McDonnell, J. A. M., Morfill, G. E., Polanskey, C., Schwehm, G., Srama, R. and Zook, H. A. Dust measurements in the jovian magnetosphere. Geophys. Res. Lett. 24, 2171-2174, 1997
Grün, E., Krüger, H., Graps, A., Hamilton, D. P., Heck, A., Linkert, G., Zook, H. A., Dermott, S., Fechtig, H., Gustafson, B. A., Hanner, M. S., Horányi, M., Kissel, J., Lindblad, B.-A., Linkert, D., Mann, I., McDonnell, J. A. M., Morfill, G. E., Polanskey, C., Schwehm, G., Srama, R. Galileo Observes Electromagnetically Coupled Dust in the Jovian Magnetosphere. J. Geophys. Res., 103, 20011-20022, 1998
Heck, A., Modellierung und Analyse der von der Raumsonde Galileo im Jupitersystem vorgefundenen Mikrometeoroiden-Populationen, PhD thesis, Heidelberg, 1998
Horanyi, M., Grün, E., Heck, A. Modelling the Galileo dust measurements at Jupiter, Geophys. Res. Lett., 24, 2175-2178, 1997
Kivelson, M. G., Khurana, K. K., Means, J. D., Russell, C. T. and Snare, R. C. The Galileo magnetic field investigation Space Sci. Rev. 60, 357-383, 1992
Krüger, H., Grün, E., Hamilton, D. P., Baguhl, M., Dermott, S., Fechtig, H., Gustafson, B. A., Hanner, M. S., Heck, A., Horányi, M., Kissel, J., Lindblad, B.-A., Linkert, D., Linkert, G., Mann, I., McDonnell, J. A. M., Morfill, G. E., Polanskey, C., Riemann, R., Schwehm, G., Srama, R. and Zook, H. A., Three years of Galileo dust data: II. 1993 to 1995. Planet. Space Sci., 1998a, in press (Paper IV)
Krüger, H., Grün, E., Graps, A. and Lammers, S. Observations of electromagnetically coupled dust in the Jovian magnetosphere, Astrophys. and Space Sci., in press, 1998b
Krüger, H., Krivov, A. V., Hamilton, D. P., Grün, E., Discovery of a dust cloud around Ganymede, Nature, 1999, submitted
Landgraf, M. Modellierung der Dynamik und Interpretation der In-Situ-Messung interstellaren Staubs in der lokalen Umgebung des Sonnensystems, PhD. thesis, Heidelberg, 1998
Williams, D. J., McEntire, R. W., Jaskulek, S and Wilken, B. The Galileo Energetic Particles Detector. Space Sci. Rev. 60, 385-412, 1992
Zook, H. A., Grün, E., Baguhl, M., Hamilton, D. P., Linkert, G., Liou, J.-C., Forsyth, R., Phillips, J. L. Solar wind magnetic field bending of jovian dust trajectories. Science 274, 1501-1503, 1996
| Charge Parameter | AR1 | AR2 to AR6 |
|---|---|---|
| Entrance grid amplitude | PA 9 | — |
| Channeltron amplitude | — | CA 2 |
| Target amplitude minus iongrid amplitude | (EAIA) 1 or | (EAIA) 1 or |
| (EAIA) 7 | (EAIA) 7 | |
| EA risetime | ET 9 or ET 14 | — |
| IA risetime | IT 8 | — |
| Flighttime target - iongrid | EIT 3 or EIT 14 | — |
| Flighttime entrance grid - target | 1 PET 30 | — |
| AR | CL2 | CL2 | CL3 | Sum |
| Noise | Dust | Dust | Dust | |
| 1 | 2,690 | 4,547 | 5,864 | 10,411 |
| 2 | 128 | 85 | 51 | 136 |
| 3 | 3 | 27 | 35 | 62 |
| 4 | 1 | 16 | 17 | 33 |
| 5 | 0 | 7 | 8 | 15 |
| 6 | 0 | 3 | 0 | 3 |
| Sum | 2,822 | 4,685 | 5,975 | 10,660 |
| Orb. | |||||||||
|---|---|---|---|---|---|---|---|---|---|
| [year-doy] | |||||||||
| (1) | (2) | (3) | (4) | (5) | (6) | (7) | (8) | (9) | (10) |
| E6 | 97-049.69 | 31 | 10 | 84 | 35 | 302 | 40 | 0.10 | 0.11 |
| G7 | 97-092.69 | 7 | 46 | 21 | 210 | 5,614 | 953 | 0.09 | 0.15 |
| G8 | 97-127.03 | 7 | 50 | 17 | 246 | 12,199 | 1,830 | 0.26 | 0.16 |
| C9 | 97-177.10 | 25 | 27 | 96 | 111 | 3,290 | 298 | 0.04 | 0.08 |
| C10 | 97-260.33 | 21 | 28 | 109 | 132 | 5,487 | 524 | 0.22 | 0.11 |
| E11 | 97-309.42 | 30 | 15 | 105 | 75 | 2,525 | 246 | 0.06 | 0.08 |
| E12 | 97-348.77 | 8 | 10 | 37 | 34 | 1,827 | 90 | 0.05 | 0.06 |