REDSHIFTS OF GALAXIES AROUND ARP 220 AND SERENDIPITOUS DISCOVERY OF THREE STAR-FORMING DWARF GALAXIES AT REDSHIFT 0.5
Abstract
We present redshift measurements of four faint galaxies around the archetypal ultraluminous infrared galaxy Arp 220. These galaxies have significantly higher redshifts ( 0.036 – 0.091) than that of Arp 220 (). Therefore, we conclude that they are background objects not physically related to Arp 220. Three of these faint galaxies located to the south of Arp 220 are a group of galaxies (or the brightest members in a cluster of galaxies) at , as suggested by Heckman et al. [1996, ApJ, 457, 616] on the basis of their associated soft X-ray emission.
We also report the serendipitous discovery of three additional galaxies at redshift , found along one of the slit positions. All three galaxies exhibit an [O ii]3727 emission line. The spectrum of the brightest galaxy () shows other strong emission lines: Mg ii 2798, H, [O iii]4959, and [O iii]5007. The emission-line properties of these galaxies as well as their intrinsically low luminosities () indicate that they are star-forming dwarf galaxies.
Subject headings:
galaxies: individual (Arp 220) - galaxies: redshift - galaxies: groups - galaxies: clusters1. INTRODUCTION
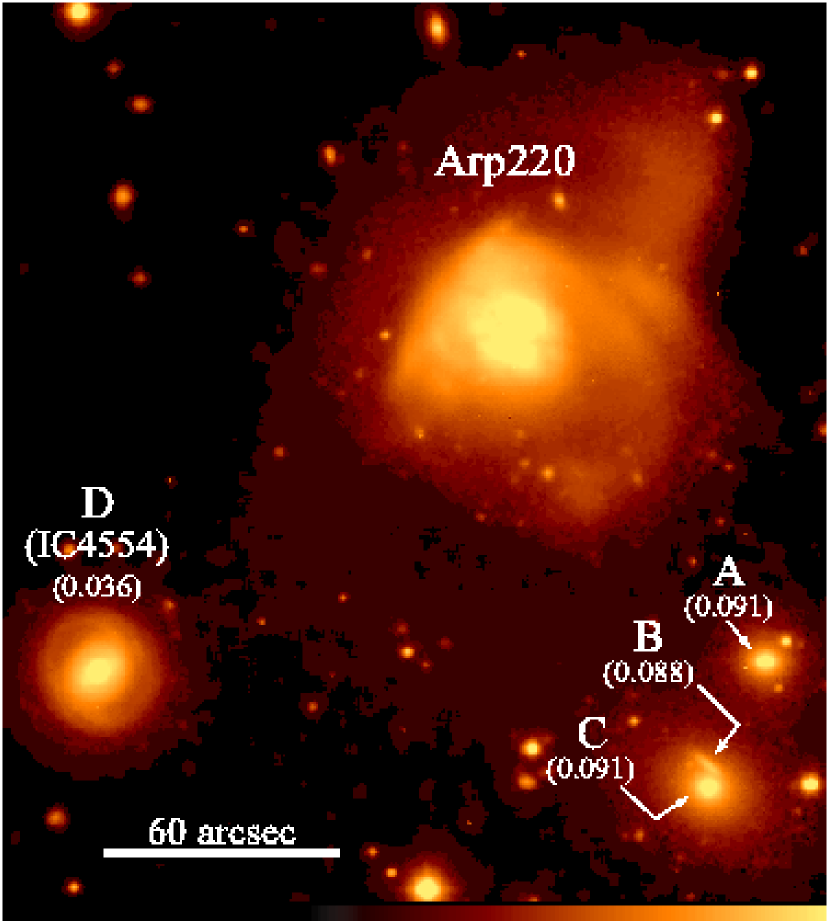
Arp 220 (IC 4553) is the archetypal ultraluminous infrared galaxy (; Soifer et al. 1984), and has been discussed extensively in the literature, mostly with regard to its huge infrared luminosity (Emerson et al. 1984; Heckman, Armus & Miley 1987; Sanders et al. 1988; Shaya et al. 1994; Genzel et al. 1998; Taniguchi, Trentham, & Shioya 1998; Taniguchi & Ohyama 1998; for a review see Sanders & Mirabel 1996). Recently, Heckman et al. (1996) presented their ROSAT observations of the soft X-ray properties of Arp 220. Interestingly, they find an additional diffuse soft X-ray source lying to the south-southwest, with an apparent bridge connecting back to Arp 220. Since Arp 220 is also a well-known superwind galaxy (Heckman et al. 1987, 1990; Taniguchi et al. 1998), this extension could be interpreted as a result of a wind-blown “supperbubble”. However, this X-ray source is located in a direction approximately perpendicular to the proposed outflow axis for the wind (PA from HRI imaging of Heckman et al. 1996), and Heckman et al. suggest instead that it is associated with a small compact group of galaxies coincident with the emission (see Figure 1). They note that the soft X-ray properties of the southern source (size, luminosity, and spatial extension) can be explained if this group is located at redshift .
However, recent VLA observations of the neutral hydrogen in Arp 220 by Yun, Hibbard & Scoville (1999; see also Hibbard & Yun 1996, 1999) call into question the interpretation given by Heckman et al (1996). These observations show that the H i gas directly associated with Arp 220 has an anomalous extension that projects directly onto the same group of galaxies. This raises the possibility that one or more of the galaxies in the group is a gas rich-rich system associated with Arp 220 rather than a background object. We therefore targeted the group of galaxies for spectroscopic observations to directly determine their redshifts.
In order to directly determine the redshifts of the group, we acquired optical spectra of these galaxies with the Keck II telescope. This paper reports on the result of these spectroscopic observations, which include the three galaxies to the south-southwest as well as a larger face-on barred galaxy located to the southeast of Arp 220. The optical identifications of the four galaxies are shown in Figure 1. The three galaxies labeled as A, B, and C are the putative background group identified by Heckman et al. (1996). The galaxy labeled as D is IC 4554, for which there are no photometric or spectroscopic observations available in the literature.
We have serendipitously discovered three star-forming galaxies at during these observations. The analysis of their spectra will be reported in section 3.3.
We adopt a Hubble constant = 50 km s-1 Mpc-1 and a deceleration parameter throughout this paper.
2. OBSERVATIONS
2.1. Optical Spectroscopy
Optical spectra of the visual companions to Arp 220 were acquired with the Low Resolution Imaging Spectrograph (LRIS; Oke et al. 1995) on the Keck II telescope on the nights of 1997 April 15 and 16 (UT) during a break in another observing project. On the first night (15 April) a 900 s exposure was obtained with a slit centered on galaxy A (see Figure 1) and rotated to a position angle of 156 degrees. The 300 l/mm grating used for these observations is blazed at 5000 Å and yields a dispersion of 2.55 Å/pixel. (The scale in the spatial direction is /pixel.) The central wavelength was set to 6565 Å and the resulting spectrum covers the wavelength range 3990 – 8970 Å. The resolution was measured to be 13 Å. Internal calibration lamp exposures, for both wavelength calibration and flat fields, were taken immediately after the science exposure at the same sky position. The error of the wavelength calibration is 0.1 Å over the entire wavelength range of the spectra. Although the slit was rotated to cover the companions A and C, and was not set at the parallactic angle, the airmass during the observations was approximately 1.10, and we therefore made no corrections to the observed flux to account for atmospheric dispersion. Spectra of the standard stars Feige 67 and BD +28∘ 4211 were obtained with the slit rotated to the parallactic angles for the purposes of flux calibration. Sky conditions were photometric during these observations.
On the second night, we obtained optical spectra of companion D. For these observations, the slit was again used and the position angle was set to 130 degrees. A 900 s exposure was taken with the 600 l/mm grating, with a central wavelength setting of 6024 Å. The grating is blazed at 5000 Å and the dispersion is 1.28 Å/pixel. The observational set-up yielded wavelength ranges and resolutions of 4670 – 7210 Å and 6.9 Å, respectively. The uncertainty in the wavelength calibration is 0.05 Å over the entire wavelength range of the spectra. The exposure was made at airmass of . Exposures of internal lamps were obtained for wavelength calibration and flat-field purposes. Spectra of standard stars Feige 34, Feige 67, and BD +33∘ 2642 were obtained with a wide slit () rotated to the parallactic angle for flux calibration. The sky conditions were photometric during these observations, and the seeing was estimated to be .
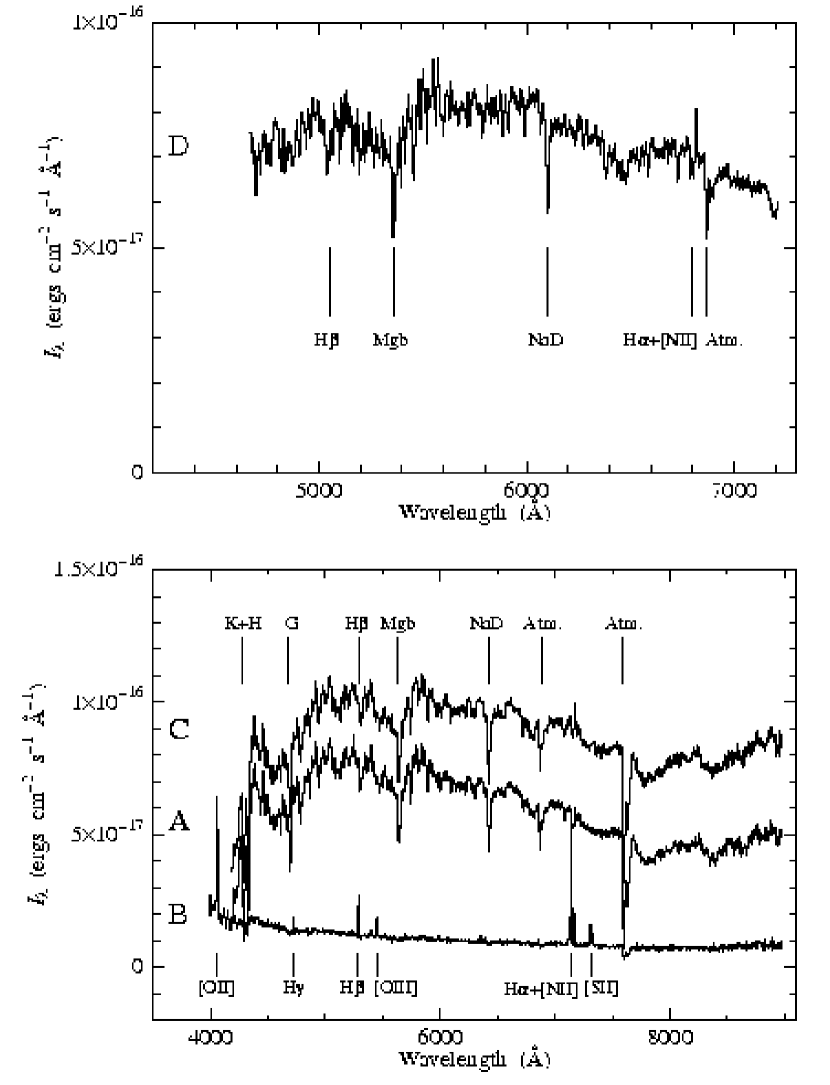
Data reduction was performed using IRAF. The optical spectra of the four galaxies were extracted from three rows centered on the observed peak brightness of each galaxy, corresponding to an aperture of 0.64 1 arcsec2. The spectra are shown in Figure 2 and the line identifications and the measured redshifts are given in Table 1.
2.2. Optical Imaging
Two 600 sec -band CCD images were obtained with the Tek 2k CCD camera mounted at the f/10 Cassegrain focus of the University of Hawaii 2.2 m telescope at Mauna Kea Observatories on 1995 June 3. The pixel scale was 0.22″, which yields a field of view of 7.5′. Since the seeing was measured to be 1.2″, the pixels were subsequently rebinned . The conditions were photometric on both dates, and the data were calibrated via observations of Landolt UBVRI standards (Landolt 1983) observed on the same nights. The zero point errors (1) were measured to be 0.03 mag. The images were flattened and combined using the techniques described in Hibbard & van Gorkom (1996), and the final mosaics are flat to better than one part in 500.
We have performed aperture photometry using FOCAS (Jarvis & Tyson 1981) and measured the total magnitudes of the four galaxies. The total magnitudes are measured in the following manner: For each galaxy, a contour at the 4 level above the sky background was determined. We then define a homologous contour whose surface is twice as large as that of the 4 contour. The total magnitude is measured using this larger aperture. These magnitudes are corrected for 0.1 mag of Galactic extinction in the R band (0.15 mag in the B band, Burstein & Heiles 1984) using the average Galactic extinction law of Seaton (1979). The results are summarized in Table 2. Note that we do not apply K correction in the estimates of absolute magnitudes. In Table 2, we also give positions of the four galaxies measured from the digitized sky survey (DSS) image. Although the morphological classification of galaxy D (IC 4554) given in the NASA Extragalactic Database (NED) is S0, our CCD image (Figure 1) shows an evident bar structure in this galaxy.
3. RESULTS AND DISCUSSION
3.1. Redshifts and Relation to Arp 220
The three galaxies, A, B, and C, have nearly identical redshifts (0.088—0.091). The galaxy D (IC 4554) has a redshift of 0.036. These redshifts are much higher than that of Arp 220 () and thus all four galaxies are background galaxies with no physical relation to Arp 220 (however see Arp 1987). As shown by Heckman et al. (1996), the soft X-ray properties of the southern extension can be reasonably understood in terms of the expected X-ray emission associated with a galaxy group or poor cluster. Accordingly, our optical spectroscopy has confirmed the interpretation proposed by Heckman et al. (1996). Since these redshifts are much higher than that of the H i in this area ( km s-1; Yun et al. 1999), we conclude that the apparent H i extension towards the southern group is a chance projection effect.
If we adopt a redshift for the southern group, the luminosity distance is estimated to be 558 Mpc. Thus the absolute magnitudes of the two brightest galaxies are . This magnitude is comparable to those of first-ranked cluster elliptical galaxies (Postman & Lauer 1995). In addition, the redshift difference among the three galaxies () corresponds to a velocity difference of 900 km s-1, which is comparable to the typical velocity dispersion of a cluster of galaxies. Therefore, we conclude that these galaxies are physically associated and comprise a group of galaxies or the brightest galaxies in a cluster of galaxies at .
3.2. Comments on the Emission-line Galaxy B
The optical spectroscopy reveals that galaxy B is an emission-line galaxy. The observed emission line fluxes are listed in Table 3, and here we use them to derive the characteristics of the ionized gas and the hot star population.
After correcting for the Galactic extinction ( mag), we obtain a Balmer decrement, (H)(H) . This yields a visual extinction mag (Case B with the electron temperature K; Osterbrock 1989). This value is used to obtain the reddening-corrected fluxes given in Table 3. The [S ii] doublet ratio, ([S ii]6717)([S ii]6731) , gives an electron density of cm-3. The [N ii]6583/H, [S ii](6717 + 6731)/H, and [O iii]5007/H line ratios indicate that massive stars are the source of the ionizing photons (Veilleux & Osterbrock 1987). For a distance of 558 Mpc (), the reddening-corrected H luminosity, (H) erg s-1, yields a production rate of Lyman continuum photons of (Lyc) photons s-1, equal to the output of O5V stars (Vacca, Garmany, & Shull 1996). Finally, the ratio [([O ii]3727) + ([O iii]4959) + ([O iii]5007)]/(H) can be used to estimate the metallicity of the galaxy. Using the reddening-corrected fluxes given in Table 3, we obtain . The empirical calibration of Edmunds & Pagel (1984, see also Vacca & Conti 1992) then yields 12 + log (O/H) , or an oxygen abundance with respect to solar of [O/H] . (We adopted the solar oxygen abundance value (O/H)⊙ = 8.303 of Meyer 1985.) The derived properties of galaxy B are typical of those of star-forming galaxies.
3.3. Serendipitous Discovery of Three Star-Forming Dwarf Galaxies at
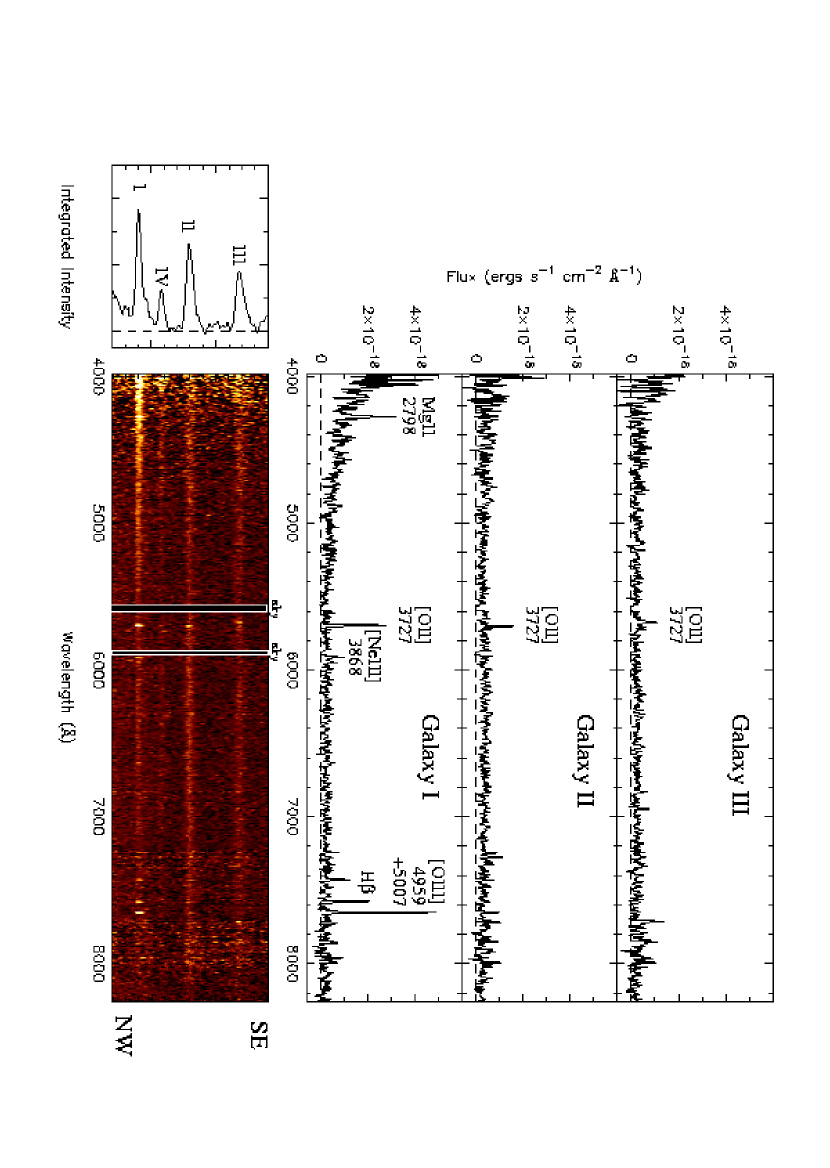
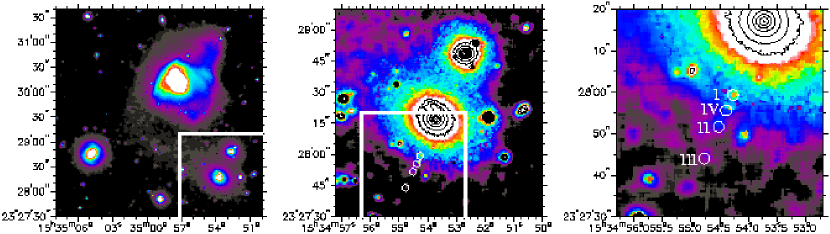
In the two-dimensional spectrum taken at PA on 1997 April 15, we serendipitously found continuum and line emission from three additional faint galaxies. Their spectra are shown in Figure 3, where the galaxies have been denoted as I, II, and III (brightest to faintest). Continuum emission from another very faint galaxy (denoted as IV) is also seen in Figure 3. The spectra of galaxies I, II, and III were extracted from three rows (0.64″) centered on the observed peak brightness of each galaxy. In order to identify these galaxies, we show a close up of our -band CCD image in Figure 4. The faintest galaxy IV in Figure 3 appears to be as bright as galaxy I in this image. Thus the faintness in Figure 3 may be due to our slit covering only a portion of this galaxy. Since there are no convincing emission lines in this spectrum, we will not discuss this galaxy further in this paper.
The coordinates of galaxies I, II, and III are given in Table 4. We also give rough estimates of magnitudes which were measured using the spectra shown in Figure 3. The observed magnitudes were corrected for 0.1 mag of Galactic extinction in the R band (0.15 mag in the B band, Burstein & Heiles 1984) using the average Galactic extinction law of Seaton (1979). Note that we do not apply K correction in the estimates of absolute magnitudes. Since it is unlikely that our slit covered the entire images of the galaxies, the magnitudes given in Table 4 may be upper limits.
Identifications, fluxes, and equivalent widths of the emission lines, as well as the redshifts derived from the observed wavelengths of the lines, are summarized in table 5. All the galaxies are located at . Note that galaxy III has only one obvious emission line which we identify as [O ii]3727. We see a faint emission feature which may be H in Figure 3 but we cannot confirm it unambiguously. The widths of the emission lines are not resolved by our spectroscopy. Our resolution (13 Å) yields an upper limit to the line widths of 700 km s-1 for the redshifted [O ii] 3727 line.
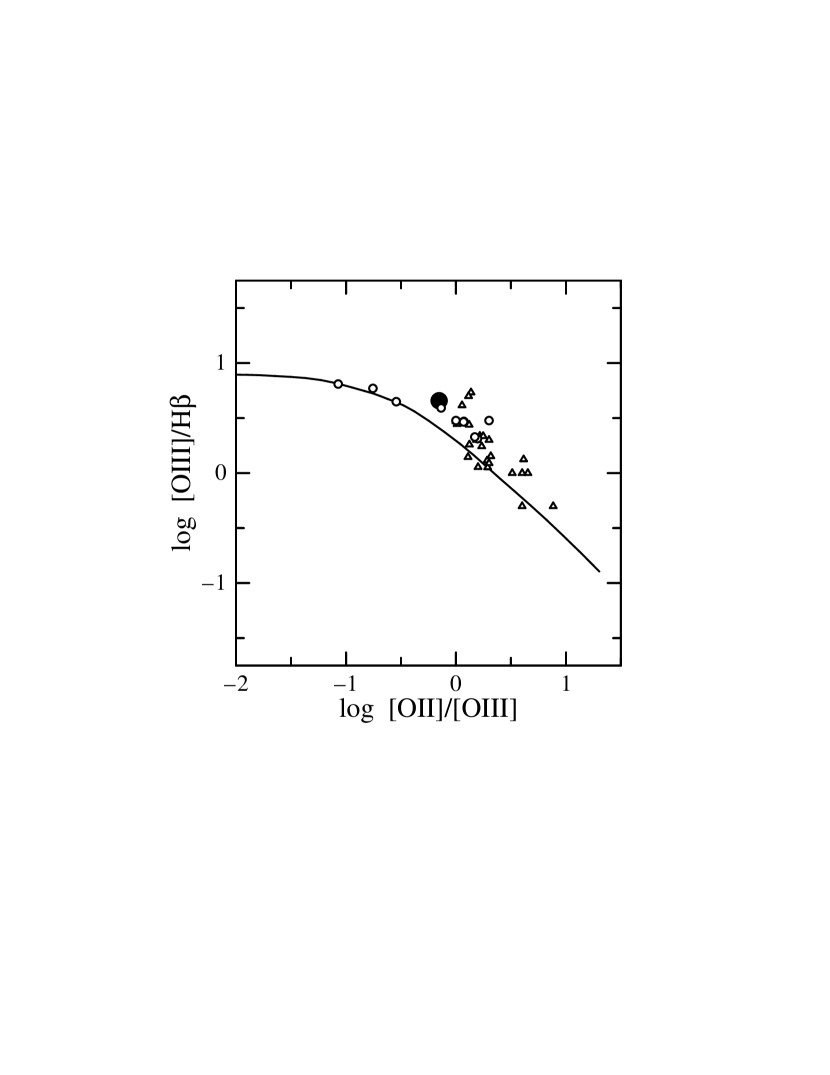
Since galaxy I shows several strong emission lines, we investigate its ionization properties in more detail. In Figure 5, we show the location of galaxy I in the [O ii]3727/[O iii]5007 versus [O iii]5007/H excitation diagram (Baldwin, Phillips, & Terlevich 1981). For comparison, we plot a solid curve representing a sequence for H ii regions photoionized by massive stars, as well the data for nearby irregular and spiral galaxies taken from Kennicutt (1992). Since galaxy I lies in the same area of the excitation diagram as these data, its excitation properties are typical of local star forming galaxies. However, it should be noted that we have made no correction for the (unknown) internal extinction, which could signifcantly change the [O ii]3727] line flux. We also see no evidence for a broad component at the base of the H line, but our S/N is not sufficient to allow a definitive statement regarding the presence or absence of such a feature.
The spectrum of galaxy I exhibits a very blue continuum as well as strong [Ne iii]3869 and Mg ii 2798 emission lines. The intensities relative to that of H are 0.51 and 1.53, respectively (with no reddening corrections). The [Ne iii]3869 emission line is contaminated by a strong night sky line (see Figure 3). Although the [Ne iii]3869 emission line has been detected in a number of star-forming galaxies, Mg ii 2798 in emission is more typical of AGN (e.g., Storchi-Bergmann, Kinney, & Challis 1995). However, these emission lines may be generated in shock-heated regions (Dopita & Sutherland 1996), and it is possible that the ionized gas in galaxy I is affected by some wind activity by massive stars and their descendents (e.g., Wolf-Rayet stars and supernovae). Furthermore, although Mg ii 2798 emission is generally rare in starburst systems, some starbursts do in fact exhibit this emission feature (e.g. the blue compact dwarf galaxies NGC 1510 and Tol 1924-416; Kinney et al. 1993; Storchi-Bergmann, Kinney, & Challis 1995). While we have not detected any high ionization lines such as [Ne v], nor see any evidence for a broad line component in the detected lines, our observations still cannot rule out an AGN origin. Nonetheless, we will proceed under the assumption that the emission lines are due to a starburst.
The emission line luminosities can be used to estimate the star formation rate (SFR) in these galaxies. We use the calibration based on [O ii] luminosity derived by Kennicutt (1992; SFR L([O ii]) y-1). The results are summarized in Table 6. We obtain SFR y-1 for galaxy I while SFR y-1 for galaxies II and III. These SFRs are smaller by a factor of a few than that for a normal galaxy (i.e., a so-called galaxy), y-1 (e.g., Cowie, Hu, & Songaila 1995).
The estimated parameters for galaxies I, II, and III indicate that they are so-called faint blue galaxies, similar to those found in the previous deep survey programs (e.g., Cowie, Songaila, & Hu 1991; see for reviews, Koo & Kron 1992; Ellis 1997). They may be also related to the class of compact narrow emission line galaxies at intermediate redshifts (Koo et al. 1995; Guzmán et al. 1996).
The observed separations between the galaxies is 8.4″, corresponding to a linear separation 60 kpc. This is typical of the mean separations found in compact groups of galaxies (Hickson et al. 1992). Such groups frequently contain multiple star forming members (e.g. Coziol et al. 1998). However, since light from galaxy C prohibits a clear view of the region around these systems (Fig 4), it is not possible to say whether we have discovered an intermediate redshift compact group, or a subcomponent of a larger structure.
We would like to thank the staff of W. M. Keck Observatory for their kind support for our observations. We would also like to thank the referee for useful comments. YO is a JSPS Research Fellow. WDV acknowledges partial support in the form of a fellowship from the Beatrice Watson Parrent Foundation. JEH thanks D. M. Whittle and T. X. Thuan for useful conversations. This work was partly supported by the Japanese Ministry of Education, Science, and Culture (Nos. 10044052, and 10304013). Some of the data presented herein were obtained at the W.M. Keck Observatory, which is operated as a scientific partnership among the California Institute of Technology, the University of California and the National Aeronautics and Space Administration. The Observatory was made possible by the generous financial support of the W.M. Keck Foundation. This research has made extensive use of the NASA/IPAC Extragalactic Database (NED), which is operated by the Jet Propulsion Laboratory, California Institute of Technology, under contract with the National Aeronautics and Space Administration. The Digitized Sky Surveys were produced at the Space Telescope Science Institute under U.S. Government grant NAG W-2166. The images of these surveys are based on photographic data obtained using the Oschin Schmidt Telescope on Palomar Mountain and the UK Schmidt Telescope. The plates were processed into the present compressed digital form with the permission of these institutions.
References
- (1) Arp, H. 1987, “Quasars, Redshifts and Controversies” (Berkeley, Interstellar Media)
- (2) Baldwin, J. A., Phillips, M. M., & Terlevich, R. 1981, PASP, 93, 5
- (3) Burstein, D., & Heiles, C. 1984, ApJS, 54, 33
- (4) Cowie, L. L., Hu, E. M., & Songaila, A. 1995, Nature, 377, 603
- (5) Cowie, L. L., Songaila, A., & Hu, E. M. 1991, Nature, 354, 460
- (6) Coziol, R., Ribeiro, A. L. B., de Carvalho, R. R., & Capelato, H. V. 1998, ApJ, 493, 563
- (7) Dopita, M. A., & Sutherland, R. S. 1996, ApJS, 102, 161
- (8) Edmunds, M. G., & Pagel, B. E. J. 1984, MNRAS, 211, 507
- (9) Ellis, R. S. 1997, ARA & A, 35, 389
- (10) Emerson, J. P., Clegg, P. E., Gee, G., Griffin, M. J., Cunningham, C. T., Brown, L. M. J., Robson, E. I., & Longmore, A. J. 1984, Nature, 311, 237
- (11) Genzel, R., et al. 1998, ApJ, 498, 579
- (12) Guzmán, R., Koo, D. C., Faber, S. M., Illingworth, G. D., Takamiya, M., Kron, R. G., & Barshady, M. A. 1996, ApJ, 460, L5
- (13) Heckman, T. M., Armus, L., & Miley, G. K. 1987, AJ, 93, 276
- (14) Heckman, T. M., Armus, L., & Miley, G. K. 1990, ApJS, 74, 833
- (15) Heckman, T. M., Dahlem, M., Eales, S. A., Fabbiano, G., & Weaver, K. 1996, ApJ, 457, 616
- (16) Hibbard, J. E., & Yun, M. S. 1999, in preparation
- (17) Hibbard, J. E., & Yun, M. S. 1996, in “Cold Gas at High Redshift”, edited by M. Bremer, H. Rottgering, P. van der Werf, and C. L. Carilli (Kluwer, Dordrecht), p. 47
- (18) Hibbard, J. E. & van Gorkom, J. H. 1996, AJ, 111, 655
- (19) Hickson, P., Mendes de Oliveira, C., Huchra, J. P., & Palumbo, G. G. C. 1992, ApJ, 399, 353
- (20) Jarvis, J. F., & Tyson, J. A. 1981, AJ, 86, 476
- (21) Kennicutt, R. C. Jr. 1992, ApJ, 388, 310
- (22) Kinney, A. L., Bohlin, R. C., Calzetti, D., Panagia, N., & Wyse, R. F. 1993, ApJS, 85, 5
- (23) Koo, D. C., Guzmán, R., Faber, S. M., Illingworth, G. D., Barshady, M. A., Kron, R. G., & Takamiya, M. 1995, ApJ, 440, L49
- (24) Koo, D. C., & Kron, R. 1992, ARA & A, 30, 613
- (25) Landolt, A. U. 1983, AJ, 88, 439
- (26) Meyer, J. -P. 1985, ApJS, 57, 173
- (27) Oke, J. B., Cohen, J. G., Carr, M., Cromer, J., Dingizian, A., Harris, F. H., Labrecque, S., Lucinio, R., Schall, W., Epps H., & Miller, J. 1995, PASP, 107, 375
- (28) Osterbrock, D. E. 1989, Astrophysics of Gaseous Nebulae and Active Galactic Nuclei, (University Science Book)
- (29) Postman, M., & Lauer, T. 1995, ApJ, 440, 28
- (30) Sanders, D. B., & Mirabel, I. F. 1996, ARA & A, 34, 749
- (31) Sanders, D. B., Soifer, B. T., Elias, J. H., Madore, B. F., Matthews, K., Neugebauer, G., & Scoville, N. Z. 1988, ApJ, 325, 74
- (32) Seaton, M. J. 1979, MNRAS, 187, 73p
- (33) Soifer, B. T., Helou, G., Lonsdale, C. J., Neugebauer, G., Hacking, P., Houck, J. R., Low, F. J., Rice, W., & Rowan-Robinson, M. 1984, ApJ, 283, L1
- (34) Shaya, E., Dowling, D. M., & Currie, D. G. 1994, AJ, 107, 1675
- (35) Storchi-Bergmann, T., Kinney, A. L., & Challis, P. 1995, ApJS, 98, 103
- (36) Taniguchi, Y., & Ohyama, Y. 1998, ApJ, 508, L13
- (37) Taniguchi, Y., Trentham, N., & Shioya, Y. 1998, ApJ, 504, L79
- (38) Vacca, W. D., & Conti, P. S. 1992, ApJ, 401, 543
- (39) Vacca, W. D., Garmany, C. D., & Shull, J. M. 1996, ApJ, 460, 914
- (40) Veilleux S., & Osterbrock, D. E., 1987, ApJS, 63, 295
- (41) Yun, M. S., Hibbard, J. E., & Scoville, N. Z. 1999, in preparation
| Line | (Å) | Emi. or Abs. | (Å) | |
|---|---|---|---|---|
| Galaxy A | ||||
| Ca ii K | 3933.7 | Abs. | 4292.1 | 0.0911 |
| Ca ii H | 3968.5 | Abs. | 4329.1 | 0.0909 |
| CH G band | 4300.0 | Abs. | 4694.5 | 0.0917bbThe redshift is not used for calculating the mean redshift because of the line blending. |
| H | 4861.3 | Abs. | 5305.5 | 0.0914bbThe redshift is not used for calculating the mean redshift because of the line blending. |
| Mg b | 5172.7 | Abs. | 5643.7 | 0.0911bbThe redshift is not used for calculating the mean redshift because of the line blending. |
| Na D | 5893.0aaMean wavelength of the doublet. | Abs. | 6425.5 | 0.0904bbThe redshift is not used for calculating the mean redshift because of the line blending. |
| Galaxy B | ||||
| [O ii] | 3727.4aaMean wavelength of the doublet. | Emi. | 4058.9 | 0.0889bbThe redshift is not used for calculating the mean redshift because of the line blending. |
| H | 4340.5 | Emi. | 4725.1 | 0.0886 |
| H | 4861.3 | Emi. | 5291.0 | 0.0884 |
| [O iii] | 4958.9 | Emi. | 5396.4 | 0.0882 |
| [O iii] | 5006.9 | Emi. | 5448.9 | 0.0883 |
| [N ii] | 6548.1 | Emi. | 7122.3 | 0.0877 |
| H | 6562.8 | Emi. | 7138.3 | 0.0877 |
| [N ii] | 6583.4 | Emi. | 7160.9 | 0.0877 |
| [S ii] | 6716.4 | Emi. | 7305.5 | 0.0877 |
| [S ii] | 6730.8 | Emi. | 7320.9 | 0.0877 |
| Galaxy C | ||||
| Ca ii K | 3933.7 | Abs. | 4290.6 | 0.0907 |
| Ca ii H | 3968.5 | Abs. | 4326.7 | 0.0903 |
| CH G band | 4300.0 | Abs. | 4693.0 | 0.0914bbThe redshift is not used for calculating the mean redshift because of the line blending. |
| H | 4861.3 | Abs. | 5305.7 | 0.0914bbThe redshift is not used for calculating the mean redshift because of the line blending. |
| Mg b | 5172.7 | Abs. | 5642.0 | 0.0907bbThe redshift is not used for calculating the mean redshift because of the line blending. |
| Na D | 5893.0aaMean wavelength of the doublet. | Abs. | 6423.4 | 0.0900bbThe redshift is not used for calculating the mean redshift because of the line blending. |
| Galaxy D | ||||
| H | 4861.3 | Abs. | 5037.7 | 0.0363 |
| Mg b | 5172.7 | Abs. | 5355.9 | 0.0354bbThe redshift is not used for calculating the mean redshift because of the line blending. |
| Na D | 5893.0aaMean wavelength of the doublet. | Abs. | 6103.0 | 0.0356bbThe redshift is not used for calculating the mean redshift because of the line blending. |
| [N ii] | 6583.4 | Emi. | 6819.0 | 0.0358 |
| Object ID | RA(J2000) | DEC(J2000) | Morphology | aaCorrected for the Galactic extinction (see text). | aaCorrected for the Galactic extinction (see text). |
|---|---|---|---|---|---|
| () | () | (mag) | (mag) | ||
| A | 15 34 52.7 | 23 28 48 | E | 15.9 | 22.8 |
| B | 15 34 53.6 | 23 28 21 | S | ||
| C | 15 34 53.7 | 23 28 17 | E | 15.2bbA total magnitude of both B and C. | 23.6bbA total magnitude of both B and C. |
| D | 15 34 04.8 | 23 28 45 | S0 | 14.6 | 22.1 |
| Line | aaObserved emission-line flux corrected for the Galactic extinction (see text) ( erg cm-2 s-1) | bbReddening-corrected emission-line flux (see text) ( erg cm-2 s-1) | ccObserved equivalent width (Å) | ddRest frame equivalent width (Å) |
|---|---|---|---|---|
| [O ii]3727 | 49.5 | 117.4 | 28 | 26 |
| H | 4.7 | 10.3 | 3.7 | 3.4 |
| H | 13.2 | 26.6 | 13 | 12 |
| [O iii]4959 | 2.4 | 4.7 | 2.0 | 1.8 |
| [O iii]5007 | 5.7 | 11.1 | 5.3 | 4.9 |
| [N ii]6548 | 4.6 | 7.3 | 5.4 | 5.0 |
| H | 47.6 | 76.1 | 57 | 52 |
| [N ii]6583 | 13.5 | 21.6 | 16 | 15 |
| [S ii]6717 | 8.0 | 12.6 | 9.6 | 8.9 |
| [S ii]6731 | 5.9 | 9.3 | 7.1 | 6.6 |
| Object ID | RA(J2000) | DEC(J2000) | aaCorrected for the Galactic extinction (see text). | aaCorrected for the Galactic extinction (see text). |
|---|---|---|---|---|
| () | () | (mag) | (mag) | |
| I | 15 34 54.3 | 23 27 59 | 24.5 | 18.2 |
| II | 15 34 54.5 | 23 27 52 | 24.3 | 18.4 |
| III | 15 34 54.8 | 23 27 44 | 24.7 | 18.0 |
| Line | aaObserved emission-line flux corrected for the Galactic extinction (see text) | bbObserved equivalent width. Measurement errors are 50% for all the lines. | ccRest-frame equivalent width | |||
|---|---|---|---|---|---|---|
| (Å) | (Å) | ( erg cm-2 s-1) | (Å) | (Å) | ||
| Galaxy I | ||||||
| Mg ii | 2798 | 4275.9 | 0.5282 | 2.7 | 28 | 18 |
| [O ii] | 3727.4 | 5695.9 | 0.5281 | 5.9 | 220 | 144 |
| [Ne iii] | 3868.8 | 5912.7 | 0.5283 | 0.9 | 27 | 18 |
| H | 4861.3 | 7428.1 | 0.5280 | 1.8 | 57 | 37 |
| [O iii] | 4958.9 | 7577.0 | 0.5280 | 3.1 | 162 | 106 |
| [O iii] | 5006.9 | 7650.5 | 0.5280 | 8.1 | 208 | 136 |
| Galaxy II | ||||||
| [O ii] | 3727.4 | 5701.9 | 0.5297 | 2.8 | 37 | 24 |
| [O iii] | 5006.9 | 7652.0 | 0.5283 | 1.2 | 27 | 18 |
| Galaxy III | ||||||
| [O ii] | 3727.4 | 5674.8 | 0.5225 | 2.8 | 56 | 37 |
| Object ID | ([O ii]) ( erg s-1) | SFR ( y-1) |
|---|---|---|
| I | 8.8 | 4.4 |
| II | 4.1 | 2.1 |
| III | 4.0 | 2.0 |