Early-time spectroscopic observations of
SN 1998aq in NGC 3982
Abstract
Medium resolution spectroscopic observations of SN 1998aq made in April - May, 1998, are presented. We confirm its Type Ia classification based on the prominent Si II 6355 line and other features similar to SNe Ia. No significant sign of hydrogen Balmer-alpha line was seen in high-resolution spectra taken at 8 days before maximum. Preliminary estimate of reddening and distance modulus, based on the correlation between the line depth ratio of two Si II features around 6000 Å and light curves of Type Ia SNe (Riess et al., riess2 (1998)), is presented. Moreover, emission from the core of the Seyfert 2 type host galaxy NGC 3982 has also been detected.
Key Words.:
supernovae: individual – galaxies: Seyfert – techniques: spectroscopic1 Introduction
The number of spectroscopic observations of supernovae increased quickly in this decade, partly due to the advances of CCD-technique and the growing number of supernova searching observational projects (see Filippenko, filip (1997) for a detailed review). In the first half of 1998, three SNe with brightness of about mag (1998S, 1998aq and 1998bu) was discovered together with many more fainter ones. In this paper we report medium-resolution spectroscopic observations of SN 1998aq made shortly before and after maximum light.
SN 1998aq was discovered by M. Armstrong (Hurst et al., hurst (1998)). It has been classified as SN Ia by Ayani & Yamaoka (ayani (1998)) who reported prominent Si II 6355 and other S II, Fe II and Mg II absorption lines which made SN 1998aq similar to the “prototype” SN Ia SN 1994D. The expansion velocity was determined as about 11,000 km/s. They also pointed out the absence of Na D absorption due to probably small interstellar reddening. Shortly later, Berlind & Calkins (see Garnavich et al., garnav (1998)) reported the similarity to SN 1990N based on a spectrum obtained at 1 week before maximum.
Another interesting property of SN 1998aq is that its host galaxy, NGC 3982 (PGC 37520, UGC 6918, IRAS 11538+5524), has a Seyfert 2 type nucleus. This galaxy was a subject of a recent AGN-survey by Ho et al. (ho (1997)). To date, there is an indication that SNe in the host galaxies of AGNs show higher concentration toward the galaxy core with respect to SNe in normal galaxies (Petrosian & Turatto, petros (1990)). This may give evidence on increased star formation rate in the proximity of AGN, but the number of actually observed SNe in such systems is not large, so more data would significantly improve the statistics.
2 Observations
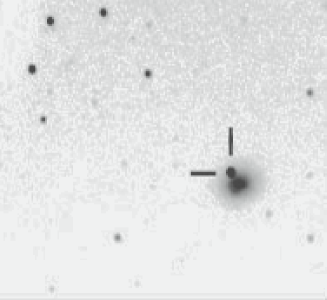
We made medium- and high-resolution spectroscopic observations of SN 1998aq between April 22th and May 27th, 1998 at David Dunlap Observatory, Canada with the 74” Cassegrain telescope. The gratings used were the 150 lines/mm (in 2nd order with an order-separation filter inserted) and the 1800 lines/mm giving 1.3 Å per pixel and 0.2 Å per pixel resolution, respectively. The medium-resolution spectra are presented in Fig. 1 (left panel) where an arbitrary vertical shift has been added to each spectrum for better visibility. The decrease of the signal-to-noise ratio toward the later spectra was due to the faintening and the increasing airmass of the object in May. The data were reduced by standard IRAF routines. FeAr spectral lamp exposures were used for wavelength calibration. Particular attention was payed to remove the background light contamination due to the host galaxy (discussed below) and the night sky. An unfiltered CCD-image showing SN 1998aq in NGC 3982 taken from downtown of Szeged with a 11” Schmidt-Cassegrain telescope and ST-6 camera is presented in the right panel of Fig. 1.


In order to determine the phase of our spectra relative to the light curve of the SN, we collected all available visual observations of SN 1998aq made by amateur astronomers, using the public database of the Variable Star Observers’ Network (VSNET). This light curve is plotted in Fig. 2. The typical uncertainty of the individual points is at least 0.3 mag and the spread of the light curve goes up to 0.5 mag at a given epoch, although the observers used mainly the same sequence of comparison stars. As a first approximation, we estimated the moment of visual maximum light being JD 24,50933. Using this epoch we determined the approximate phase of our spectra as 1 week before maximum, 9 days after maximum and 28 days after maximum, respectively (see also Table 1).
3 Results and discussion
3.1 Spectral characteristics
Although the spectra presented in Fig. 1 clearly have inadequate wavelength coverage for a detailed comparison with other SNe spectra, some basic properties of SNe Type Ia can be recognized in these data. The most prominent feature in the two earlier spectra is the Si II 6355 absorption line as noted by other observers. This is the characteristic feature of SNe Ia (e.g. Filippenko, filip (1997)). On the pre-maximum spectrum, the line profile is asymmetric and has a slight P Cyg-type “bump” toward longer wavelengths, similarly to SN 1994D (Patat et al., patat (1996)). Later, this absorption line deepens and broadens significantly at about 1 month post-maximum, which is also similar to the spectral behaviour of SN 1994D in this wavelength regime, although Berlind & Calkins reported “unusually shallow Type Ia features” (see Garnavich et al., garnav (1998)). The other Si II absorption trough at 5700 Å becomes stronger as the SN gets older, but it also becomes blended from its blue side. Moreover, the broad emission bump at 6500 at days post-maximum, which is probably due to Fe II and Fe III (Filippenko, filip (1997)) is also reproduced well on the third spectrum. These observed features indicate that SN 1998aq closely resembles to a “prototype” SN Ia in the Å spectral interval.
3.2 Radial velocities
We have derived velocities of the expanding gas measuring the Doppler-shift of the line core of the Si II line (Table 1). Such “line-core” velocities have been presented for a number of other SNe Ia by Patat et al. (patat (1996), see their Fig.10). According to that diagram, the velocities of SN 1998aq agree well with those of SN 1994D and SN 1989B. However, as it was also noted by Patat et al. (patat (1996)), the velocities derived from strong lines, such as Si II , are ambiguous, especially at later phases, because these lines are formed over a considerably large velocity range. It would be interesting to derive bisector velocities of both observed and synthesized SN spectra to reveal the effect of velocity gradients, as it was recently done e.g. for Cepheids (Butler et al., butler (1996)). The spectra presented in this paper do not have the necessary signal-to-noise and phase coverage for such purpose.
| J.D. | ||
|---|---|---|
| (days) | ( km/s) | |
| 2450926 | ||
| 2450942 | ||
| 2450961 |
3.3 Preliminary reddening and distance estimates
A method for obtaining “snapshot” distances to SNe Ia has been developed very recently by Riess et al. (riess2 (1998)). The idea is the following: one can calculate the distance of the SN by comparing a single or photometric measurement with a calibrated template SN Ia light curve (describing the absolute magnitude of an “ideal” SN Ia as a function of time) if the phase of the photometric data and the “light-curve parameter” (giving the magnitude difference between the maximum brightness of the observed and the template SN) is known. A template SN Ia light curve has been given by Riess et al. (riess (1996)). For the determination of , a correlation is found between and the ratio of line depths of the Si II absorption lines at 5800 Å and 6150 Å (Nugent et al., nugent (1995); Riess et al., riess2 (1998)).

We tried to apply the method outlined above using the first spectrum, obtained on April 22th. As the first step, we normalized the spectrum to the continuum by fitting a smoothly varying Chebyshev-function to the highest flux levels of the spectrum in order to correct for the steep decline of the intensity toward longer wavelengths. After that, we measured the line depths of the Si II troughs as shown in Fig. 3 (following the prescription given by Nugent et al., nugent (1995)). The ratio, , of these depths were then calculated, resulting in (Si II) = (5800Å)(6150Å) = . Using the linear relationship between (Si II) and at days relative to maximum light (Riess et al., riess2 (1998)), was derived. The low value of means that the light curve of SN 1998aq may not deviate largely from the template SN Ia light curve (but it should, of course, be proven by extensive photometry of the SN, which, unfortunately, was not available for us during the preparation of the manuscript).
Strictly speaking, the calibration of (Si II) uses the phase (in days) relative to the of the SN light curve (Riess et al., riess2 (1998)). Because of the same reason as above, we could only estimate the phase of our spectra using the visual light curve plotted in Fig. 2. However, because of the low value of , this approximation probably does not introduce large errors. Indeed, assuming that the phase of the first spectrum is days, could be obtained which would further reduce the expected difference between the “real” light curve and the template light curve. On the other hand, days is improbable, because the maximum light in occurs earlier than in . Again, this question should be re-investigated using calibrated long-term photometry of SN 1998aq.
As far as the available photometry is concerned, there are some measurements at the earlier phases of SN 1998aq published in IAU Circulars. Although the accuracy of the photometric data published in IAU Circulars is quite variable and sometimes inferior, but, as above, it is the only source of publicly available calibrated photometry of SN 1998aq at the date of the preparation of this paper.
We have collected and magnitudes, observed at April 20.904 UT (Hanzl & Caton, hanzl (1998)). These measurements were obtained with an ST-7 CCD-camera attached to a 40 cm Cassegrain telescope, according to one of the authors’ (Hanzl) description. The accuracy of these data should be much higher than the amateur visual light estimates showed in Fig. 2 (which is used only for estimating the phases of our spectroscopic measurements). Hanzl (hanzl2 (1998)) gives error estimates of his measurements in a follow-up publication, and typical values are and mag. However, the anonymous referee of the present paper argued that his own high-precision photometry gave on April 20. This means that the colour of SN 1998aq may be much bluer than the single measurement of Hanzl & Caton (hanzl (1998)) indicates. We cannot discuss this discrepancy further, because it is based on yet unpublished measurements, except to take it into account in estimating the errors (see below).
Adopting days as the phase of these photometric data, the following relations have been applied to estimate the reddening and the distance modulus (Riess et al., riess (1996)):
| (1) |
and
| (2) |
We have adopted and from Table 2 of Riess et al. (riess (1996)) and the standard value of the galactic extinction law (). This last assumption means that the reddening ratio in the Milky Way can be used to describe the reddening in distant galaxies, which was also favored by Riess et al. (riess (1996)).

We tried to estimate the colour excess in two ways. First, we adopted (Hanzl & Caton, hanzl (1998)), (Riess et al., riess (1996)) and used Eq.(1) to get mag. Second, we used the All-Sky Reddening Map published very recently by Schlegel et al. (schlegel (1998)). This gives the reddening toward a specified direction based on a calibration between colour excess and the infrared flux at 100. The query in the direction of SN 1998aq resulted in mag. This low reddening value supports the suspicion that the observed color of SN 1998aq around maximum was actually bluer than the only one published measurement of Hanzl (Hanzl & Caton, hanzl (1998)). On the other hand, the host galaxy NGC 3982 has an active nucleus of a Seyfert 2 type (see the next section), thus, higher dust concentration within the host galaxy might not be unrealistic. If this were the case, then the reddening of SN 1998aq would be mainly due to dust absorption in its host galaxy, rather than that in the Milky Way. Finally, we can consider mag as the unweighted average of the two data above, emphasizing the urgent need for published precise photometric measurements to solve this important and interesting problem.
In order to derive the distance modulus via Eq.(2), the following data were adopted: mag (Hanzl & Caton, hanzl (1998)), (Riess et al., riess (1996)) and mag (from the values above). The uncertainty of and was estimated as being and mag, respectively, allowing day error in the epoch of the spectroscopic measurement. From the reddening estimated above, the total absorption is with stronger probability that the actual value is lower than this estimate.
Substituting these values into Eq.(2), we get the extinction-free distance modulus as mag. The distance of the SN, corrected for interstellar absorption, is Mpc. However, it is stressed, that this value can be considered only preliminary, which need further confirmation based on much more extensive datasets. The relatively large uncertainty of the distance reflects mainly the lack of precise photometric information on this object.
3.4 Hydrogen lines
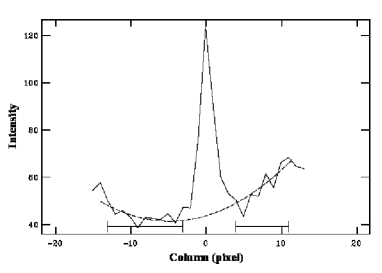
There have been controversial evidence of hydrogen Balmer-lines in the spectra of SNe Ia presented in the literature (see Filippenko, filip (1997) for review). In order to study the presence/absence of any feature in SN 1998aq, two consecutive spectra with higher resolution was obtained on April 21th, about 8 days before maximum. The contamination of the light of the host galaxy was removed by fitting a parabolic function outside the profile of the SN spectrum (Fig. 4, bottom panel), similarly to Della Valle et al. (della (1996)). As it can be seen in the upper panel of Fig. 4, no convincing detection of could be made.
As it has been mentioned above, the host galaxy, NGC 3982, has a Seyfert 2 type nucleus showing and some other forbidden lines in emission (Ho et al., ho (1997)). We have obtained one spectrum of the core region of NGC 3982 which is plotted in Fig. 5. The emission structure around 6600 Å consisting of , N II and S II is clearly detected, although the profile shapes and relative strengths are different from those presented by Ho et al. (ho (1997)). This is probably due to our lower quality spectra and the lack of sophisticated starlight-subtraction such as that applied by Ho et al. (ho (1997)).

4 Summary
The summary of the results presented in this paper is as follows:
1. We obtained medium-resolution spectra around 6000 Å of SN 1998aq before and after maximum. Based on the spectral features and the time evolution of the spectrum, the classification of Type Ia is confirmed. The decreasing expansion velocities are in agreement with other SN Ia velocities.
2. We applied the “snapshot distance estimate” method developed by Nugent et al. (nugent (1995)) and Riess et al. (riess2 (1998)) to the spectrum of SN 1998aq taken on April 22th. The analysis resulted in mag and mag as the value of the reddening and the extinction-free distance modulus of SN 1998aq, respectively. It is probable that the correct distance modulus is larger than the mean value presented above, due to uncertainties in the reddening.
3. High-resolution spectra obtained 8 days before maximum do not contain any convincing feature that could be attributed to . This is also in agreement with the previous lack of detection of hydrogen lines in the spectra of SNe Ia. On the other hand, there is a pronounced emission emerging from the Seyfert 2 type nucleus of the host galaxy NGC 3982 which was necessary to be taken into account during the reduction of the high-resolution spectrum of SN 1998aq.
Acknowledgements.
This research was supported by Hungarian OTKA Grants #F022249, #T022259 and Foundation for Hungarian Education and Science (AMFK). The NASA ADS Abstract Service, the Canadian Astronomy Data Center and the Variable Star Network (VSNET) was used to access data and references. The All-Sky Reddening Map has been downloaded from the URL http://astro.berkeley.edu/davis/dust. The availability of these services are gratefully acknowledged.References
- (1) Ayani K, Yamaoka H. 1998, IAU Circ. 6878, 2
- (2) Butler R.P., Bell R.A., Hindsley R.B. 1996, ApJ 461, 362
- (3) Della Valle M., Benetti S., Panagia N. 1996, ApJ 459, L23
- (4) Filippenko A.V. 1997, ARA&A 35, 309
- (5) Garnavich P., Jha S., Kirshner R., et al. 1998, IAU Circ. 6880, 2
- (6) Hanzl D. 1998, IAU Circ. 6937, 2
- (7) Hanzl D., Caton D.B. 1998, IAU Circ. 6898, 5
- (8) Ho L.C., Filippenko A.W., Sargent W.L., Peng C.Y. 1997, ApJS 112, 391
- (9) Hurst G.M., Armstrong M., Arbour R. 1998, IAU Circ. 6875, 1
- (10) Nugent P., Phillips M., Barion E., Branch D., Hauschildt P. 1995, ApJ 455, L147
- (11) Patat F., Benetti S., Cappellaro E., Danziger I.J., Della Valle M. 1996, MNRAS 278, 111
- (12) Petrosian A.R., Turatto M. 1990, A&A 239, 63
- (13) Riess A.G., Press W.H., Kirshner R.P. 1996, ApJ 473, 88
- (14) Riess A.G., Nugent P., Filippenko A.V., Kirshner R.P., Perlmutter S. 1998, ApJ in press (astro-ph/9804065)
- (15) Schlegel D.J., Finkbeiner D.P., Davis M. 1998, ApJ 500, 525