Far–infrared Point Sources
Abstract
The analysis of the submm anisotropies that will be mapped by the forthcoming map and planck satellites requires careful foreground subtraction before measuring CMB fluctuations. Among these, the foreground due to IR/submm thermal radiation from dusty sources was poorly known until recent observational breakthroughs began unveiling the properties of these objects. We hereafter briefly review the observational evidence for a strong evolution of IR/submm sources with respect to the local universe explored by iras. We present the basic principles of a new modeling effort where consistent spectral energy distributions of galaxies are implemented into the paradigm of hierarchical clustering with the fashionable semi–analytic approach. This model provides us with specific predictions in IR/submm wavebands, that seem to reproduce the current status of the observations and help assessing the capabilities of forthcoming instruments to pursue the exploration of the deep universe at IR/submm wavelengths. Finally, the ability of the planck High Frequency Instrument all–sky survey to produce a catalogue of dusty sources at submm wavelengths is briefly described.
Institut d’Astrophysique de Paris, CNRS, 98bis Bld Arago, F–75014 Paris
1. Introduction
The accurate measurement of the fluctuations of the Cosmic Microwave Background down to scales of a few arcmins by the forthcoming satellite missions map and planck will require a thorough analysis of all the astrophysical sources of submm/mm anisotropies, and a careful separation of the various foreground components (Bouchet et al. 1996, Gispert & Bouchet 1997, Tegmark & Efstathiou, 1996, Tegmark, 1998, Hobson et al. 1998a, Bouchet & Gispert 1999). Among them, the foreground due to resolved/unresolved IR/submm galaxies that are present at all redshifts on the line of sight was poorly known, until observations and analyses in the last three years began unveiling the “optically dark” (and infrared–bright) side of galaxy evolution at cosmological distances. In parallel to this observational breakthrough, a strong theoretical effort has opened up the way to a modelling of these galaxies that was able to implement the basic astrophysical processes ruling IR/submm emission in a consistent way. As a consequence of this, it is now possible to have a more general view on the problems of foreground separation, and on the capabilities of CMB missions to put new constraints on the number and properties of these sources.

In the local universe, we know from iras observations that about 30 % of the bolometric luminosity of galaxies is radiated in the IR (Soifer & Neugebauer 1991). Local galaxies can be classified in a luminosity sequence from spirals (e.g the Milky Way – the brightest spirals in the IR have a bar), and mild starbursts (e.g. M82), to the “Luminous Infrared Galaxies” (say, with ), and “Ultra–Luminous Infrared Galaxies” (say, with ) that radiate more than 95 % of their bolometric luminosity in the IR/submm.
The IR/submm emission of these sources is due to dust that absorbs UV and optical light, and thermally reradiates with a broad spectral energy distribution ranging from a few m to a few mm. Most of the heating is due to young stellar populations but, in the faintest objects, the average radiation field due to old stellar populations can be the main contributor, and, in the brightest objects (especially the ULIRGs), the question of the fraction of the heating that is due to a possible Active Galactic Nucleus is still difficult to assess. However, recent work based on iso observations shows that starbursting still dominates in 80 % of ULIRGs, whereas the AGNs power only the brightest objects (Genzel et al. 1998, Lutz et al. 1998).
Now, IR/submm observations are beginning to unveil what actually happened at higher redshift. The detection of the “Cosmic Infrared Background” (hereafter CIRB) at a level twice as high as the “Cosmic Optical Background” (hereafter COB) has shown that about 2/3 of the luminosity budget of galaxies is emitted in the IR/submm range (Puget et al. 1996). In the same time, the first deep surveys at submm wavelengths have discovered the sources that are responsible for the CIRB, with a number density much larger than the usual predictions based on our knowledge of the local universe (Smail et al. 1997). The optical follow–up of these sources is still in progress, but it appears that some (most ?) of them should be the moderate– and high–redshift counterparts of the local LIRGs and ULIRGs discovered by the iras satellite and thoroughly studied by the iso satellite.
We shall hereafter focus on these dusty sources with thermal radiation, and we refer the reader to the paper by Toffolatti and coworkers (this volume), for the description of the foreground due to radiosources that emit free–free and synchrotron radiations at larger wavelengths.

A consistent approach to the early evolution of galaxies is particularly important for any attempt at predicting their submm properties. Three basic problems have to be kept in mind, that explain why it is so difficult, starting from general ideas about galaxy evolution, to get a correct assessment of the number density of faint submm sources and of the level of submm fluctuations they generate.
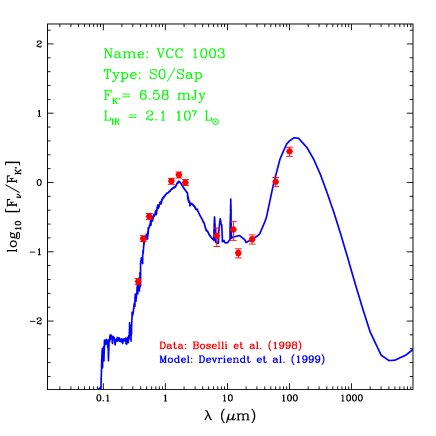
First, it is difficult to extrapolate the IR/submm properties of galaxies from our knowledge of their optical properties. It is well known that there is no correlation between the optical and IR fluxes – see e.g. Soifer et al. (1987) for an analysis of the statistical properties of the “Bright Galaxy Sample”. Interestingly, the galaxies with the highest luminosities also emit most of their bolometric luminosity in the IR. If young stars are the dominant source of heating, it turns out that the strongest starbursts mainly emit in the IR/submm. Fig. 1 shows a sequence of spectral energy distributions for local galaxies with various IR luminosities, very much in the spirit of fig. 2 of Sanders & Mirabel (1996). The sources have been modelled by Devriendt et al. (1999, see section 5) under the assumption that starbursts are the dominant source of heating. Now, it is known that local LIRGs and ULIRGs are interacting systems and mergers (e.g. Sanders & Mirabel 1996). It is consequently plausible that their number density should increase with redshift, when more fuel was available for star formation and more interactions could trigger it. As a matter of fact, the Hubble Deep Field (HDF, Williams et al. 1996) has unveiled a large number of irregular/peculiar objects undergoing gravitational interactions (Abraham et al. 1996). Such a large number of interacting systems is of course predicted by the paradigm of hierarchical clustering, but the quantitative modelling of the merging rates of galaxies, and of the influence of merging on star formation is highly uncertain.
Second, we might have kept so far the prejudice that high–redshift galaxies have little extinction, simply because their heavy–element abundances are low (typically 1/100 to 1/10 of solar at ). However, low abundances do not necessarily mean low extinction. For instance, if we assume that dust grains have a size distribution similar to the one of our Galaxy ( with ), and are homogeneously distributed in a region with radius , the optical depth varies as , whereas the total dust mass varies as . For a given dust mass and size distribution, there is more extinction where grains are small, and close to the heating sources. This is probably the reason why Thuan et al. (1998) observed a significant dust emission in the extremely metal–poor galaxy SBS0335-052. In this context, modelling chemical evolution and transfer is not an easy task.
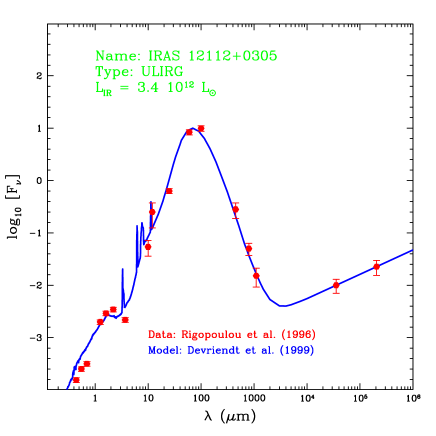
Third, distant galaxies are readily observable at submm wavelengths. Fig. 2 shows model spectra of an ULIRG as it would be observed if placed at different redshifts. There is a wavelength range, between m and mm, in which the distance effect is counterbalanced by the “negative k–correction” due to the rest–frame emission maximum at m. In this range, the apparent flux of galaxies depends weakly on redshift to the point that, evolution aside, a galaxy might be easier to detect at than at . The observer–frame submm fluxes, faint galaxy counts, and diffuse background of unresolved galaxies are consequently very sensitive to the early stages of galaxy evolution. Note that this particular wavelength range brackets the maximum of emission of the CMB. As a consequence, any uncertainty in the modelling of galaxy evolution at high will strongly reflect on the results of the faint counts of resolved sources, and on the fluctuations of the foreground of unresolved sources.
In sections 2 and 3, we report respectively on the recent observation of the CIRB, and the faint submm counts with the iso satellite and the SCUBA instrument on the James Clerk Maxwell Telescope (see the review by Mann and coworkers in this volume). In section 4, we briefly mention the efforts to correct the optical surveys for the effect of extinction, that give a lower limit of the number of submm sources from the number of sources detected at optical wavelengths. In section 5, we resume various attempts developped so far to compute consistent optical/IR spectra, and to model IR/submm counts. In section 6, we summarize recent developments of the semi–analytic modelling of galaxy formation and evolution where the computation of dust extinction and emission is explicitly implemented. Finally, in section 7, we sketch an overview of the sensitivities of forthcoming instruments that should greatly improve our knowledge of IR/submm sources, and we emphasize the capability of the planck High Frequency Instrument to get an all–sky survey of bright, dusty sources at submm wavelengths.
2. The Cosmic Infrared Background
The epoch of galaxy formation can be observed by its imprint on the background radiation that is produced by the accumulation of the light of extragalactic sources along the line of sight. The direct search for the COB currently gives only upper limits. However, estimates of lower limits can be obtained by summing up the contributions of faint galaxies. The shallowing of the faint counts obtained in the HDF (Williams et al. 1996) suggests that these lower limits are close to convergence.
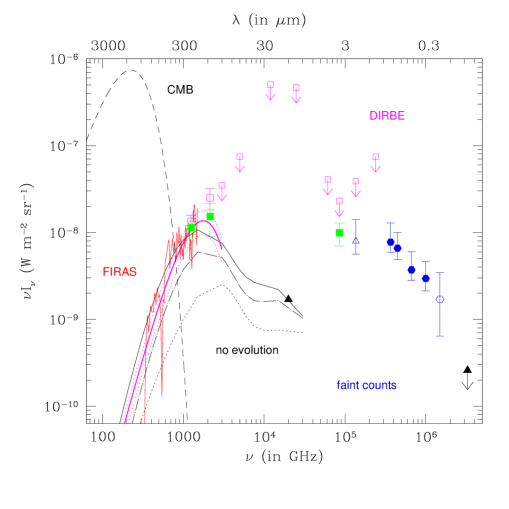
In the submm range, Puget et al. (1996) have discovered an isotropic component in the FIRAS residuals between 200 m and 2 mm. This measure was confirmed by subsequent work in the cleanest regions of the sky (Guiderdoni et al. 1997), and by an independent determination (Fixsen et al. 1998), giving a mean value of the background where is the wavelength in units of 100 m. The analysis of the DIRBE dark sky has also led to the detection of the isotropic background at 240 and 140 m, and to upper limits at shorter wavelengths down to 2 m (Schlegel et al. 1998, Hauser et al. 1998). Recently, a measure at 3.5 m was proposed by Dwek & Arendt (1998). The results of these analyses seem in good agreement, though the exact level of the background around 140 and 240 m is still a matter of debate. The controversy concerns the correction for the amount of Galactic dust in the ionized gas uncorrelated with the HI gas. A new assessment of the issue by Lagache et al. (1999) leads to values of the CIRB that are in good agreement with the fit of FIRAS data by Fixsen et al. (1998), and to values at 140 and 240 m that are lower than in Hauser et al. (1998). Figure 3 displays the various determinations.
It appears very likely that this isotropic background is the long–sought CIRB (Puget et al. 1996, Dwek et al. 1998). As shown in fig. 3, its level is about 5–10 times the no–evolution prediction based on the local IR luminosity function determined by iras. There is about twice as much flux in the CIRB than in the COB. If the dust that emits at IR/submm wavelengths is mainly heated by young stellar populations, the sum of the fluxes of the CIRB and COB gives the level of the Cosmic Background associated with stellar nucleosynthesis (Partridge & Peebles 1967). The bolometric intensity (in W m-2 sr-1) is :
| (1) |
where is the physical emissivity due to young stars at cosmic time , and is the effective redshift for stellar He and metal nucleosynthesis. An approximate census of the local density of heavy elements Mpc-3, taking into account the metals in the hot gas of rich galaxy clusters (Mushotzky & Loewenstein 1997) gives an expected bolometric intensity of the background nW m-2 sr-1. This value is roughly consistent with the observations for – 2.

Of course, it is not clear yet whether star formation is responsible for the bulk of dust heating, or there is a significant contribution of AGNs. In order to address this issue, one has first to identify the sources that are responsible for the CIRB. The question of the origin of dust heating in heavily–extinguished objects is a difficult one, because both starburst and AGN rejuvenation can be fueled by gas inflows triggered by interaction, and IR/submm spectra can be very similar if extinction is large. However, according to Genzel et al. (1998), the starburst generally contributes to 50–90 % of the heating in local ULIRGs. About 80 % of the ULIRGs in the larger local sample of Lutz et al. (1998) are dominated by the starburst, but the trend decreases with increasing luminosity, and the brightest objects are AGN–dominated. Now, it is very likely that the high–redshift counterparts of the local LIRGs and ULIRGs are responsible for the CIRB. However the redshift evolution of the fraction and power of AGNs that are harbored in these distant objects is still unknown.
3. Far–infrared galaxies at high redshift
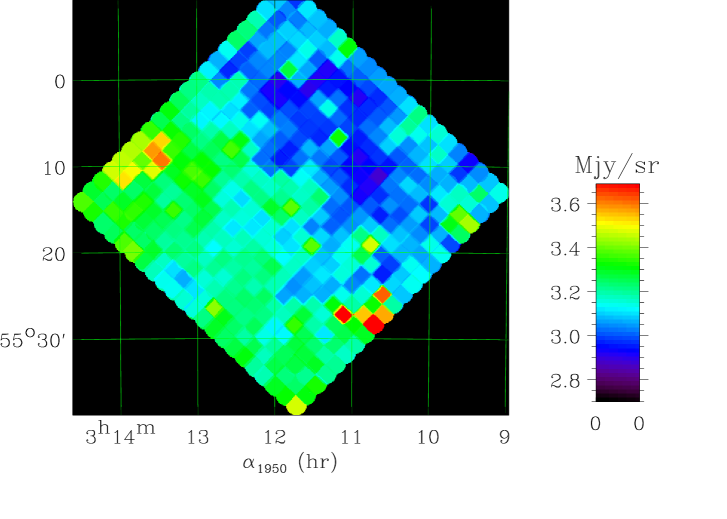
Various submm surveys have been achieved or are in progress. The FIRBACK program is a deep survey of 4 deg2 at 175 m with the ISOPHOT instrument aboard iso. The analysis of about 1/4 of the Southern fields (that is, of 0.25 deg2, see fig. 4) unveils 24 sources (with a flux limit mJy), corresponding to a surface density five times larger than the no–evolution predictions based on the local IR luminosity function (Puget et al. 1999). It is likely that we are actualy seeing the maximum emission bump at 50–100 m redshifted at cosmological distances, rather than a local population of sources with a very cold dust component, which seems to be absent from the shallow ISOPHOT survey at 175 m (Stickel et al. 1998). The total catalogue of the 4 deg2 will include about 275 sources (Dole et al. 1999). The radio and optical follow–up for identification is still in progress. This strong evolution is confirmed by the other 175 m deep survey by Kawara et al. (1998).
The ISOCAM deep surveys at 15 m also conclude to a significant evolution of the sources (Oliver et al. 1997, Aussel et al. 1998, Elbaz et al. 1998, 1999). Most of the sources identified so far by the optical follow–up have typical redshifts , and optical colours similar to those of field galaxies, with morphologies that frequently have signs of interaction. The surveys seem to show a population of bright peculiar galaxies, starbursts, LIRGs, and AGNs. The observer–frame 15 m waveband corresponds to rest–frame wavelengths that probe the properties of PAH and very small grains, at the depth of the survey. The extent to which the 15 m flux is related to the bulk of IR/submm emission produced by star formation is under study.
Various deep surveys at 850 m have been achieved with the SCUBA instrument at the JCMT (Smail et al. 1997, Hughes et al. 1998, Barger et al. 1998, Eales et al. 1998). They also unveil a surface density of sources (with mJy) much larger than the no–evolution predictions (by two or three orders of magnitude !). The total number of sources discovered in SCUBA deep surveys now reaches about 35 (see e.g. Blain et al. 1998) and should rapidly increase. The tentative optical identifications seem to show that these objects look like distant LIRGs and ULIRGs (Smail et al. 1998, Lilly et al. 1999). In the HDF, 4 of the brightest 5 sources seem to lie between redshifts 2 and 4 (Hughes et al. 1998), but the optical identifications are still a matter of debate (Richards, 1998). The source SMM 02399-0136 at , which is gravitationally amplified by the foreground cluster A370, is clearly an AGN/starburst galaxy (Ivison et al. 1998, Frayer et al. 1998).
4. The optical view and the issue of extinction
Recent observational breakthroughs have made possible the measurement of the Star Formation Rate (SFR) history of the universe from rest–frame UV fluxes of moderate– and high–redshift galaxies (Lilly et al. 1996, Madau et al. 1996, 1998, Steidel & Hamilton 1993, Steidel et al. 1996, 1999). Since the early versions of the reconstruction of the cosmic SFR density, much work has been done to address dust issues. However, a complete assessment of the effect of extinction on UV fluxes emitted by young stellar populations, and of the luminosity budget of star–forming galaxies is still to come. Dust seems to be present even at large redshifts, since the optical spectrum of a gravitationally–lensed galaxy at (Franx et al. 1997) already shows a reddening factor amounting to (Soifer et al. 1998).
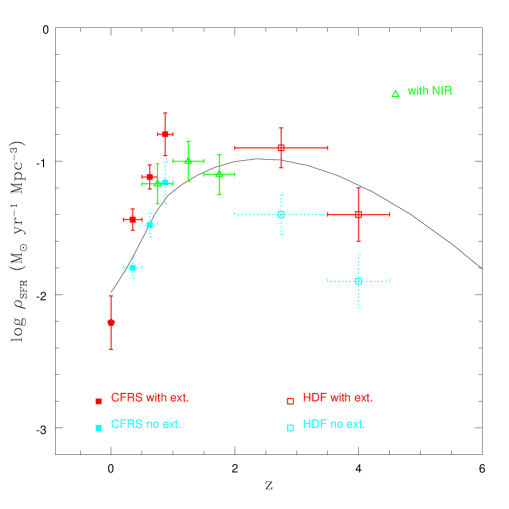
The cosmic SFR density determined only from the UV fluxes of the Canada–France Redshift Survey has been recently revisited with optical, IR, and radio observations. The result is an upward correction of the previous values by an average factor 2.9 (Flores et al. 1999). At higher redshift, various authors have attempted to estimate the extinction correction and to recover the fraction of UV starlight absorbed by dust (e.g. Meurer et al. 1997, Pettini et al. 1998). It turns out that the observed slope of the UV spectral energy distribution (say, around 2200 Å) is flatter than the standard value computed from models of spectrophotometric evolution. The derived extinction corrections are large and differ according to the method. For instance, Pettini et al. (1998) and coworkers fit a typical extinction curve (the Small Magellanic Cloud one) to the observed colors, whereas Meurer et al. (1997) and coworkers use an empirical relation between and the FIR to 2200 Å luminosity ratio in local starbursts. The former authors derive resulting in a factor 2.7 absorption at 1600 Å, whereas the latter derive resulting in a factor 10 absorption. This discrepancy suggests sort of a bimodal distribution of the young stellar populations : the first method would take into account the stars detected in the UV with relatively moderate reddening/extinction, while the second one would phenomenologically add the contributions of these “apparent” stars and of heavily–extinguished stars. Fig. 5 shows the cosmic SFR comoving density in the early version (no extinction), and after the work by Flores et al. (1999) at and the extinction correction derived by Pettini et al. (1998) at higher redshift.
The broad maximum observed at to 3 (see fig. 5) seems to be correlated with the decrease of the cold–gas comoving density in damped Lyman– systems between and (Lanzetta et al. 1995, Storrie–Lombardi et al. 1996). These results nicely fit in a view where star formation in bursts triggered by interaction/merging consumes and enriches the gas content of galaxies as time goes on. It is common wisdom that such a qualitative scenario is expected within the paradigm of hierarchical growth of structures. The implementation of hierarchical galaxy formation in semi–analytic models confirms this expectation (e.g. Baugh et al. 1998, and references therein). The question is to know whether the observations of the optically dark side of galaxies could modify this view significantly.
5. Modelling dust spectra and IR/submm counts
Various models have been proposed to account for the IR/submm emission of galaxies and to predict forthcoming observations. The level of sophistication (and complexity) increases from pure luminosity and/or density evolution extrapolated from the iras local luminosity function with laws, and modified black–body spectra, to physically–motivated spectral evolution.
The evolution of the IR/submm luminosities can be computed from the usual modelling of spectrophotometric evolution, by implementing the involved physical processes (stellar evolutionary tracks and stellar spectra, chemical evolution, dust formation, dust heating and transfer, dust thermal emission). Dwek (1998) tried to explicitly model the processes of dust formation and destruction (see references therein for a review of this complicated issue). Most models prefer to assume simple relations between the dust content and the heavy–element abundance of the gas. The simplest assumption is a dust–to–gas ratio that is proportional to the heavy–element abundances.
Guiderdoni et al. (1996, 1997, 1998) proposed a consistent modelling of IR/submm spectra that was designed to be subsequently implemented in semi–analytic models of galaxy formation and evolution (see section 6). The values of the free parameters that appear in this modelling (gas mass and metallicity, radius of the gaseous disk) are readily computable in semi–analytic models for the overall population of galaxies. The IR/submm spectra of galaxies are computed according to Guiderdoni & Rocca–Volmerange (1987), as follows :
-
1.
follow chemical evolution of the gas ;
-
2.
implement extinction curves which depend on metallicity according to observations in the Milky Way, the LMC and SMC ;
-
3.
compute where and are the gas metallicity and column density, for 2000 Å (and 1.35 below), and is the Milky Way extinction curve ;
-
4.
assume the so–called “slab” or oblate spheroid geometries where the star and dust components are homogeneously mixed with equal height scales. The choice of these simple geometries for transfer is motivated by studies of nearby samples (Andreani & Franceschini 1996) ;
-
5.
compute a spectral energy distribution by assuming a mix of various dust components (PAH, very small grains, big grains) according to Désert et al. (1990). The contributions are fixed in order to reproduce the observational correlation of iras colours with total IR luminosity (Soifer & Neugebauer 1991).
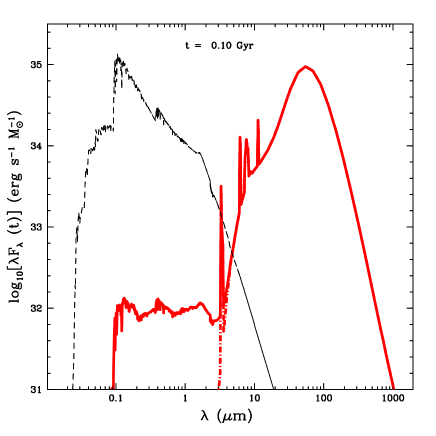
Fig. 6 gives the luminosity sequence from Guiderdoni et al. (1998). Franceschini et al. (1991, 1994, and other papers of this series) follow the same scheme for items 1, 2, 3, 4, and use slightly different IR/submm templates, whereas Fall et al. (1996) basically use constant dust–to–metal ratios and black–body spectra. Recently, Silva et al. (1998) proposed a more sophisticated treatment in which transfer is computed in molecular clouds. The method of Guiderdoni et al. (1998) has been extended to obtain far–UV to radio spectra, and to study local templates by Devriendt et al. (1999). Fig. 7 shows the predicted optical/IR/submm spectrum of an ULIRG, and fig. 8 and 9 display examples of fits for observed objects (a spiral galaxy and an ULIRG) from this latter paper.
These spectra can subsequently be used to model IR/submm counts. The simplest idea is to implement luminosity and/or number evolution which are parameterized as power laws of (e.g. Blain and Longair 1993a, Pearson & Rowan–Robinson 1996 ; see also references in Lonsdale, 1996). These power laws are generally derived from fits of the slope of iras faint counts (which do not probe deeper than ). Then they are extrapolated up to redshifts of a few units. Unfortunately, various analyses of iras deep counts yield discrepant results at mJy, and the amount of evolution is a matter of debate (see e.g. Bertin et al. 1997, for a new analysis and discussion). This uncertainty increases in the extrapolation at higher .
6. Semi–analytic modelling
These classes of models assume that all galaxies form at the same redshift . But the paradigm of the hierarchical growth of structures implies that there is no clear–cut redshift . In this paradigm, the modelling of dissipative and non–dissipative processes ruling galaxy formation (halo collapse, cooling, star formation, stellar evolution and stellar feedback to the interstellar medium) has been achieved at various levels of complexity, in the so–called semi–analytic approach which has been successfully applied to the prediction of the statistical properties of galaxies (White & Frenk 1991; Lacey & Silk 1991, Kauffmann et al. 1993, 1994; Cole et al. 1994; Somerville & Primack 1999 ; see other papers of these series). In spite of differences in the details, the conclusions of these models in the UV, visible and (stellar) NIR are remarkably similar.
A first attempt to compute the IR evolution of galaxies with the Press–Schechter formalism has been proposed by Blain & Longair (1993a,b), but with a crude treatment of dissipative processes. In Guiderdoni et al. (1996, 1997, 1998), we extend this approach by implementing spectral energy distributions in the IR/submm range. As a reference, we take the standard CDM case with =50 kms-1 Mpc-1, , and . We assume a Star Formation Rate , with . The efficiency parameter gives a nice fit of local spirals. The robust result of this type of modelling is a cosmic SFR history that is too flat with respect to the data.

As a phenomenological way of reproducing the steep rise of the cosmic SFR history from to , we introduce a “burst” mode of star formation involving a mass fraction that increases with as (similar to the pair rate), with ten times higher efficiencies . The predicted cosmic SFR density is given in fig. 5. The resulting model, called “model A” does not predict enough flux at IR/submm wavelengths to reproduce the level of the CIRB. This is sort of a minimal model that fits the COB and extrapolates the IR/submm fluxes from the optical (see section 4 on extinction). In order to increase the IR/submm flux, we have to assume that a small fraction of the gas mass (typically less than 10 %) is involved in star formation with a top–heavy IMF in heavily–extinguished objects (ULIRG–type galaxies). Then a sequence of models is derived. The amount of ULIRG can be normalized e.g on the local iras luminosity function (to reproduce the iras bright counts) and on the level of the CIRB. The so–called “model E” normalized to the flux level determined in Guiderdoni et al. (1997) (see fig. 3) is hereafter used to predict faint counts and redshift distributions. An extension to NIR and visible counts is given in Devriendt & Guiderdoni (1999).
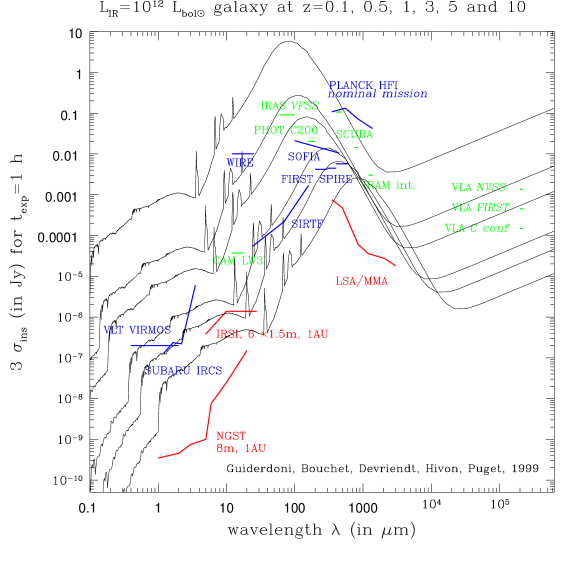
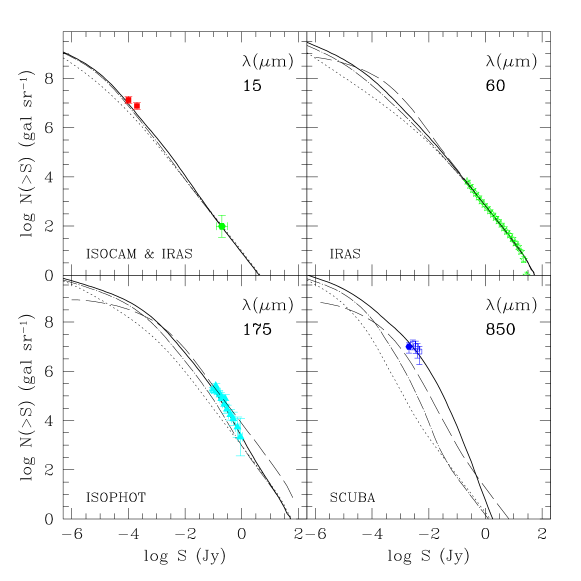
Fig. 10 and 11 give the predicted number counts and redshift distributions at 15, 60, 175, and 850 m for this model, that have been produced in Guiderdoni et al. (1998) before the publication of the ISOPHOT and SCUBA faint counts (their fig. 17). The agreement of the predicted number counts with the data seems good enough to suggest that these counts do probe the evolving population contributing to the CIRB. The model shows that 15 % and 60 % of the CIRB respectively at 175 m and 850 m are built up by objects brighter than the current limits of ISOPHOT and SCUBA deep fields. The predicted median redshift of the iso–HDF is . It increases to for the deep ISOPHOT surveys, and to for SCUBA, though the latter value seems to be very sensitive to the details of evolution. The model by Toffolatti et al. (1998) is also shown in fig. 10. It gives more bright sources and less faint sources at submm wavelengths.

7. Future instruments
Fig. 12 gives the far–UV to submm spectral energy distribution that is typical of a ULIRG at various redshifts. This model spectrum is taken from the computation of Devriendt et al. (1999). The instrumental sensitivities of various past and on–going satellite and ground–based instruments are plotted on this diagram : the iras Very Faint Source Survey at 60 m, iso with ISOCAM at 15 m, and ISOPHOT at 175 m, the IRAM interferometer at 1.3 mm, SCUBA at 450 and 850 m, and various surveys with the VLA. Forthcoming missions and facilities include wire, sirtf, SOFIA, the planck High Frequency Instrument, the first Spectral and Photometric Imaging REceiver, and the imaging modes of the SUBARU IRCS and VLT VIRMOS instruments. Finally, the capabilities of the ngst, LSA/MMA, and Infrared Space Interferometer (darwin) are also plotted.
The final sensitivity of the next–generation instruments observing at IR and submm wavelengths (wire, sirtf, SOFIA, planck, first) is going to be confusion limited. However, the observation of a large sample of ULIRG–like objects in the redshift range 1–5 should be possible. More specifically, the all–sky shallow survey of planck HFI, and the medium–deep survey of first SPIRE (to be launched by ESA in 2007), will respectively produce bright ( a few 100 mJy) and faint ( a few 10 mJy) counts that will be complementary.

Table 1 resumes the various sources of fluctuation in the six bands of planck HFI (Bersanelli et al. 1996, and planck HFI Consortium, 1998). The confusion limit due to unresolved sources in beam has been roughly estimated with the theoretical faint counts from model E, according to the formula . The values and have been computed iteratively with . The 1 total fluctuation is . However, this does not give a sound estimate of what will actually be possible with planck, once proper algorithms of filtering and source extraction are implemented. Source extraction can be studied on simulated maps. Tegmark & de Oliveira–Costa (1998) showed that (i) is about 40 to 100 mJy for the HFI frequencies after filtering, (ii) 40 000 and 5000 sources are expected (at the level in 8 sr) respectively at 857 GHz and 545 GHz, and (iii) the CMB reconstruction is not jeopardized by the presence of point sources at the level predicted by the models. Similar results are obtained by Hobson et al. (1998b) with a maximum–entropy method on mock data (Hobson et al. 1998a). In both estimates, source counts and source confusion are based on the predicted counts of Toffolatti et al. (1998), which differ from ours : Toffolatti’s counts are higher at the bright end, and fainter at the faint end ; hence his source confusion is lower. Table 1 gives the number densities expected with flux limits of 100 mJy and 500 mJy, according to Guiderdoni et al. (1998). The reader is invited to note the strong sensitivity of the counts to the exact flux limit. So the expectations of source counts with planck (and first) are severely model–dependent. The on–going follow–up of ISOPHOT and SCUBA sources will eventually give redshift distributions that will strongly constrain the models and help improving the accuracy of the predictions.
As far as first is concerned, a 10 deg2 survey with SPIRE will result in sources (first SPIRE Consortium, 1998). The study of the and colors are suited to point out sources which are likely to be at high redshifts. These sources can be eventually followed at 100 and 170 m by the first Photoconductor Array Camera & Spectrometer and by the FTS mode of SPIRE, to get the spectral energy distribution at m with a typical resolution . After a photometric and spectroscopic follow–up, the submm observations will readily probe the bulk of (rest–frame IR) luminosity associated with star formation. The reconstruction of the cosmic SFR comoving density will thus take into account the correct luminosity budget of high–redshift galaxies. However, the spatial resolution of the submm instruments will be limited, and only the LSA/MMA should be able to resolve the IR/submm sources and study the details of their structure.
| GHz | arcmin | mJy | mJy | mJy | mJy | mJy | in 1 sr | in 1 sr |
| (1) | (2) | (3) | (4) | (5) | (6) | (7) | (8) | (9) |
| 857 | 5 | 43.3 | 64 | 0.1 | 146 | 165 | 120000 | 2500 |
| 545 | 5 | 43.8 | 22 | 3.4 | 93 | 105 | 37000 | 1200 |
| 353 | 5 | 19.4 | 5.7 | 17 | 45 | 53 | 6800 | 20 |
| 217 | 5.5 | 11.5 | 1.7 | 34 | 17 | 40 | 250 | 1 |
| 143 | 8.0 | 8.3 | 1.4 | 57 | 9.2 | 58 | – | – |
| 100 | 10.7 | 8.3 | 0.8 | 63 | 3.8 | 64 | – | – |
8. Conclusions
-
1.
High–redshift galaxies emit much more IR than predictions based on the local IR luminosity function, without evolution. The submm counts start unveiling the bright end of the population that is responsible for the CIRB. The issue of the relative contributions of the starbursts and AGNs to dust heating is still unsolved. Local ULIRGs (but the brightest ones) seem to be dominated by starburst heating. However the trend at higher redshift is unknown.
-
2.
It is difficult to correct for the influence of dust on the basis of the optical spectra alone. Multi–wavelength studies are clearly necessary to address the history of the cosmic SFR density. Forthcoming instrument will help us greatly improve our knowledge of the optically dark side of galaxy formation. Next milestones are sirtf, SOFIA, the planck High Frequency Instrument, the first Spectral and Photometric Imaging REceiver, and the LSA/MMA.
-
3.
Under the assumption that starburst heating is dominant, simple models in the paradigm of hierarchical clustering do reproduce the current IR/submm data. These models normalized by means of the current and forthcoming counts should help us predict the number of IR/submm sources that will be observed by the planck High Frequency Instrument, the contribution of the unresolved sources to the submm anisotropies, and the final strategy for foreground separation and interpretation. Though source counts are strongly model–dependent, and only partly constrained by the current set of data, the studies so far seem to show that the quality of the reconstruction of CMB anisotropies is not severely degraded by the presence of foreground point sources.
Acknowledgments.
I am grateful to F.R. Bouchet, J.E.G. Devriendt, E. Hivon, G. Lagache, B. Maffei, and J.L. Puget who collaborated to many aspects of this program, as well as to H. Dole and the FIRBACK consortium for illuminating discussions. My thanks also to G. De Zotti, A. Franceschini, and L. Toffolatti.
References
Abraham, R.G., Tanvir, N.R., Santiago, B.X., Ellis, R.S., Glazebrook, K., van den Bergh, S., 1996, Mon. Not. Roy. Astron. Soc., 279, L47
Andreani, P., Franceschini, A. 1996, Mon. Not. Roy. Astron. Soc., 283, 85
Aussel, H., Cesarsky, C.J., Elbaz, D., Starck, J.L., 1998, Astron. Astrophys., in press
Barger, A.J., Cowie, L.L., Sanders, D.B., Fulton, E., Taniguchi, Y., Sato, Y., Kawara, K., Okuda, H., 1998, Nature, 394, 248
Baugh, C.M., Cole, S., Frenk, C.S., Lacey, C.G., 1998, Astrophys. J., 498, 504
Bersanelli, M., Bouchet, F.R., Efstathiou, G., Griffin, M., Lamarre, J.M., Mandolesi, R., Norgaard–Nielsen, H.U., Pace, O., Polny, J., Puget, J.L., Tauber, J., Vittorio, N., Volonte, S., 1996, COBRAS/SAMBA Phase A report
Bertin, E., Dennefeld, M., Moshir, M., 1997, Astron. Astrophys., 323, 685
Blain, A.W., Longair, M.S., 1993a, Mon. Not. Roy. Astron. Soc., 264, 509
Blain, A.W., Longair, M.S., 1993b, Mon. Not. Roy. Astron. Soc., 265, L21
Blain, A.W., Kneib, J.P., Ivison, R.J., Smail, I., 1998, Astrophys. J., in press
Bouchet, F.R., Gispert, R., Puget, J.L., 1996, in Unveiling the Cosmic Infrared Background, E. Dwek (ed), AIP Conference Proceedings 348, p.255
Bouchet, F.R., Gispert, R., 1999, in preparation
Cole, S., Aragón–Salamanca, A., Frenk, C.S., Navarro, J.F., Zepf, S.E. 1994., Mon. Not. Roy. Astron. Soc., 271, 781
Connolly, A.J., Szalay, A.S., Dickinson, M., SubbaRao, M.U., Brunner, R.J., 1997, Astrophys. J., 486, L11
Désert, F.X., Boulanger, F., Puget, J.L. 1990, Astron. Astrophys., 237, 215
Devriendt, J.E.G., Guiderdoni, B., Sadat, R., 1999, Astron. Astrophys., submitted
Devriendt, J.E.G., Guiderdoni, B., 1999, in preparation
Dole, H., Lagache, G., Puget, J.L., Aussel, H., Bouchet, F.R., Clements, D.L., Cesarsky, C., Désert, F.X., Elbaz, D., Franceschini, A., Gispert, R., Guiderdoni, B., Harwit, M., Laureijs, R., Lemke, D., Moorwood, A.F.M., Oliver, S., Reach, W.T., Rowan–Robinson, R., Stickel, M., 1999, in The Universe as seen by ISO, P. Cox & M.F. Kessler (eds), 1998, UNESCO, Paris, ESA Special Publications series (SP-427)
Dwek, E., 1998, Astrophys. J., 501, 643
Dwek, E., Arendt, R.G., 1998, Astrophys. J., 508, L9
Dwek, E., Arendt, R.G., Hauser, M.G., Fixsen, D., Kelsall, T., Leisawitz, D., Pei, Y.C., Wright, E.L., Mather, J.C., Moseley, S.H., Odegard, N., Shafer, R., Silverberg, R.F., Weiland, J.L., 1998, Astrophys. J, 508, 106
Eales, S., Lilly, S., Gear, W., Dunne, L., Bond, J.R., Hammer, F., Le Fèvre, O., Crampton, D., 1998, Astrophys. J., in press
Elbaz, D., Aussel, H., Cesarsky, C.J., Desert, F.X., Fadda, D., Franceschini, A., Puget, J.L., Starck, J.L., 1998, in Proc. of the 34th Liege International Astrophysics Colloquium on the “Next Generation Space Telescope”
Elbaz D., Aussel H., Cesarsky C.J., Desert F.X., Fadda D., Franceschini A., Harwit, M., Puget J.L., Starck J.L., 1999, in The Universe as seen by ISO, P. Cox & M.F. Kessler (eds), 1998, UNESCO, Paris, ESA Special Publications series (SP-427)
Fall, S.M., Charlot, S., Pei, Y.C., 1996, Astrophys. J., 464, L43
first SPIRE Consortium, 1998, SPIRE, a bolometer instrument for first, a proposal submitted to the European Space Agency, in response to the Announcement of Opportunity
Fixsen, D.J., Dwek, E., Mather, J.C., Bennett, C.L., Shafer, R.A., 1998, Astrophys. J., 508, 123
Flores, H., Hammer, F., Thuan, T.X., Cesarsky, C., Désert, F.X., Omont, A., Lilly, S.J., Eales, S., Crampton, D., Le Fèvre., O., 1999, Astrophys. J., in press
Franceschini, A., Toffolatti, L., Mazzei, P., Danese, L., & De Zotti, G., 1991, Astrophys. J. Supp. Ser., 89, 285
Franceschini, A., Mazzei, P., De Zotti, G., Danese, L. 1994, Astrophys. J., 427, 140
Franx, M., Illingworth, G.D., Kelson, D.D., van Dokkum, P.G., Tran, K.V., 1997, Astrophys. J., 486, L75
Frayer, D.T., Ivison, R.J., Scoville, N.Z., Yun, M., Evans, A.S., Smail, I., Blain, A., Kneib, J.P., 1998, Astrophys. J., in press
Gallego, J., Zamorano, J., Aragon–Salamanca, A., Rego, M., 1995, Astrophys. J., 455, L1
Gautier, T. N., III, Boulanger, F., Perault, M., Puget, J. L., 1992, Astron. J., 103, 1313
Genzel, R., Lutz, D., Sturm, E., Egami, E., Kunze, D., Moorwood, A.F.M., Rigopoulou, D., Spoon, H.W.W., Sternberg, A., Tacconi–Garman, L.E., Tacconi, L., Thatte, N., 1998, Astrophys. J., 498, 579
Gispert, R., Bouchet, F.R., 1997, in Clustering in the Universe, Proceedings of the Moriond meeting, S. Maurogordato et al. (eds), Editions Frontières,
Guiderdoni, B., Rocca–Volmerange, B. 1987, Astron. Astrophys., 186, 1
Guiderdoni, B., Hivon, E., Bouchet, F.R., Maffei, B., & Gispert, R. 1996, in Unveiling the Cosmic Infrared Background, E. Dwek (ed), AIP Conference Proceedings 348
Guiderdoni, B., Bouchet, F.R., Puget, J.L., Lagache, G., Hivon, E., 1997, Nature, 390, 257
Guiderdoni, B., Hivon, E., Bouchet, F.R., Maffei, B., 1998, Mon. Not. Roy. Astron. Soc., 295, 877
Guiderdoni, B., Bouchet, F.R., Devriendt, J.E.G., Hivon, H., Puget, J.L., 1999, in The Birth of Galaxies, B. Guiderdoni, F.R. Bouchet, T.X. Thuan & J. Trân Thanh Vân (eds), Editions Frontières, in press
Hauser, M.G., Arendt, R., Kelsall, T., Dwek, E., Odegard, N., Welland, J., Freundenreich, H., Reach, W., Silverberg, R., Modeley, S., Pei, Y., Lubin, P., Mather, J., Shafer, R., Smoot, G., Weiss, R., Wilkinson, D., Wright, E., 1998, Astrophys. J., 508, 25
Hobson, M.P., Jones, A. W., Lasenby, A.N., Bouchet, F.R., 1998a Mon. Not. Roy. Astron. Soc., 300, 1
Hobson, M.P., Barreiro, R.B., Toffolatti, L., Lasenby, A.N., Sanz, J.L., Jones, A.W., Bouchet, F.R., 1998b, Mon. Not. Roy. Astron. Soc., submitted
Hughes, D., Serjeant, S., Dunlop, J., Rowan–Robinson, M., Blain, A., Mann, R.G., Ivison, R., Peacock, J., Efstathiou, A., Gear, W., Oliver, S., Lawrence, A., Longair, M., Goldschmidt, P., Jenness, T., 1998, Nature, 394, 241
Ivison, R.J., Smail, I., Le Borgne, J.F., Blain, A.W., Kneib, J.P., Bézecourt, J., Kerr, T.H., Davies, J.K., 1998, Mon. Not. Roy. Astron. Soc., 298, 583
Kauffmann, G.A.M., White, S.D.M., Guiderdoni, B., 1993, Mon. Not. Roy. Astron. Soc., 264, 201
Kauffmann, G.A.M., Guiderdoni, B., White, S.D.M., 1994, Mon. Not. Roy. Astron. Soc., 267, 981
Kawara, K., Sato, Y., Matsuhara, H., Taniguchi, Y., Okuda, H., Sofue, Y., Matsumoto, T., Wakamatsu, K., Karoji, H., Okamura, S., Chambers, K.C., Cowie, L.L., Joseph, R.D., Sanders, D.B., 1998, Astron. Astrophys., 336, L9
Lacey, C., Silk, J., 1991, Astrophys. J., 381, 14
Lagache, G., Abergel, A., Boulanger, F., Désert, F.X., Puget, J.L., 1999, Astron. Astrophys., submitted
Lanzetta, K.M., Wolfe, A.M., Turnshek, D.A., 1995, Astrophys. J., 440, 435
Lilly, S.J., Le Fèvre, O., Hammer, F., Crampton, D., 1996, Astrophys. J., 460, L1
Lilly, S.J., Eales, S.A., Gear, W.K.P., Hammer, F., Le Fèvre, O., Crampton, D., Bond, J.R., Dunne, L., 1999, Astrophys. J., in press
Lonsdale, C.J., Hacking, P.B., Conrow, T.P., Rowan–Robinson, M., 1990, Astrophys. J., 358, 60
Lonsdale, C.J. 1996, in Unveiling the Cosmic Infrared Background, E. Dwek (ed.), AIP Conference Proceedings 348
Lutz, D., Spoon, H.W.W., Rigopoulou, D., Moorwood, A.F.M., Genzel, R., 1998, Astrophys. J., 505, L103
Madau, P., Ferguson, H.C., Dickinson, M.E., Giavalisco, M., Steidel, C.C., Fruchter, A., 1996, Mon. Not. Roy. Astron. Soc., 283, 1388
Madau, P., Pozzetti, L., Dickinson, M.E., 1998, Astrophys. J., 498, 106
Meurer, G.R., Heckman, T.M., Lehnert, M.D., Leitherer, C., Lowenthal, J., 1997, Astron. J., 114, 54
Mushotzky, R.F., Loewenstein, M., 1997, Astrophys. J., 481, L63
Oliver, S.J., Goldschmidt, P., Franceschini, A., Serjeant, S.B.G., Efstathiou, A.N., Verma, A., Gruppioni, C., Eaton, N., Mann, R.G., Mobasher, B., Pearson, C.P., Rowan–Robinson, M., Sumner, T.J., Danese, L., Elbaz, D., Egami, E., Kontizas, M., Lawrence, A., McMahon, R., Norgaard–Nielsen, H.U., Perez–Fournon, I., Gonzalez–Serrano, J.I., 1997, Mon. Not. Roy. Astron. Soc., 289, 471
Partridge, B., Peebles, P.J.E., 1967, Astrophys. J., 148, 377
Pearson, C., Rowan–Robinson, M., 1996, Mon. Not. Roy. Astron. Soc., 283, 174
Pozzetti, L., Madau, P., Zamorani, G., Ferguson, H.C., Bruzual, G.A., 1998, Mon. Not. Roy. Astron. Soc., 298, 1133
Pettini, M., Steidel, C.C., Adelberger, K., Kellogg, M., Dickinson, M., Giavalisco, M., 1998, in ORIGINS, J.M. Shull, C.E. Woodward, and H. Thronson (eds), ASP Conference Series
planck HFI Consortium, 1998, the High–Frequency Instrument for the planck Mission, a proposal submitted to the European Space Agency, in response to the Announcement of Opportunity
Puget, J.L., Abergel, A., Bernard, J.P., Boulanger, F., Burton, W.B., Désert, F.X., Hartmann, D., 1996, Astron. Astrophys., 308, L5
Puget, J.L., Lagache, G., Clements, D.L., Reach, W.T., Aussel, H., Bouchet, F.R., Cesarsky, C., Désert, F.X., Dole, H., Elbaz, D., Franceschini, A., Guiderdoni, B., Moorwood, A.F.M., 1999, Astron. Astrophys., in press
Richards, E.A., 1998, submitted
Rush, B., Malkan, M.A., Spinoglio, L., 1993, Astrophys. J. Suppl. Ser., 89, 1
Sanders, D.B., Mirabel, I.F., 1996, Ann. Rev. Astron. Astrophys., 34, 749
Schlegel, D.J., Finkbeiner, D.P., Davis, M., 1998, Astrophys. J., 500, 525
Silva, L., Granato, G.L., Bressan, A., Danese, L., 1998, Astrophys. J., 509, 103
Smail, I., Ivison, R.J., Blain, A.W., 1997, Astrophys. J., 490, L5
Smail, I., Ivison, R.J., Blain, A.W., Kneib, J.P., 1998, Astrophys. J., 507, L21
Soifer, B.T., Sanders, D.B., Madore, B.F., Neugebauer, G., Danielson, G.E., Elias, J.H., Lonsdale, C.J., Rice, W.L., 1987, Astrophys. J., 320, 238
Soifer, B.T., Neugebauer, G., 1991, Astron. J., 101, 354
Soifer, B.T., Neugebauer, G., Franx, M., Matthews, K., Illingworth, G.D., 1998, Astrophys. J., 501, L171
Somerville, R., Primack, J., 1999, Mon. Not. Roy. Astron. Soc., in press
Steidel, C.C., Hamilton, D., 1993, Astron. J., 105, 2017
Steidel, C.C., Giavalisco, M., Pettini, M., Dickinson, M., Adelberger, K.L., 1996, Astrophys. J., 462, L17
Steidel, C.C., Adelberger, K.L., Giavalisco, M., Dickinson, M., Pettini, M., 1999, Astrophys. J., in press
Stickel, M., Bogun, S., Lemke, D., Klaas, U., Tóth, L.V., Herbstmeier, U., Richter, G., Assendorp, R., Laureijs, R., Kessler, M.F., Burgdorf, M., Beichman, C.A., Rowan–Robinson, M., Efstathiou, A., 1998, Astron. Astrophys., 336, 116
Storrie–Lombardi, L.J., McMahon, R.G., Irwin, M.J., 1996, Mon. Not. Roy. Astron. Soc., 283, L79
Tegmark, M., Efstathiou, G., 1996, Mon. Not. Roy. Astron. Soc., 281, 1297
Tegmark, M., 1998, Astrophys. J., 502, 1
Tegmark, M., de Oliveira–Costa, A., 1998, Astrophys. J., 500, L83
Thuan, T.X., Sauvage, M., Madden, S., 1999, Astrophys. J, in press
Toffolatti, L., Argüeso Gòmez, F., De Zotti, G., Mazzei, P., Franceschini, A., Danese, L., Burigana, C., 1999, Month. Not. Roy. Astron. Soc., in press
Vogel, S., Weymann, R., Rauch, M., Hamilton, T., 1995, Astrophys. J., 441, 162.
Williams, R.E., Blacker, B., Dickinson, M., van Dyke Dixon, W., Ferguson, H.C., Fruchter, A.S., Giavalisco, M., Gilliland, R.L., Heyer, I., Katsanis, R., Levay, Z., Lucas, R.A., McElroy, D.B., Petro, L., Postman, M., 1996, Astron. J., 112, 1335
White, S.D.M., Frenk, C.S., 1991, Astrophys. J., 379, 52