X-ray Over-Luminous Elliptical Galaxies:
A New Class of Mass
Concentrations in the Universe?
Abstract
We detect four isolated, X-ray over-luminous ( erg s-1) elliptical galaxies (OLEGs) in our 160 square degree ROSAT PSPC survey. The extent of their X-ray emission, total X-ray luminosity, total mass, and mass of the hot gas in these systems correspond to poor clusters, and the optical luminosity of the central galaxies () is comparable to that of cluster cDs. However, there are no detectable fainter galaxy concentrations around the central elliptical. The mass-to-light ratio within the radius of detectable X-ray emission is in the range , which is 2–3 times higher than typically found in clusters or groups. These objects can be the result of galaxy merging within a group. However, their high values are difficult to explain in this scenario. OLEGs must have been undisturbed for a very long time, which makes them the ultimate examples of systmes in hydrostatic equilibrium. The number density of OLEGs is Mpc-3 at the 90% confidence. They comprise 20% of all clusters and groups of comparable X-ray luminosity, and nearly all galaxies brighter than . The estimated contirubution of OLEGs to the total mass density in the Universe is close to that of keV clusters.
Subject headings:
dark matter — cosmology: observations — galaxies: clusters — X-rays: galaxies1. Introduction
Large concentrations of matter in the Universe are found using optical galaxies as tracers of mass. Systems with a wide range of mass and size were discovered by this technique, from pairs and triplets of galaxies to filaments extending for hunderds of Mpc. Do optical galaxy surveys detect all large-scale mass concentrations, or do there exist populations of “dark” massive objects?
One approach for detection of dark systems is through gravitational lensing. Week lensing observations can detect very large scale mass structures (e.g., Schneider et al. 1998), but this approach remains technically challenging. Compact, massive systems near the line of sight of a distant object can be detected by strong lensing. At least one such object was found: a massive X-ray cluster at which is very poor optically for its mass (Hattori et al. 1997, but see also Benitez et al. 1998).
X-ray surveys are another avenue for finding compact, massive, optically dark objects, because such objects are likely to contain gravitationally heated X-ray emitting gas. Tucker, Tananbaum & Remillard (1995) did not find any completely dark X-ray clusters in the Einstein data. However, X-ray surveys with ROSAT did find a new class of objects that could not be discovered optically — bright isolated elliptical galaxies surrounded by dark matter and hot gas halos typical of a group or poor cluster. The first such object was a “fossil group” found by Ponman et al. (1994). The object appears optically as a giant isolated elliptical galaxy. Its X-ray halo extends for at least 500 kpc; such an extent implies the group-like total mass. Böhringer et al. (1998) mention the existence of similar objects in the ROSAT All-Sky survey. X-ray observation of an optically selected isolated elliptical revealed the existence of a group-like X-ray halo (Mulchaey & Zabludoff 1998).
Our large-area ROSAT survey of extended X-ray sources (Vikhlinin et al. 1998, Paper I hereafter) is ideal for the search for optically dark clusters and groups at low redshift. In this Letter, we report a detection of four objects similar to the Ponman et al. fossil group. We call them X-ray Over-Luminous Elliptical Galaxies (OLEGs). We show that these objects have gas and dark matter halos extending up to radii of 1 Mpc; they are more numerous and massive than was previously appreciated, and represent an important class of mass concentrations in the Universe.
We use , except where the -dependence is explicitly given, and . All uncertainties are reported as 68% confidence intervals.
| a | b | |||||||||
|---|---|---|---|---|---|---|---|---|---|---|
| Object | (erg s-1) | (kpc) | (kpc) | (keV) | (yr) | () | () | () | () | |
| 0.081 | 50 | 1000 | 2.2 | 347 | ||||||
| 0.171 | 71 | 500 | 2.3 | 267 | ||||||
| 0.130 | 61 | 600 | 2.1 | 340 | ||||||
| 0.199 | 194 | 850 | 2.8 | 425 |
a— X-ray core-radius. b— The radius of detectable X-ray emission.
Note — Masses are estimated within . Optical luminosities are measured in the band within the same radius.
2. Sample and Overall X-ray and Optical Properties
The and band optical CCD images of serendipitously detected extended X-ray sources from our ROSAT PSPC catalog (Paper I) were obtained on the FLWO 1.2m and Danish 1.54m telescopes. We examined these images and selected those objects that were obviously associated with a bright elliptical galaxy, but had no corresponding concentration of fainter galaxies. To add confidence to this selection, two further critera were applied. First, the central galaxy redshift was required to be because galaxy concentration is harder to detect in more distant objects. Second, we required the 0.5–2 keV X-ray luminosity to be erg s-1. This luminosity corresponds to poor Abell clusters which should be visible as galaxy concentrations in our CCD images. X-ray fainter objects can be poor groups and therefore we could misidentify them with single, isolated galaxies. These selections resulted in a sample of four objects (Table 1).
Two of them, and , were previously detected in the Einstein surveys (Stocke et al. 1991 and Griffiths et al. 1992, respectively) and identified with normal elliptical galaxies. We also rediscovered the Ponman et al. object, . The remaining object, , first appears in our sample. We have measured the redshift of and adopted the redshifts of others from the literature. There are several other plausible OLEG candidates, however they do not satisfy either the redshift or the X-ray luminosity criteria.
In all four objects, the X-ray emission is detected with significance out to a large radius Mpc (Table 1). The X-ray surface brightness distribution shows no significant deviations from azimuthal symmetry.
Our optical images cover an area large enough to observe the entire X-ray emitting region and to determine the local density of background galaxies. We have measured the optical luminosity by co-adding light from the central galaxy and all fainter galaxies within and subtracting the estimated background contribution. The resulting -band luminosities (with K- and extinction corrections applied) are in the range . These values are uncertain by due to background fluctuations caused by the presence of relatively bright foreground or background galaxies. In all objects, at least of light (exluding the background) comes from the central galaxy; the contribution from other galaxies does not exceed the level of background fluctuations.
3. Properties of 1159+5531
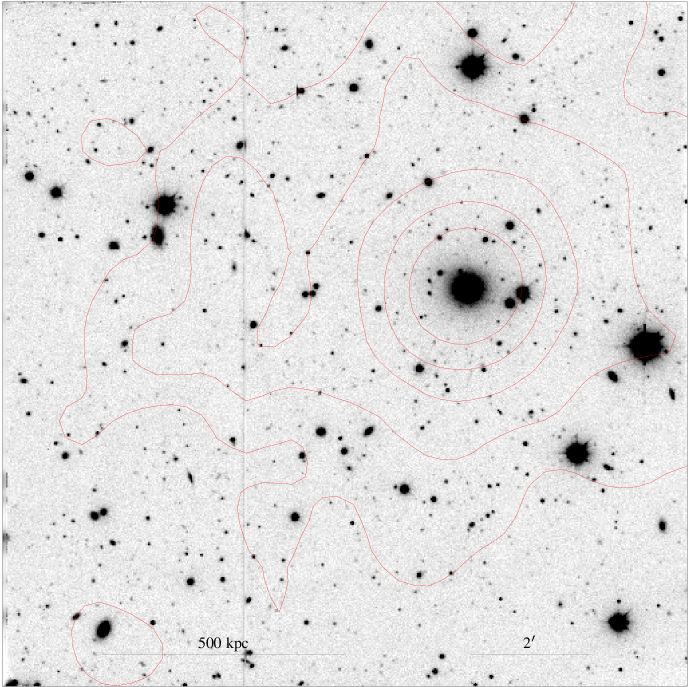
Although this object was discovered by Einstein, its large extent in X-rays remained unnoticed prior to the ROSAT observation. The long ROSAT exposure and the low background made it possible to trace the diffuse X-ray emission to a large radius and even perform a simple spectral analysis. The optical and X-ray properties of 1159+5531 appear to be representative of the other objects in our sample, and the main conclusions derived from the 1159+5531 data can be applied to the entire OLEG population.
The X-ray contour map of 1159+5531 overlayed on the optical CCD image is shown in Fig 2. The X-ray surface brightness profile is shown in Fig 3a. The surface brightness is detected to Mpc from the center with significance. The -model fit (Cavaliere & Fusco-Femiano 1976) in the entire radial range yields and a small core-radius value kpc. The central gas density derived from this fit corresponds to the gas cooling time yr indicating the presence of the cooling flow. Outside the central 200 kpc region, where the surface brightness is unaffected by enhanced cooling flow emission, the best fit -model yields kpc and . These large uncertainties arise from the interplay between and . Fortunately, both gas and total mass at large radius depend mostly on the slope of the surface brightness profile and not on the individual values of and . The surface brightness slope is well-constrained — a power law fit, , between and kpc yields .
Figure 3b presents the gas temperatures in four annuli measured by fitting the ROSAT spectrum with the Raymond & Smith (1977) model. We fixed the metal abundance at of the Solar value and the Galactic hydrogen column at cm-2 derived from the radio surveys (Stark et al. 1992). Fit to the overall ROSAT spectrum with free absorption yielded a consistent value, cm-2. Within 100 kpc, the temperature is significantly lower than in the 100–250 kpc annulus, confirming the existence of the cooling flow. Temperatures are poorly constrained beyond 250 kpc because of low statistics and because ROSAT is insensitive above 2 keV; nevertheless, the lower limits show that the temperature does not drop below 1 keV to at least 800 kpc from the center. The temperature keV derived from the correlation for 1–3 keV clusters and groups (Fukazawa 1997, Hwang et al. 1999) is consistent with the spectral fit outside the cooling flow region. We will use this value for the mass calculations below.
The gas mass was calulated by deprojection of the observed X-ray surface brightness profile (Fabian et al. 1981, White, Jones & Forman 1997). The total mass was derived from the hydrostatic equilibrium equation assuming constant temperature at all radii
| (1) |
where radii are in units of Mpc. The results of the mass determination at several radii are presented in Table 3. The formal statistical uncertainty of the total mass is 30–40%, including uncertainties both in the slope of the surface brightness profile and in the overall temperature.
| Radius | |||||
|---|---|---|---|---|---|
| (kpc) | () | () | () | ( | |
| 400 | 110 | 0.08 | |||
| 700 | 270 | 0.08 | |||
| 1000 | 435 | 0.07 |

Optically, 1159+5531 appears as an isolated giant elliptical residing at the peak of the X-ray emission (Fig 2). The sensitivity limit of this image corresponds to absolute magnitude at the object redshift. Above this sensitivity limit, we detect 18 galaxies within a projected distance of 100 kpc from the central galaxy, while are expected due to the background estimated beyond 1 Mpc.
To measure the total optical luminosity, we integrated the light within 90 kpc of the central galaxy and within 15 kpc of fainter galaxies. We excluded the objects with peak surface brightness exceeding that of the central galaxy; the radial profiles of exluded objects showed that all they were stars. The light density due to background galaxies was measured outside a projected distance of 1 Mpc from the central galaxy. The optical luminosities within 0.4, 0.7, and 1 Mpc with the subtracted background contribution are reported in Table 3.
The optical properties of the central galaxy itself are remarkable. The diffuse optical light can be traced to kpc in , , and bands. The light profile very accurately follows the de Vaucouleurs law with an effective radius kpc. The absolute magnitude is and (with K- and Galactic extinction correction applied). Such a high luminosity is rare in field ellipticals but is typical of cD galaxies in clusters (Hoessel 1980).
To summarize, 1159+5531 is an object with X-ray properties typical of poor clusters and which contains an isolated galaxy whose optical properties resemble central cluster galaxies.
4. Crude Mass Estimates in Other Objects
A detailed analysis of the surface brightness and spectral fitting could be performed only with the 1159+5531 data. In the remaining three objects, only crude estimates of the total and gas mass are possible. To control the accuracy of these estimates, we apply them also to 1159+5531. The gas temperature is estimated from the correlation (Fukazawa 1997, Hwang et al. 1999). The temperature scatter around the mean relation is only , which is accurate enough for our purposes. Additional confidence is added by the agreement of the temperature estimate and the direct spectral fit in . The X-ray surface brightness profiles are fit with the -model with free normalization and core-radius, but we fix because of low statistics. Using the -model fit, we derive the central gas cooling time. In all objects except for , it is much shorter than the Hubble time, therefore they likely contain cooling flows. The gas mass within , the radius of the detectable X-ray emission, is also derived using the -model fit. For a fixed , the derived value of gas mass is relatively insensitive to , therefore fixing does not introduces significant errors in the gas mass. Unfortunately, the presence of the cooling flow limits the accuracy of the -model gas mass estimates. For example, a detailed modelling of the surface brightness profile including the cooling flow yields larger gas mass than the global -model fit. The estimated temperature and is substituted into eq (1) to derive the total mass. The estimated gas and total masses are listed in Table 1. For , the crude method yields a 30% lower gas mass and 20% lower total mass compared to a more detailed analysis in § 3.
5. Discussion
5.1. Are OLEGs Really Isolated?
Central galaxies in OLEGs clearly dominate their surroundings. The brightest galaxy within the projected distance of 500 kpc around is 2.9 magnitudes fainter and may be at a different redshift. OLEGs do not show any detectable concentration of galaxies in projection down up to 7.5 magnitudes fainter than the central galaxy. However, we cannot completely exclude the existence of a dwarf galaxy population in these systems. Mulchaey & Zabludoff (1998) have studied NGC 1132, a nearby optically selected galaxy with X-ray properties similar to OLEGs and , and found a concentration of dwarf galaxies with in the range from to , consistent in number with that in X-ray detected galaxy groups. The sensitivity of our image is adequate to detect such galaxies. We do not find any evidence for existence of a dwarf concentration around , but the upper limit on their number is consistent with the composite group profile presented by Mulchaey & Zabludoff. The possibility of existence of a dwarf population around and our other objects can be tested only by a detailed redshift survey.
5.2. Number Density
The volume covered by our survey contains 4 objects. The corresponding Bayesian lower and upper 95% confidence limits of the true number of objects are 1.97 and 9.15, respectively (see, e.g., Kraft, Burrows, & Nousek 1992). For given , the survey volume can be calculated using the dependence of solid angle on limiting flux (Paper I). We find a volume of Mpc3 for objects with erg s-1; a slightly larger volume of Mpc3 is obtained for objects with erg s-1. Conservatively assuming the larger volume, we obtain the spatial density of OLEGs of Mpc-3 at 90% confidence.
This number density is comparable to the number of other objects of similar nature — galaxy groups (compact groups in particular) and field elliptical galaxies in the corresponding magnitude range. The X-ray luminosity functions from Ebeling et al. (1997) and Burns et al. (1996) show that OLEGs represent of all clusters and groups with erg s-1. Using the X-ray and optical luminosity functions of Hickson compact groups (HCGs) from Ponman et al. (1996) and Sulentic & Rabaça (1994), we find that OLEGs outnumber comparably X-ray luminous HCGs by a factor of and are as numerous as HCGs of comparable total optical luminosity. To estimate the number density of field elliptical galaxies, we used the -band luminosity function derived from the Las Campanas redshift survey (Lin et al. 1996). Above a limiting absolute magnitude corresponding to the luminosity of our faintest object (and 2.2m brighter than ), we find the number density of all galaxies Mpc-3. Most of these bright galaxies can be spectrally classified as early types (Bromley et al. 1998). Some of them should lie within rich clusters, so the above number density is an upper limit for the field population. Therefore, most, if not all, of the brightest field ellipticals (with ) are OLEGs, i.e. possess X-ray halos extending for hundreds of kpc. This also means that our OLEG sample cannot be significantly incomplete.
The contribution of OLEGs to the total mass in the Universe is close to that of rich clusters. Markevitch (1998) derived the number density Mpc-3 for keV clusters. Since the total mass scales with temperature as , OLEGs (keV) are 6.5 times less massive than 7 keV clusters. They outnumber such clusters by a factor of , and hence their contribution to the total mass density is similar.
5.3. High Mass-to-Light Ratio
OLEGs have unusually high mass-to-light ratios. Within 500–1000 kpc, the radius where extended X-ray emission can still be detected, in the -band is in the range 250–450. We find similar or slightly higher values of in the -band. Our estimates are 2–3 times higher than the -band values for clusters and groups determined from the X-ray mass measurements (David, Jones & Forman 1995). Is this difference real or it can be explained by our measurement errors? The largest uncertainty in is due to the inaccuracy of the total mass measurement. Our total mass estimates are essentially proportional to temperatures estimated from the relation. A 2–3-fold overestimate of from this relation is possible, but unlikely, given the good agreement between the estimate and measurement for .
A plausible explanation of the origin of OLEGs is that they are merged compact galaxy groups (Ponman et al. 1994, Mulchaey & Zabludoff 1998). If this explanation is correct, our results imply that most of the brightest field ellipticals are products of group merging and that these products are more numerous than present-day groups. The latter is consistent with the short estimated lifetime of compact groups (Mamon 1986). However, the high values of we find in OLEGs pose a problem for this scenario because the optical luminosity is unlikely to decrease during the galaxy merging.
6. Conclusions
Even the scarce available data indicate that OLEGs represent a new interesting class of objects warranting a detailed X-ray and optical study. These objects are likely to have been undisturbed for a long time, and thus represent the ultimate example of cluster-like systems in hydrostatic equilibrium. Forthcoming Chandra observations of two objects from our sample will result in accurate profiles of the gas and total mass. If high and low gas fraction is confirmed, this will pose a problem for low estimates from the values of these quantities in clusters.
References
- (1)
- (2) Benitez, N., Broadhurst, T., Rosati, P., Courbin, F., Squires, G., Lidman, C., & Magain, P. 1998, ApJ, submitted. (astro-ph/9812218)
- (3)
- (4) Böhringer, H. et al. 1998, preprint astro-ph/9809382
- (5)
- (6) Bromley, B. C., Press, W. H., Lin, H., & Kirshner, R. P. 1998, ApJ, 505, 25
- (7)
- (8) Burns, J. O., Ledlow, M. J., Loken, C., Klypin, A., Voges, W., Bryan, G. L., Norman, M. L., & White, R. A. 1996, ApJ, 467, L49
- (9)
- (10) Cavaliere, A. & Fusco-Femiano, R. 1976, A&A, 49, 137
- (11)
- (12) David, L. P., Jones, C., & Forman, W. 1995, ApJ, 445, 578
- (13)
- (14) Ebeling, H., Edge, A. C., Fabian, A. C., Allen, S. W., Craford, C. S., & Böhringer, H. 1997, ApJ, 479, L101
- (15)
- (16) Evrard, A. E., Metzler, C. A., & Navarro, J. F. 1996, ApJ, 469, 494
- (17)
- (18) Fabian, A. C., Hu, E. M., Cowie, L. L., & Grindlay, J. 1981, ApJ, 248, 47
- (19)
- (20) Fukazawa, Y. 1997, PhD Thesis, University of Tokyo
- (21)
- (22) Griffiths, R. E., Tuohy, I. R., Brissenden, R. J. V., & Ward, M. J. 1992, MNRAS, 255, 545
- (23)
- (24) Hattori, M., et al. 1997, Nature, 388, 146
- (25)
- (26) Hoessel, J, 1980, ApJ, 241, 493
- (27)
- (28) Hwang, U., Mushotzky, R. F., Burns, J. O., Fukazawa, Y., & White, R. A. 1999, ApJ, in press (astro-ph/9812032)
- (29)
- (30) Kraft, R. P., Burrows, D. N., & Nousek, J. A. 1991, ApJ, 374, 344
- (31)
- (32) Lin, H., Kirshner, R. P., Shectman, S. A., Landy, S. D., Oemler, A., Tucker, D. L., & Schechter, P. L. 1996, ApJ, 464, 60
- (33)
- (34) Mamon, M. A. 1986, ApJ, 307, 426, 30
- (35)
- (36) Markevitch, M. 1998, ApJ, 504, 27
- (37)
- (38) Mulchaey, J. S. & Zabludoff, A. I. 1998, ApJ, in press (astro-ph/9810458)
- (39)
- (40) Ponman, T. J., Allen, D. J., Jones, L. R., Merrifield, M., McHardy, I. M., Lehto, H. J., & Luppino, G. A. 1994, Nature, 369, 462
- (41)
- (42) Ponman, T. J., Bourner, P. D. J., Ebeling, H., & Böhringer, H. 1996, MNRAS, 283, 690
- (43)
- (44) Raymond, J. C. & Smith, B. W. 1977, ApJS, 35, 419
- (45)
- (46) Schneider, P., Van Waerbeke, L., Jain, B., & Kruse, G. 1998, MNRAS, 296, 873
- (47)
- (48) Stark, A. A., Gammie, C. F., Wilson, R. W., Bally, J., Linke, R. A., Heiles, C., & Hurwitz, M. 1992, ApJS, 79, 77
- (49)
- (50) Stocke, J. T., Morris, S. L., Gioia, I. M., Maccacaro, T., Schild, R., Wolter, A., Fleming, T. A., & Henry, J. P. 1991, ApJS, 76, 813
- (51)
- (52) Sulentic, J. W. & Rabaça, C. R. 1994, ApJ, 429, 531
- (53)
- (54) Tucker, W. H., Tananbaum, H., & Remillard, R. A. 1995, ApJ, 444, 532
- (55)
- (56) Vikhlinin, A., McNamara, B. R., Forman, W., Jones, C., Quintana, H., & Hornstrup, A. 1998, ApJ, 502, 558 (Paper I)
- (57)
- (58) White, D. A., Jones, C., & Forman, W. 1997, MNRAS, 292, 419
- (59)