The Local Environment of HII Galaxies
Abstract
We have carried out an investigation of the environments of low redshift HII galaxies by cross-correlating their positions on the sky with those of faint field galaxies in the Automatic Plate Measuring Machine catalogues. We address the question of whether violent star formation in HII galaxies is induced by low mass companions by statistically estimating the mean space density of galaxies around them. We argue that even if low mass companions were mainly intergalactic HI clouds, their optical counterparts should be detectable at faint limits of the APM scans.
A significantly positive signal is detected for the HII galaxy-APM galaxy angular cross-correlation function, but the amplitude is poorly determined. The projected cross-correlation function has higher signal-to-noise, and suggests that the amplitude is slightly lower than for normal field galaxies. This implies that these bursting dwarf galaxies inhabit slightly lower density environments to those of normal faint field galaxies, consistent with other studies of emission line galaxies. This suggests that in these dwarf starburst galaxies, star formation is not triggered by unusually strong tidal interactions, and may have a different origin.
keywords:
galaxies: statistics – galaxies: starburst – galaxies: clustering – galaxies: environment1 Introduction
The starburst phenomenon is observed in a large number of extragalactic objects from giant HII regions in irregular galaxies and late type spirals, to galaxies entirely dominated by the violent massive star formation region as in the case of Starburst Galaxies. The class of starburst galaxies comprises a large range in luminosity, mass, heavy element and dust content, as well as morphology. Classical starburst or nuclear starburst galaxies typically have an intense region of violent star formation in the nucleus of an otherwise normal spiral galaxy (Balzano 1983). At the high luminosity end of starburst galaxies, ultraluminous IRAS galaxies (Soifer et al. 1987) are strongly interacting giant systems (Melnick & Mirabel 1990) where most of the radiation is emitted in the far-infrared due to reprocessed UV radiation by the large content of dust particles. HII galaxies, on the other hand, are dwarf galaxies in a bursting phase of star formation of low luminosity and mass, low heavy element abundance and low dust content where the triggering mechanism of the present episode of violent star formation is not as obvious (Telles & Terlevich 1995).
Earlier searches for bright galaxies near to HII galaxies found a deficit of galaxies within 1 Mpc (Campos-Aguilar & Moles 1991, Campos-Aguilar et al. 1993, Vilchez 1995, Pustilńik et al. 1995; Telles & Terlevich,1995). HII galaxies are not associated with giant galaxies, therefore they are not tidal debris of strongly interacting systems. Auto-correlation analyses of strong emission line galaxies (Iovino, Melnick & Shaver 1988, Rosenberg et al. 1994, Loveday et al. 1999) find a low clustering amplitude, suggesting that HII galaxies tend to populate regions of low galactic density.
Their optical properties are dominated by the massive star forming region, as shown by their strong emission line spectra superposed on a weak blue continuum. The properties of the underlying galaxies in these systems are similar to late type dwarf galaxies such as dwarf irregulars or low surface brightness dwarfs (Telles & Terlevich 1997). The most luminous HII galaxies, classified as Type I’s by Telles, Melnick and Terlevich (1997), show signs of disturbed morphology such as distorted outer isophotes, tails or irregular fuzz, while the low luminosity Type II’s are regular and compact. Although there is a clear case for a morphology-luminosity relation, neither type of HII galaxies shows conspicuous evidence of bright companions in their neighbourhood. The few HII galaxies found to have a bright neighbour (maybe by chance) are all of Type II’s of regular morphology, contrary to what one would expect if interactions caused the morphological disturbances as seen in Type I’s (Telles & Terlevich 1995).
A popular hypothesis is that interactions between galaxies are the triggers of starbursts and they may also cause the current burst of star formation in HII galaxies. Giant galaxies, however, are not found in the immediate vicinity of HII galaxies, thus are improbable candidates for triggering agents. A possible and appealing alternative was presented by Melnick (1987) who proposed that high resolution 21cm maps were needed to investigate the role of collisions between intergalactic neutral hydrogen clouds in the formation of these objects. Brinks (1990) also hypothesized that other dwarfs or intergalactic HI clouds could be the triggering agents. Taylor et al. (1995, 1996) using the VLA detected 12 HI companions around 21 HII galaxies, while only 4 HI-rich companions were detected around a control sample of 17 quiescent low surface brightness dwarfs (Taylor 1997). As also pointed out by these authors, some questions remain intriguing from this: Why are these 9 out of the 21 HII galaxies with no companions violent forming stars now (’bursting’)? Why are these 4 out of the 17 LSBGs with companions not ’bursting’?
HI surveys find that all the HI detections have an optical counterpart. That is, all the sources found in 21 cm surveys are nothing else than normal galaxies (c.f. Zwaan et al. 1997, Zwaan, 1999, Hoffman, 1999). No free floating intergalactic HI clouds were detected in such surveys. Thus, we have carried out a further investigation of the galaxy environments of a unbiased sample of over 160 low redshift HII galaxies by cross-correlating their accurate position in the sky to faint field galaxies () in the Automatic Plate Measuring Machine (APM) galaxy catalogue. For the mean redshift of our HII galaxy sample we detect galaxies down to . Using the relation between optical magnitude MB and HI mass for late type galaxies, given by Rao & Briggs (1993) [], we estimate that we are not missing any cloud with mass greater than 108 . This is comparable to the lower limits of HI companions found by Taylor et al. (1995, 1996). Hence our present study should detect any possible low mass candidates to act as tidal triggers.
2 Data
2.1 HII Galaxy Sample
The HII galaxy sample used in this paper is taken from the Spectrophotometric Catalogue of HII Galaxies (SCHG; Terlevich et al. 1991). Most of the objects in this database have been selected from the Tololo survey (Smith, Aguirre & Zemelman 1976), and the University of Michigan survey (MacAlpine & Williams 1981). The catalogue also contains a number of objects which are not classified as Seyfert galaxies selected from the Markarian list of galaxies with strong ultraviolet continuum (Markarian, Lipovetskii & Stepanyan 1981 and references therein), as well as some blue objects of Zwicky’s catalogue of compact galaxies (Zwicky 1971). The total catalogue contains spectra of over 400 emission line objects found in objective prism surveys using IIIa-J emulsion through their [OIII]4959,5007 and/or [OII]3726,3729 lines. From these, about 300 are HII galaxies. The remainder are Giant HII regions, and Starburst nuclei or emission line objects classified as Seyfert nuclei from their position in the emission-line-ratio diagnostic diagrams.
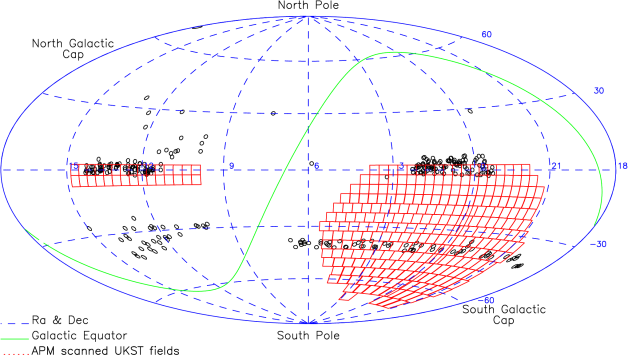
Most of the objects in this sample cover only two specific regions of the sky. For instance, the Michigan survey covers a 10∘ band around the celestial equator, while the Tololo survey concentrates in the region . This is illustrated in Figure 1 which shows the distribution of our HII galaxies in the sky. For the present study we ended up with 163 HII galaxy centres for which there are APM scanned UK Schmidt plates. The actual centres for the HII galaxy were carefully identified for each APM field, thus assuring that the HII galaxy is not counted as a companion of itself.
The redshift distribution of these galaxies is plotted in Figure 2, which also shows the best-fit model redshift distribution of the form
| (1) |
The mean redshift is 0.03. The typical absolute magnitude is M. Throughout this paper we use the current value of H Mpc-1(Suntzeff et al. 1998).
2.2 APM galaxy sample
Our sample of faint field galaxies was selected from the APM Galaxy Survey, which is described in detail by Maddox et al. (1990). The sky covered by the APM galaxy survey has been extended since the original publication of the survey: the south galactic pole part of the survey now covers a solid angle of square degrees, and is based on 269 UKS J plates scanned by the APM machine; the north galactic cap area covers 750 square degrees from scans of 30 UKS plates centred with and . The fields covered are shown by the dotted squares on Figure 1.
The data consist of positions accurate to and magnitudes accurate to mag for over 50 million images brighter than a magnitude limit of . The galaxy photometry has been corrected for several systematic effects and have no detectable systematic errors more than magnitudes rms. The galaxy sample selected from the survey data at a magnitude limit of has a completeness –, stellar contamination and negligible dependence of the galaxy surface density on declination or galactic latitude (Maddox et al 1996). At this magnitude limit the redshift distribution is well described by equation 1 with the mean (Maddox et al 1996).
We extracted APM measurements for a square area around each of the HII galaxies. For the central 10’ square we visually cross-checked the APM catalogue list against images from the Digitized Sky Survey (DSS), and rejected multiple detections and noise images. This provides a reliable galaxy catalogue around each HII galaxy.
3 Analysis
3.1 The angular cross-correlation function
We have measured , the angular cross-correlation function between the HII galaxies and an apparent magnitude limited sample of neighbouring galaxies. We estimated by counting the number of galaxies as a function of angular radius from the central HII galaxy, and comparing this to the number counted for a catalogue of uniform random postions. We used ten times as many random points as galaxies in order to reduce their contribution to the counting errors, and then rescaled the count down by a factor ten. The cross-correlation function is then given by
| (2) |
We also used the simpler direct estimate using the mean surface density of field galaxies, , and the area of each annulus,
| (3) |
where is the number of HII galaxies used as centres.

The main results are shown in Figure 3. The filled points show from equation 2 and the open points from the direct estimator, equation 3. This gave essentially indistinguishable results, showing that there are no significant systematic biases in our sample. The error bars are estimated from the Poisson noise in each radial bin, scaled by the integral of , , where . This is analogous to the error estimate for the spatial correlation function suggested by Kaiser (1986), and is a reasonable approximation for a weakly clustered distribution (see Hamilton 1993 for an extensive analysis of errors in correlation functions). It can be seen that is significantly positive for angles , corresponding to an excess of galaxies near the HII galaxy positions compared to a uniform distribution. This would be expected for any sample of galaxies, since we know that galaxies are clustered.
We have calculated the expected cross-correlation function assuming that HII galaxies cluster in the same way as normal galaxies, and this is shown by the line in Figure 3. This prediction is based on the APM correlation function for , which is well fit by a power law at small scales, , with and (Maddox et al 1996). We scaled the amplitude by a factor calculated numerically from Limbers equation (Peebles 1980)
| (4) |
where is the comoving coordinate at redshift , is the redshift distribution of the HII galaxy sample, is the redshift distribution of the APM galaxy sample and is the spatial correlation function at separation . The two redshift distributions are given by equation 1 with chosen to match the observed distributions for HII galaxies and the APM galaxies at . This gave the predicted amplitude . We also included a constant offset to correct for the integral constraint within the 2∘ fields (Smith, Boyle &Maddox 1995), giving a final , where is in degrees.
Figure 3 shows that the estimated for HII galaxies is consistent with the assumption that HII galaxies are clustered in the same way as normal field galaxies. The uncertainty in the estimated amplitude is rather large, but we can rule out the suggestion that HII galaxies are anticorrelated with field galaxies. It is also clear that there is not a large excess of near neighbours around the HII galaxies compared to normal galaxies. This appears incompatible with suggestion that HII galaxies are triggered by tidal interactions with nearby low-mass galaxies.
3.2 The projected cross-correlation function

Since we know the redshift to each HII galaxy, we can estimate the correlation function using the projected physical separation, . The resulting projected cross-correlation function, , is an integral over the spatial correlation function ,
| (5) |
We estimate using a method similar to that described by Saunders et al (1992). For each HII galaxy we count the excess neighbours compared to a random distribution using
| (6) |
This is related to
| (7) |
where is the average number of field galaxies per steradian per Mpc along the line of sight in the background catalogue at distance , and the distance to the central HII galaxy is . The approximation is essentially the small-angle approximation, but also involves several subtleties, as discussed by Saunders et al (1992). Note that the different distance to each HII galaxy means that relation between and is different for each centre, and also the leads to a different weighting of the pair count from each centre. This means that is not simply a rescaling of .
If is a power law in , , then the projected correlation function is given by where Hence
| (8) |
Our measurement of is shown by the points in Figure 4. It is positive for Mpc, showing that HII galaxies have more neighbouring galaxies than a uniform distribution: they are not isolated systems. As discussed in Section 3.1, we expect any sample of galaxies to have more neighbours than a random distribution, so we have calculated the expected assuming that HII galaxies are clustered in the same way as normal galaxies. Our prediction is given by equation 8 with , which is a good approximation to the APM correlation function on small scales (Maddox et al. 1996). We have also subtracted a constant from the power-law to allow for the integral constraint which applies to the data points. This is shown as the solid line in Figure 4. The observed values are consistent, although slightly lower than the predictions. This slight discrepancy can be interpreted as a reflection of the fact that the amplitude of the autocorrelation function for HII galaxies is lower than for normal galaxies. Iovino Melnik and Shaver (1988) find Mpc for the HII galaxy sample used here; the corresponding is shown as the dashed line in Figure 4. If HII galaxies and normal galaxies follow the same underlying mass distribution with differing bias levels, the cross-correlation function should be the geometric mean of the two autocorrelation functions, so . The dotted line in Figure 4 shows the equivalent .
The lower amplitude emphasises the point made in Section 3.1, that there is not a large excess of near neighbours around the HII galaxies compared to normal galaxies. Again this is incompatible with suggestion that HII galaxies are triggered by tidal interactions with nearby low-mass galaxies.
4 conclusions
Our main results are:
-
1.
Both the angular and projected correlation functions are significantly positive, so HII galaxies are significantly clustered. This is what you expect to find for any sample of galaxies.
-
2.
The angular measurements have large uncertainties, but are consistent with the predictions expected for a sample of normally clustered galaxies.
-
3.
The projected measurements are marginally lower than the predictions expected for a sample of normally clustered galaxies, and lie between the autocorrelation functions of normal galaxies and HII galaxies.
Telles and Terlevich (1995) found that the space density of bright galaxies within 1Mpc3 of HII galaxies is a factor times higher than expected for a random distribution, but times less than for a control sample of sample of Sc galaxies. These results showed that HII galaxies are more clustered than a random distribution, but slightly less clustered than normal galaxies. The present work extends this analysis to much fainter apparent magnitudes, measuring the density of galaxies to , which correspond to very low mass galaxies and HI clouds ( ). Our results are in agreement with the earlier studies, with the additional conclusion that HII galaxies do not have preferentially faint, low-mass neighbours.
We conclude that star-formation in these galaxies is not triggered by tidal interactions and must have a different origin, possibly associated with the formation and evolution of Super Stellar Clusters in starbursts, as observed in the UV (Vacca 1994; Meurer et al. 1995; Ho 1997) and in the Near-IR (Telles et al. 1999).
References
Balzano, V.A., 1983, Astrophys. J. , 268, 602
Brinks,E., 1990, in “Dynamics and Interactions of Galaxies ”, ed. R. Wielen, Springer-Verlag, Heidelberg, p. 146
Campos-Aguilar,A., Moles,M., 1991, Astr. Astrophys. , 241, 358
Campos-Aguilar,A., Moles,M., Masegosa,J., 1993, Astron. J. , 106, 1784
Hamilton, A.J.S., 1993, ApJ, 417, 19
Hoffman, L., 1999, in ”Dwarf Galaxies and Cosmology” eds. T. X. Thuân, C. Balkowski, V. Cayatte & J. Trân Thanh Vân, Editions Frontières (Gyf-sur-Yvette, France)
Ho, L. 1997, Rev. Mex. Astr. Astrofis. , 6, 5
Iovino, A, Melinick J. & Shaver P., 1988, Astrophys. J. Lett. , 330, L17
Kaiser, N., 1986, Mon. Not. R. astr. Soc. , 219, 785
Loveday, J., Tresse, L. & Maddox, S., 1999, in preparation
MacAlpine G.M. & Williams G.A., 1981, Astrophys. J. Suppl. , 45, 113
Maddox, S.J., Sutherland, W.J. Efstathiou, G., and Loveday, J., 1990, Mon. Not. R. astr. Soc. , 243, 692
Maddox, S.J., Efstathiou, G. and Sutherland, W.J., 1996, Mon. Not. R. astr. Soc. , 283 1227.
Markarian, B.E., Lipovetskii, V.A. & Stepanyan, Dzh.A., 1981, Astrofisika, 17, 619
Melnick,J., 1987, in “Starburst and Galaxy Evolution ”, eds. T.X.Thuan, T.Montmerle & J.Tran Thanh Van, editions Frontières Gif Sur Yvette, France, p. 215
Melnick,J.,Mirabel,I.F., 1990, Astr. Astrophys. , 231, L19
Meurer, G.R., Heckman, T.M., Leitherer, C., Kinney, A., Robert, C., Garnett, D.R., 1995, Astron. J. . 110, 2665.
Peebles P.J.E., 1980, The Large-Scale Structure of the Universe, Princeton University Press, Princeton.
Pustil’nik,S.A., Ugryumov,A.V., Lipovetsky,V.A., Thuan,T.X., Guseva, N., 1995. Astrophys. J. , 443, 499.
Rao, S. & Briggs, F., 1993, Astrophys. J. , 419, 515
Rosenberg,J.L., Salzer,J.J., Moody,J.W., 1994, Astron. J. , 108, 1557
Saunders, W., Rowan-Robinson, M. and Lawrence, A., 1992, Mon. Not. R. astr. Soc. , 258, 134
Smith, M.G., Aguirre, C. & Zemelman, M., 1976, Astrophys. J. Suppl. , 32, 217
Smith R.J., Boyle B.J., and Maddox S.J., 1995, Mon. Not. R. astr. Soc. . 277, 270
Soifer, B. T., Sanders, D. B., Madore, B. F., Neugebauer, G., Danielson, G. E., Elias, J. H., Lonsdale, Carol J., Rice, W. L., 1987, Astrophys. J. , 320, 238
Suntzeff, N.B., Phillips, M.M., Covarrubias, R., Navarrete, M., Peres, J.J.P., Guerra, A., Acevedo, M.T., Doyle, L.R., Harrison, T., Kane, S., Long, K.S., Maza, J., Miller, S., Piatti, A.E., Claria, J.J., Ahumada, A.V., Pritzl, B., Winkler, P.F., 1998, astro-ph/9811205
Taylor,C.L.,Brinks,E., Grashuis, R.M. & Skillman,E.D., 1995, Astrophys. J. Suppl. , 99, 427
Taylor,C.L.,Brinks,E., Grashuis, R.M. & Skillman,E.D., 1996, Astrophys. J. Suppl. , 102, 189 (erratum)
Taylor,C.L 1997, Astrophys. J. , 480, 524
Telles,E. & Terlevich,R., 1995, Mon. Not. R. astr. Soc. , 275, 1
Telles,E. & Terlevich,R., 1997, Mon. Not. R. astr. Soc. , 286, 183
Telles,E., Melnick,J. & Terlevich,R., 1997, Mon. Not. R. astr. Soc. , 288, 78
Telles,E., Tapia,M., Terlevich,R., Kunth,D. & Sampson,L., 1999, in: K.A. van der Hucht, G. Koenigsberger & P.R.J. Eenens (eds.), “Wolf-Rayet Phenomena in Massive Stars and Starburst Galaxies”, Proc. IAU Symposium No. 193 (San Francisco: ASP), in press
Terlevich, R., Melnick, J., Masegosa, J., Moles, M. & Copetti, M.V.F., 1991, Astr. Astrophys. Suppl. , 91, 285 (SCHG)
Vacca, W.D., 1994, in “Violent Star Formation”, ed Tenorio-Tagle, p 297
Vilchez,J.M., 1995, Astron. J. , 110, 1090
Zwaan, M., 1999, in ”Dwarf Galaxies and Cosmology” proceedings of the XVIIIth Moriond astrophysics meeting, eds. T. X. Thuân, C. Balkowski, V. Cayatte & J. Trân Thanh Vân, Editions Frontières (Gyf-sur-Yvette, France)
Zwaan, M.A., Briggs, F.H., Sprayberry, D., Sorar, E., 1997, Astrophys. J. , 490, 173
Zwicky, F., 1971, Catalogue of Selected Compact Galaxies and Post-Eruptive Galaxies, published by the author, Switzerland