New Structure In The Shapley Supercluster
Abstract
We present new radial velocities for 306 bright () galaxies in a 77 deg2 region of the Shapley supercluster measured with the FLAIR-II spectrograph on the UK Schmidt Telescope.
The galaxies we measured were uniformly distributed over the survey area in contrast to previous samples which were concentrated in several rich Abell clusters. Most of the galaxies (230) were members of the Shapley supercluster: they trace out two previously unknown sheets of galaxies linking the Abell clusters of the supercluster. In a 44 deg2 area of the supercluster excluding the Abell clusters, these sheets alone represent an overdensity of a factor of compared to a uniform galaxy distribution.
The supercluster is not flattened in the Declination direction as was suggested in previous papers. Within our survey area the new galaxies contribute an additional 50% to the known contents of the Shapley supercluster with a corresponding increase in its contribution to the motion of the local group.
1 School of Physics, University of New South Wales, Sydney 2052,
Australia, mjd@phys.unsw.edu.au
2 DAEC, Observatoire de Meudon, 92195 Meudon Cedex,
France, proust@obspm.fr
3 Anglo-Australian Observatory, Coonabarabran, NSW 2357, Australia,
qap@aaocbn.aao.gov.au
4 Departamento de Astronomia y Astrofisica,
Pontificia Universidad Católica de Chile
Casilla 104, Santiago 22, Chile,
hquintana@astro.puc.cl
5 Observatoire de Nice, 06304 Nice Cedex 4 France,
slezak@obs-nice.fr
Keywords: galaxies: clusters; distances and redshifts — large-scale structure of the universe
1 Introduction
The Shapley supercluster (SSC) has been investigated by numerous authors since its discovery in 1930 (Quintana et al. 1995; hereafter Paper I). It lies in the general direction of the dipole anisotropy of the Cosmic Microwave Background (CMB), and is located at 130 beyond the Hydra-Centaurus supercluster ( away from us). It consists of many clusters and groups of galaxies in the redshift range . The central cluster A3558 has also been measured with a ROSAT PSPC observation by Bardelli et al. (1996) who derive a total mass of within an Abell radius of 2. Several other x-ray clusters form part of the Shapley supercluster (Pierre et al. 1994).
The Shapley supercluster is recognised as one of the most massive concentrations of galaxies in the local universe (Scaramella et al. 1989; Raychaudhury 1989), so it is of particular interest to consider its effect on the dynamics of the Local Group. In Paper I it was estimated that for and the gravitational pull of the supercluster may account for up to 25% of the peculiar velocity of the Local Group required to explain the dipole anisotropy of the CMB radiation, in which case the mass of the supercluster would be dominated by inter-cluster dark matter.
Previous studies of the Shapley supercluster (Paper I, Quintana et al. 1997; hereafter Paper II) have concentrated on the various rich Abell galaxy clusters in the region, but this might give a very biased view of the supercluster. As was noted in Paper I, “the galaxy distribution inside the supercluster must be confirmed by the detection in redshift space of bridges or clouds of galaxies connecting the different clusters”.
We are continuing this project, using data from wide-field multi-fibre spectrographs to measure many more galaxy redshifts and get a more complete picture of the composition of the supercluster. Our main aims are first to define the real topology of the SSC: in Paper I it was shown that the SSC is significantly flattened, but the real extent of the concentration is not well defined. Secondly we will analyse the individual X-ray clusters that are true members of the Shapley Supercluster in order to estimate the cluster masses, and investigate suspected sub-structure. Additional observations are planned before we present a full analysis of the dynamics (Proust et al. 1998 in preparation).
In Paper II we presented data from the MEFOS spectrograph on the European Southern Observatory 3.60m telescope. This has 30 fibres in a 1 deg diameter field, so the observations were again mainly concentrated on the known clusters, determining for several of them if they were members of the supercluster or not.
In this paper we present new data obtained with the FLAIR-II (Parker & Watson 1995; Parker 1997) multi-fibre spectrograph on the UK Schmidt Telescope at the Anglo-Australian Observatory. This has 90 fibres in a deg2 field and has allowed us to measure a much more uniform distribution of galaxies in the direction of the SSC, avoiding the previous bias in favour of the rich clusters. Our data reveal the existence of a sheet of galaxies connecting the main parts of the supercluster. We describe the sample and observations in Section 2. We present the results along with previous measurements in Section 3 and discuss the significance of the measurements in Section 4.
2 Observations
Although a large body of galaxy velocity data is available in the literature for the SSC, the existing samples of redshifts in each cluster are highly incomplete, even at the bright end of the luminosity function. We have therefore started a campaign to obtain complete samples down to the same magnitude below for each cluster. Each selected cluster has a projected diameter of 2.5 to 3.0 degrees, so the FLAIR-II system on the UKST with a deg2 field is an ideal facility for this project. The very wide field also permits us to probe the regions between the dominant clusters neglected in previous observations. In this paper we emphasise our results from these regions.
We selected targets from red ESO/SRC sky survey plates scanned by the MAMA machine at Paris Observatory (as described in Paper II; see also Infante et al. 1996). The fields observed (listed in Table 1) were the standard survey fields nearest to the centre of the cluster (13:25:00 31:00:00 B1950). These covered an area of 77 deg2 allowing us to probe the limits of the SSC out to radii as large as 8 deg.
We defined a sample of galaxies to a limit of , corresponding (assuming a mean ) to , the nominal galaxy limiting magnitude of the FLAIR-II system. This corresponds to an absolute magnitude of at the Shapley distance of 200. This gave samples of 600–1000 galaxies per field. We then removed any galaxies with published measurements in the NED database or measured by H. Quintana and R. Carrasco (private communication, 1997): 46 galaxies for F382, 81 for F383 and 200 for F444. For each observing run we then selected random subsamples of about 110 targets per field from the unobserved galaxies. When preparing each field for observation at the telescope we made a further selection of 80 targets to observe (10 fibres being reserved for measurement of the sky background). This final selection was essentially random, but we did reject any galaxies too close (less than about 1 arcminute) to another target already chosen or a bright star.
| Date | Field | RA (1950) Dec | exposure | seeing | weather | Nz |
|---|---|---|---|---|---|---|
| 1997 May 5 | F382 | 13:12:00 35:00:00 | 18000s | 2–3” | cloud | 69 |
| 1997 May 6 | F444 | 13:25:00 30:00:00 | 15000s | 2–3” | cloud | 47 |
| 1997 May 8 | F383 | 13:36:00 35:00:00 | 18000s | 3–5” | clear | 73 |
| 1998 April 25 | F383 | 13:36:00 35:00:00 | 15000s | 2–3” | clear | 61 |
| 1998 April 27 | F382 | 13:12:00 35:00:00 | 21000s | 3–5” | cloud | 56 |
| total | 306 |
Note: Nz is the number of galaxies with measured redshifts in each field.
We observed a total of 3 fields with the FLAIR-II spectrograph in 1997 May and two more in 1998 April. The details of the observations are given in Table 1. In 1997, out of 6 allocated nights we were only able to observe 3 FLAIR fields successfully due to poor weather and the first of these was repeated over 3 nights. Field F444 was observed in particularly poor weather resulting in a much lower number of measured redshifts. In 1998 we again had poor weather, and were only able to observe two fields in an allocation of 8 half-nights.
The data were reduced as in Drinkwater et al. (1996) using the dofibers package in IRAF (Tody 1993). We measured the radial velocities with the RVSAO package (Kurtz & Mink 1998) contributed to IRAF.
Redshifts were measured for absorption-featured spectra using the cross-correlation task XCSAO in RVSAO. We decided to adopt as the absorption velocity the one associated with the minimum error from the cross-correlation against the templates. In the great majority of cases, this coincided also with the maximum R parameter of Tonry & Davis (1979). The redshifts for the emission line objects were determined using the EMSAO task in RVSAO. EMSAO finds emission lines automatically, computes redshifts for each identified line and combines them into a single radial velocity with error. Spectra showing both absorption and emission features were generally measured with the two tasks XCSAO and EMSAO and the result with the lower error used. In two spectra with very poor signal (13:05:19.9 33:00:31 and 13:23:22.9 36:47:09) the emission lines were measured manually and a conservative error of 150 assigned. We measured velocities successfully for 306 galaxies in the sample: these are presented in Table 3.
We have compared the distributions of the galaxies we measured to the input samples to check they are fair samples. There is no significant difference in the distributions of the coordinates but there is a small difference in the magnitude distributions in the sense that the measured sample does not have as many of the faintest galaxies as the input sample. This is to be expected as these would have the lowest signal in the FLAIR-II spectra, but this should not affect our study of the spatial distribution significantly.
3 Results
Previous studies of the SSC have covered a very large region of sky, but we will limit our analysis in this paper to the region of sky we observed with FLAIR-II: the three UK Schmidt fields in Table 1. In some cases we will further restrict our analysis to the two Southern fields F382 and F383 where our observations were much more complete. The distribution of these fields and the galaxies we observed is shown in Fig. 1. We also show any previously observed galaxies and the known Abell Clusters.

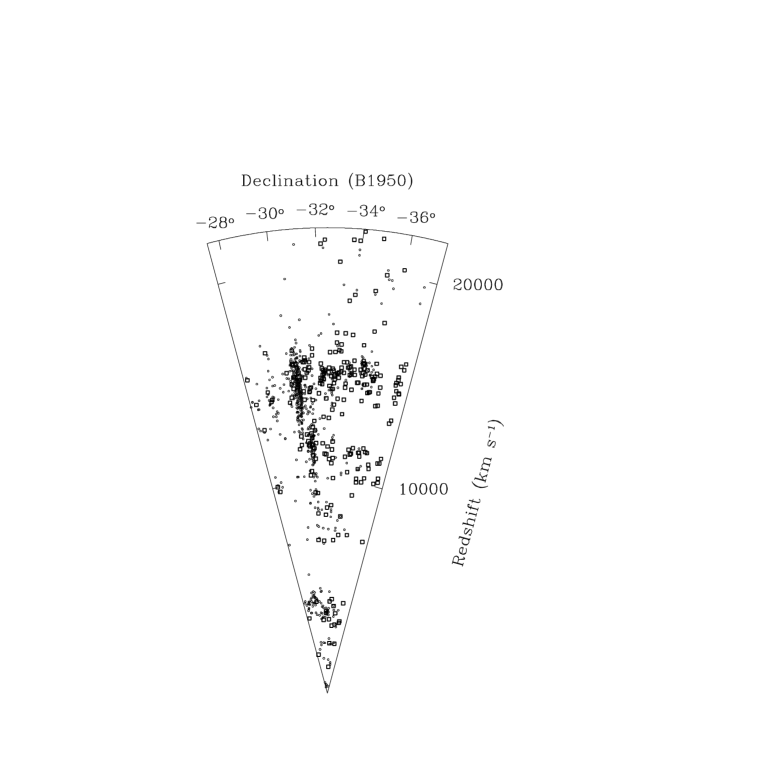
We present the resulting distribution of galaxies towards the Shapley supercluster in Fig. 2 as cone diagrams and in Fig. 3 as the histogram of all velocities up to . The importance of the SSC in this region of the sky is demonstrated by the fact the fully three quarters of the galaxies we measured belong to the SSC with velocities in the range 7580–18300. In all the plots the new data are indicated by different symbols to emphasise their impact (this can also be seen by comparing these figures with the equivalent ones in Paper II). It can be seen that by probing large regions of the SSC away from the rich Abell clusters, we have revealed additional structure which we discuss in the following sections.


3.1 Foreground Galaxies
First in agreement with previous work we also note the presence of a foreground wall of 269 galaxies (Hydra-Centaurus region) at with in the range . This distribution can be related with the nearby cluster A3627 associated with the “Great Attractor” (Kraan-Korteweg et al. 1996).
3.2 Clusters in the Shapley Supercluster
The previous observations reported in Papers I and II concentrated on the Abell clusters, clarifying the location of many of them. We reproduce a list of the main clusters in the SSC region in Table 2 for reference and plot their positions in Fig. 1. As noted above, our new measurements concentrate on galaxies outside the rich clusters in this field. In particular we observed virtually no galaxies in foreground or background clusters. We compare the distribution of the SSC galaxies to the Abell clusters in two velocity slices in Figs. 4 and 5.
In the near side of the SSC (: Fig. 4) we detected several new galaxies in the clusters A3571 and A3572. This region has a very extended velocity structure with several galaxies in the higher range (Fig. 5). At the velocity of the main part of the SSC (: Fig. 5) we have found additional galaxies in many of the clusters, especially the poorer ones like AS726, AS731 and A3564. The main conclusion however is that the clusters are seen as peaks in a sheet-like distribution rather than isolated objects.


3.3 Structure of the Shapley Supercluster
The main impact of our new data is to revise our knowledge of the large-scale structure of the SSC by measuring a large number of galaxies away from the rich Abell clusters previously studied. The majority of the galaxies we observed were part of the SSC, so our principal result is to show that the SSC is bigger than previously thought with an additional 230 galaxies in the velocity range compared to 492 previously known in our survey area.
Looking at the cone diagrams (Fig. 2) and the velocity histogram in Fig. 3 our first new observation is that the SSC is clearly separated into two components in velocity space, the nearer one at () to the East of the main concentration at (). The two regions contain 200 and 522 galaxies respectively. Some evidence for this separation was noted in the velocity distribution in Paper II, but it is much clearer with our new data.
Secondly, it can be see from the Declination cone diagram in Fig. 2 as well as the sky plots in Figs. 4 and 5 that the Southern part of the SSC consists of two large sheets of galaxies of which the previously measured Abell Clusters represent the peaks of maximum density.
To consider the significance of this extended distribution of galaxies it is helpful to define an inter-cluster sample consisting of galaxies in the Southern fields (F382 and F383) outside the known Abell clusters in the SSC velocity range. We eliminated all galaxies within a 0.5 degree radius (about 1 Abell radius) of all the clusters shown in Figs. 4 and 5. Very few of the previously-measured galaxies remain in the sample. In Fig. 6 we plot a histogram of the galaxy velocities in this inter-cluster sample compared to the predicted distribution of galaxies. The predicted distribution was based on the number counts of Metcalfe et al. (1991) normalised to the area of the Southern sample after removing clusters (44 deg2) and corrected for completeness (304 out of a possible 1194 galaxies measured in total). We also show the histogram (shaded) and predictions (dashed) for the previously-measured galaxies in the same field (128 out of a possible 1194). The histogram shows that even for the inter-cluster galaxies there is a large overdensity in the SSC region (): we measure 161 galaxies compared to 74 expected. This is an overdensity of detected at the 10 sigma level. This is averaged over the whole SSC velocity range; the overdensity in individual 1000 bins peaks at about 7. By comparison the previous data (42 galaxies, 33 expected) gave an overdensity of 1.3 detected at only 1.5 sigma. The overdensity for the whole SSC including the Abell clusters is, of course, much larger still.

These new observations mean that we must modify the conclusions of Paper I about the overall shape of the SSC. In Paper I it was concluded from the velocity distribution of the clusters that the SSC was very elongated and either inclined towards us or rotating. The SSC extends as far as our measurements to the South, so we find it is not elongated or flattened. We now suggest that it is more complex still, being composed of the known Abell clusters embedded in two sheets of galaxies of much larger extent.
4 Discussion
Our new observations of galaxies towards the Shapely supercluster have, by surveying a large area away from known clusters, revealed substantial new large structures in the region. The cluster is part of a much large structure than was apparent from the previous observations, extending uniformly in two sheets over the whole region we surveyed to the South of the core of the SSC. We detected an additional 230 members of the SSC in our whole survey area, representing a 50% increase on the previous total of 492 SSC galaxies. Our measurements to the North of the cluster were much less complete (only one field in poor weather) so we cannot exclude the possibility that these sheets of galaxies extend equally to the North. Recent results by Bardelli, Zucca & Zamorani (1999) support this possibility: they have measured galaxies in 18 small (40 arcmin) inter-cluster fields North of the core of the SSC and also find an overdensity at the SSC velocity.
In Paper I the effect of the SSC on the dynamics of the Local Group was estimated. It was found that the mass in the cluster could account for at least 25% of the motion of the Local Group with respect to the cosmic microwave background. Our new data suggest that the SSC is at least 50% more massive with a significant part of the extra mass in the closer sub-region. The SSC therefore has a more important effect on the Local Group that previously thought, although we defer a detailed calculation until we have additional data (Proust et al. 1999, in preparation).
Acknowledgements
We wish to thank Roberto de Propris for kindly providing the software to calculate the predicted galaxy distributions and we are grateful of the staff of the UKST and AAO for their assistance in the observations. This research was partially supported by the cooperative programme ECOS/ CONICYT C96U04 and HC acknowledges support from a Presidential Chair in Science. MJD acknowledges receipt of an AFCOP travel grant and a French Embassy Fellowship in support of visits to Paris Observatory where some of this work was carried out.
This research has made use of the NASA/IPAC Extragalactic Database (NED) which is operated by the Jet Propulsion Laboratory, California Institute of Technology, under contract with the National Aeronautics and Space Administration.
References
Bardelli, S., Zucca, E., Malizia, A., Zamorani, G., Scaramella, R., Vettolani, G., 1996, A&A, 305, 435
Bardelli, S., Zucca, E., Zamorani, G., Vettolani, G., Scaramella, R., 1998, MNRAS, 296, 599
Bardelli, S., Zucca, E., Zamorani, G., 1999, in Observational Cosmology: The Development of Galaxy systems’, Sesto 1998, (astro-ph/9811015)
Drinkwater, M.J., Currie, M.J., Young, C.K., Hardy, E., Yearsley, J.M., 1996, MNRAS, 279, 595
Infante L., Slezak E., Quintana H., 1996, A&A 315, 657
Kraan-Korteweg, R.C., Woudt, P.A., Cayatte, V., Fairall, A.P., Balkowski, C., Henning, P.A., 1996, Nature, 379, 519
Kurtz M.J., Mink D.J., 1998, PASP, in press
Metcalfe, N., Shanks, T., Fong, R., Jones, L.R., 1991, MNRAS, 249, 498
Parker, Q.A., Watson, F.G., 1995, in Wide Field Spectroscopy and the Distant Universe, 35th Herstmonceux Conference, ed. S.J. Maddox, & A. Aragon-Salamanca, (Singapore: World Scientific), 33
Parker, Q.A., 1997, in Wide Field Spectroscopy, 2nd conference of the working group of IAU Commission 9 on Wide Field Imaging, ed. Kontizas et al., (Dordrecht: Kluwer), 25
Pierre, M., Bohringer, H., Ebeling, H., Voges, W., Schuecker, P., Cruddace, R., MacGillivray, H., 1994, A&A 290, 725
Tody, D. 1993, in Astronomical Data Analysis Software and Systems II, A.S.P. Conference Ser., Vol 52, eds. R.J. Hanisch, R.J.V. Brissenden, & J. Barnes, 173.
Tonry J., Davis M., 1979, AJ, 84, 1511.
Quintana, H., Ramirez, A., Melnick, J., Raychaudhury, S., Slezak, E., 1995, AJ 110, 463 (Paper I)
Quintana, H, Melnick, J., Proust, D., Infante, L., 1997, A&A Sup, 125, 247 (Paper II)
Raychaudhury, S., 1989, Nature, 342, 251
Scaramella R., Baiesi-Pillastrini, G, Chincarini, G., Vettolani, G., Zamorani, G., 1989, Nature 338, 562
| RA (B1950) Dec | Name | Dist | Ref | |
| () | ||||
| 12:47:12 36:29:00 | - | 3527 | 6 | N |
| 12:51:18 26:07:00 | - | 1633 | 6 | N |
| 12:51:36 28:45:00 | 15854 | 3528 | 4 | I |
| 12:52:54 30:05:00 | 15960 | 3530 | 4 | I |
| 12:54:24 32:39:00 | 22454 | 3531 | 5 | II |
| 12:54:36 30:06:00 | 16100 | 3532 | 4 | I |
| 12:56:18 26:21:00 | 22994 | 1648 | - | N |
| 12:57:00 33:24:00 | 14330 | S718 | 4 | II |
| 12:58:18 32:10:00 | 5007 | 3537 | - | N |
| 13:05:54 34:18:00 | 27551 | 3542.1 | 4 | II |
| 13:05:54 34:18:00 | 39393 | 3542.2 | 4 | II |
| 13:08:36 33:49:00 | 22245 | 3545 | 6 | II |
| 13:11:36 29:11:00 | 22634 | 3549 | 5 | II |
| 13:12:24 33:23:00 | 17688 | S726 | 5 | I |
| 13:16:06 31:33:00 | 14818 | 3552 | 6 | I |
| 13:16:24 36:55:00 | 15110 | 3553 | 4 | I |
| 13:16:42 33:13:00 | 14570 | 3554 | 4 | II |
| 13:18:00 28:43:00 | 14810 | 3555 | 4 | I |
| 13:18:42 35:32:00 | 14960 | S729 | 5 | I |
| 13:20:12 34:37:00 | 15140 | S731 | 4 | II |
| 13:21:18 31:24:00 | 14130 | 3556.1 | 4 | B |
| 13:21:18 31:24:00 | 15066 | 3556.2 | 4 | B |
| 13:22:06 28:37:00 | 14270 | 3557.1 | 5 | II |
| 13:22:06 28:37:00 | 23084 | 3557.2 | 5 | II |
| 13:23:00 36:59:00 | 20806 | S733 | - | N |
| 13:24:06 26:51:00 | 10368 | 1736.1 | 3 | I |
| 13:24:06 26:51:00 | 13357 | 1736.2 | 3 | I |
| 13:25:06 31:14:00 | 14403 | 3558 | 3 | B |
| 13:26:58 31:21:00 | 14841 | 1327 | - | N |
| 13:27:06 29:16:00 | 13812 | 3559 | 4 | I |
| 13:28:38 31:33:43 | 12868 | 1329 | - | I |
| 13:29:00 32:58:00 | 13864 | 3560 | 3 | I |
| 13:30:42 31:25:00 | 14492 | 3562 | 3 | B |
| 13:31:30 34:58:00 | 14930 | 3564 | 3 | I |
| 13:33:48 33:43:00 | 3268 | 3565 | - | N |
| 13:36:06 35:18:00 | 15469 | 3566 | 4 | II |
| 13:39:24 26:01:00 | 32048 | 1771 | - | N |
| 13:43:54 37:40:00 | 11152 | 3570 | - | N |
| 13:44:36 32:37:00 | 11730 | 3571 | 2 | I |
| 13:45:18 33:08:00 | 12142 | 3572 | - | N |
| 13:46:18 30:03:00 | 4227 | 3574 | - | N |
| 13:49:42 32:38:00 | 11242 | 3575 | 4 | II |
| 13:51:30 27:36:00 | 14870 | 3577 | 4 | II |
| 13:54:42 24:29:00 | 11152 | 3578 | 3 | II |
References: I: Quintana et al. (1995) (Paper I) II: Quintana et al. (1997) (Paper II) N: NASA/IPAC Extragalactic Database (NED) B: Bardelli et al. (1998)
| RA (B1950) Dec | field | |||
|---|---|---|---|---|
| () | ||||
| 13:00:14.3 36:21:34 | 382 | 15.86 | 3443 | 36 |
| 13:00:35.5 33:42:37 | 382 | 15.53 | 23713 | 68 |
| 13:01:07.2 36:16:08 | 382 | 14.32 | 10298 | 56 |
| 13:01:28.5 36:11:57 | 382 | 15.74 | 27469 | 33 |
| 13:01:30.0 33:36:27 | 382 | 15.80 | 21437 | 126 |
| 13:01:34.5 37:14:51 | 382 | 15.61 | 15818 | 101 |
| 13:02:11.4 36:34:14 | 382 | 15.84 | 17698 | 13 |
| 13:02:38.8 36:15:49 | 382 | 14.90 | 37525 | 71 |
| 13:02:50.6 34:01:55 | 382 | 15.86 | 25647 | 42 |
| 13:03:01.9 36:28:58 | 382 | 14.39 | 10092 | 72 |
| 13:03:14.3 37:20:00 | 382 | 15.50 | 14899 | 97 |
| 13:03:16.0 35:44:30 | 382 | 15.70 | 24066 | 96 |
| 13:03:28.1 36:44:17 | 382 | 15.65 | 14943 | 69 |
| 13:03:44.6 35:40:23 | 382 | 15.78 | 14737 | 72 |
| 13:03:48.0 33:55:36 | 382 | 15.62 | 25475 | 184 |
| 13:04:03.2 36:42:55 | 382 | 15.92 | 15011 | 215 |
| 13:04:08.4 37:06:37 | 382 | 15.65 | 14058 | 47 |
| 13:04:32.6 35:51:35 | 382 | 14.53 | 15099 | 75 |
| 13:04:46.9 32:34:17 | 382 | 14.24 | 15419 | 132 |
| 13:04:49.9 34:09:57 | 382 | 15.97 | 18872 | 37 |
| 13:04:56.2 37:19:11 | 382 | 15.31 | 15024 | 60 |
| 13:05:12.2 37:06:25 | 382 | 15.48 | 13228 | 117 |
| 13:05:19.9 33:00:31 | 382 | 15.64 | 10171 | 150 |
| 13:05:20.7 34:03:32 | 382 | 15.69 | 15174 | 163 |
| 13:05:23.1 35:56:31 | 382 | 15.87 | 15763 | 139 |
| 13:05:40.8 34:09:29 | 382 | 15.19 | 15067 | 78 |
| 13:06:10.3 37:15:19 | 382 | 15.90 | 14312 | 81 |
| 13:06:34.7 34:29:38 | 382 | 15.21 | 13201 | 76 |
| 13:06:47.3 34:25:01 | 382 | 15.91 | 18578 | 77 |
| 13:06:55.9 35:20:35 | 382 | 15.40 | 28284 | 52 |
| 13:07:07.2 36:52:20 | 382 | 15.96 | 14350 | 61 |
| 13:07:29.6 32:36:43 | 382 | 14.51 | 9507 | 81 |
| 13:07:34.8 34:20:49 | 382 | 15.77 | 27522 | 60 |
| 13:07:48.3 37:02:06 | 382 | 14.28 | 14555 | 42 |
| 13:08:01.8 33:42:02 | 382 | 15.72 | 15113 | 95 |
| 13:08:19.8 32:43:36 | 382 | 15.87 | 43801 | 44 |
| 13:08:20.1 32:49:07 | 382 | 14.39 | 15899 | 84 |
| 13:08:25.4 36:24:37 | 382 | 15.11 | 3363 | 89 |
| 13:08:27.2 33:49:39 | 382 | 15.72 | 14837 | 25 |
| 13:09:01.9 34:02:24 | 382 | 15.82 | 27235 | 66 |
| 13:09:07.1 35:47:53 | 382 | 14.24 | 10491 | 54 |
| 13:09:15.4 37:11:40 | 382 | 15.59 | 13069 | 119 |
| 13:09:19.3 34:19:50 | 382 | 14.92 | 3196 | 80 |
| 13:09:34.3 35:04:41 | 382 | 15.83 | 23360 | 77 |
| 13:09:35.1 37:04:57 | 382 | 15.96 | 10414 | 81 |
| 13:09:39.0 33:45:40 | 382 | 15.55 | 13063 | 141 |
| 13:09:53.9 33:06:23 | 382 | 15.75 | 23141 | 79 |
| 13:09:55.1 35:59:01 | 382 | 15.04 | 14386 | 63 |
| 13:10:13.6 34:30:54 | 382 | 15.60 | 15159 | 154 |
| 13:10:31.9 32:40:51 | 382 | 15.75 | 29991 | 72 |
| 13:10:47.9 33:06:26 | 382 | 15.99 | 29645 | 117 |
| RA (B1950) Dec | field | |||
|---|---|---|---|---|
| () | ||||
| 13:10:54.7 35:10:08 | 382 | 14.99 | 7527 | 96 |
| 13:11:02.1 36:16:46 | 382 | 14.52 | 14367 | 76 |
| 13:11:09.8 33:39:12 | 382 | 14.21 | 15299 | 49 |
| 13:11:22.4 33:49:50 | 382 | 14.63 | 15355 | 81 |
| 13:11:23.5 36:57:36 | 382 | 15.21 | 10229 | 83 |
| 13:11:30.6 36:55:53 | 382 | 14.26 | 10688 | 59 |
| 13:11:42.3 33:07:11 | 382 | 14.46 | 8889 | 69 |
| 13:11:54.3 33:05:46 | 382 | 15.58 | 14649 | 115 |
| 13:12:05.7 33:29:36 | 382 | 15.99 | 30594 | 115 |
| 13:12:19.3 32:37:16 | 382 | 15.51 | 14280 | 90 |
| 13:12:23.9 33:22:29 | 382 | 14.20 | 14531 | 79 |
| 13:12:39.3 36:55:29 | 382 | 15.66 | 10048 | 85 |
| 13:12:39.9 32:26:47 | 444 | 14.15 | 13869 | 96 |
| 13:13:13.3 36:43:06 | 382 | 15.90 | 31971 | 88 |
| 13:13:21.9 32:37:24 | 382 | 14.71 | 15284 | 88 |
| 13:13:34.6 35:00:24 | 382 | 15.81 | 11473 | 98 |
| 13:13:37.9 32:35:56 | 382 | 15.92 | 14428 | 86 |
| 13:13:40.5 37:12:41 | 382 | 15.45 | 14637 | 23 |
| 13:13:54.9 32:59:57 | 382 | 15.08 | 14315 | 98 |
| 13:13:59.8 35:31:47 | 382 | 15.80 | 32384 | 102 |
| 13:14:30.4 31:33:07 | 444 | 15.97 | 14998 | 126 |
| 13:14:35.9 33:11:02 | 382 | 14.26 | 15334 | 48 |
| 13:14:37.9 33:39:08 | 382 | 14.86 | 15224 | 73 |
| 13:14:44.4 31:20:39 | 444 | 15.83 | 15632 | 176 |
| 13:15:00.6 32:57:45 | 382 | 15.93 | 25689 | 64 |
| 13:15:08.7 37:10:05 | 382 | 14.68 | 7330 | 66 |
| 13:15:17.0 35:32:43 | 382 | 14.98 | 3265 | 94 |
| 13:15:18.1 29:53:31 | 444 | 15.34 | 9769 | 73 |
| 13:15:18.6 36:43:14 | 382 | 15.30 | 14921 | 28 |
| 13:15:21.3 31:45:59 | 444 | 14.64 | 4358 | 114 |
| 13:15:29.4 37:02:54 | 382 | 15.06 | 15014 | 63 |
| 13:15:38.5 33:02:17 | 382 | 14.33 | 4342 | 51 |
| 13:16:06.6 33:09:45 | 382 | 15.55 | 13407 | 47 |
| 13:16:07.8 31:33:17 | 444 | 14.20 | 15641 | 103 |
| 13:16:17.3 36:58:20 | 382 | 14.91 | 14311 | 86 |
| 13:16:31.5 33:02:46 | 382 | 15.99 | 15047 | 69 |
| 13:16:38.9 33:05:31 | 382 | 15.94 | 14960 | 70 |
| 13:16:39.5 34:50:23 | 382 | 14.48 | 1247 | 28 |
| 13:16:40.8 33:15:18 | 382 | 14.33 | 14981 | 98 |
| 13:16:41.2 33:39:11 | 382 | 15.17 | 8432 | 37 |
| 13:16:49.5 36:42:34 | 382 | 15.76 | 11687 | 66 |
| 13:17:08.9 34:02:03 | 382 | 15.43 | 23525 | 110 |
| 13:17:24.0 34:50:33 | 382 | 15.64 | 13924 | 121 |
| 13:17:28.8 36:49:52 | 382 | 15.16 | 2359 | 47 |
| 13:17:38.4 34:04:01 | 382 | 15.70 | 15106 | 145 |
| 13:17:47.5 33:52:14 | 382 | 15.72 | 23532 | 69 |
| 13:17:53.0 34:40:14 | 382 | 15.73 | 15393 | 86 |
| 13:18:05.5 37:00:34 | 382 | 15.90 | 15980 | 78 |
| 13:18:06.6 27:47:20 | 444 | 15.97 | 15326 | 122 |
| 13:18:15.6 32:47:18 | 382 | 15.23 | 15768 | 64 |
| 13:18:16.1 35:20:17 | 382 | 15.47 | 15654 | 85 |
| RA (B1950) Dec | field | |||
|---|---|---|---|---|
| () | ||||
| 13:18:26.7 34:55:52 | 382 | 15.19 | 20402 | 58 |
| 13:18:31.3 35:33:05 | 382 | 15.42 | 15373 | 163 |
| 13:18:36.3 32:30:51 | 444 | 14.59 | 14469 | 110 |
| 13:18:38.8 35:54:22 | 382 | 15.02 | 15345 | 94 |
| 13:18:50.7 34:40:34 | 382 | 15.19 | 15222 | 196 |
| 13:18:58.0 35:16:37 | 382 | 14.53 | 13903 | 170 |
| 13:19:01.6 33:36:49 | 382 | 15.83 | 35049 | 132 |
| 13:19:07.6 35:29:36 | 382 | 15.62 | 16535 | 91 |
| 13:19:15.1 28:06:35 | 444 | 14.58 | 14030 | 85 |
| 13:19:21.1 34:32:11 | 382 | 15.54 | 15664 | 126 |
| 13:19:26.8 34:21:31 | 382 | 15.59 | 15667 | 127 |
| 13:19:39.1 33:06:29 | 382 | 15.88 | 3497 | 96 |
| 13:19:47.9 35:36:32 | 382 | 15.50 | 14747 | 142 |
| 13:19:54.1 33:10:27 | 382 | 14.26 | 14379 | 44 |
| 13:20:04.8 34:47:15 | 382 | 14.97 | 7237 | 96 |
| 13:20:10.1 32:27:07 | 382 | 14.78 | 8503 | 67 |
| 13:20:13.1 34:43:27 | 382 | 15.00 | 16498 | 84 |
| 13:20:24.0 35:03:57 | 382 | 15.76 | 14710 | 59 |
| 13:20:52.7 35:38:04 | 382 | 14.80 | 3792 | 78 |
| 13:20:53.3 34:11:58 | 382 | 15.45 | 15426 | 126 |
| 13:20:57.0 31:26:49 | 444 | 15.92 | 15170 | 63 |
| 13:20:58.5 27:43:52 | 444 | 14.54 | 13674 | 69 |
| 13:21:04.1 34:24:00 | 382 | 14.49 | 14472 | 103 |
| 13:21:05.8 31:55:18 | 444 | 14.91 | 15249 | 107 |
| 13:21:08.5 29:02:44 | 444 | 15.63 | 14096 | 98 |
| 13:21:30.5 31:23:03 | 444 | 14.66 | 14390 | 176 |
| 13:21:33.1 32:37:59 | 382 | 14.36 | 14251 | 135 |
| 13:21:37.9 29:59:26 | 444 | 14.43 | 3634 | 98 |
| 13:21:39.8 33:42:58 | 382 | 15.35 | 14827 | 87 |
| 13:21:51.8 36:02:13 | 382 | 15.14 | 10771 | 96 |
| 13:21:58.5 34:06:56 | 382 | 15.04 | 8371 | 106 |
| 13:22:02.2 31:18:01 | 444 | 16.00 | 14773 | 14 |
| 13:22:20.4 33:39:05 | 382 | 15.94 | 27194 | 132 |
| 13:22:46.5 36:19:44 | 382 | 15.34 | 15208 | 42 |
| 13:22:56.5 37:01:27 | 382 | 15.44 | 10225 | 123 |
| 13:23:22.9 36:47:09 | 382 | 15.98 | 19958 | 150 |
| 13:23:57.5 31:16:09 | 444 | 16.00 | 14660 | 117 |
| 13:24:04.7 33:55:06 | 382 | 15.89 | 14909 | 34 |
| 13:24:08.5 31:56:19 | 444 | 15.71 | 13839 | 84 |
| 13:24:12.5 29:48:56 | 444 | 14.88 | 1866 | 78 |
| 13:24:15.0 30:57:58 | 444 | 14.92 | 16332 | 122 |
| 13:24:18.1 36:49:27 | 382 | 15.72 | 14367 | 76 |
| 13:24:21.4 37:00:34 | 382 | 15.62 | 14520 | 36 |
| 13:24:28.2 36:49:27 | 383 | 15.74 | 15098 | 102 |
| 13:24:28.4 36:14:05 | 383 | 15.31 | 14658 | 62 |
| 13:24:35.3 32:02:27 | 444 | 15.48 | 14176 | 82 |
| 13:24:58.9 32:21:44 | 383 | 15.66 | 11832 | 16 |
| 13:25:13.1 31:30:38 | 444 | 15.97 | 15590 | 96 |
| 13:25:14.4 32:30:11 | 383 | 15.86 | 11585 | 57 |
| 13:25:20.1 31:25:21 | 444 | 15.17 | 12200 | 135 |
| 13:25:25.0 29:59:01 | 444 | 15.17 | 12776 | 81 |
| RA (B1950) Dec | field | |||
|---|---|---|---|---|
| () | ||||
| 13:25:41.9 33:44:20 | 383 | 15.86 | 24911 | 114 |
| 13:25:42.1 33:56:52 | 383 | 15.88 | 14661 | 129 |
| 13:26:14.4 28:34:52 | 444 | 14.20 | 12289 | 58 |
| 13:26:27.7 31:47:04 | 444 | 14.74 | 14060 | 114 |
| 13:26:39.2 31:17:35 | 444 | 14.03 | 15430 | 87 |
| 13:26:52.9 28:00:28 | 444 | 14.44 | 10015 | 119 |
| 13:27:09.0 28:59:02 | 444 | 15.83 | 14201 | 114 |
| 13:27:14.2 27:43:01 | 444 | 15.12 | 10237 | 114 |
| 13:27:22.6 32:32:55 | 383 | 14.33 | 15666 | 78 |
| 13:27:24.1 29:14:38 | 444 | 15.23 | 14488 | 30 |
| 13:27:39.0 34:21:48 | 383 | 15.95 | 21467 | 84 |
| 13:27:51.3 31:36:28 | 444 | 15.96 | 14470 | 75 |
| 13:28:11.4 32:21:51 | 383 | 15.68 | 15986 | 64 |
| 13:28:19.5 32:28:46 | 383 | 15.73 | 3468 | 95 |
| 13:28:32.5 33:38:26 | 383 | 15.58 | 22089 | 90 |
| 13:28:58.4 36:41:55 | 383 | 15.35 | 14996 | 97 |
| 13:29:07.6 36:03:10 | 383 | 15.33 | 20314 | 76 |
| 13:29:14.5 33:31:57 | 383 | 14.93 | 8770 | 66 |
| 13:29:16.4 33:03:38 | 383 | 15.08 | 13640 | 98 |
| 13:29:24.5 33:07:15 | 383 | 14.71 | 15243 | 81 |
| 13:29:33.4 32:58:55 | 383 | 14.95 | 13916 | 47 |
| 13:29:33.7 37:15:24 | 383 | 14.96 | 15295 | 29 |
| 13:29:40.1 33:54:18 | 383 | 15.87 | 14770 | 96 |
| 13:29:40.9 37:02:12 | 383 | 15.58 | 15687 | 101 |
| 13:29:49.3 34:53:51 | 383 | 15.23 | 15122 | 39 |
| 13:30:00.5 34:27:42 | 383 | 15.47 | 36879 | 77 |
| 13:30:00.7 28:45:40 | 444 | 15.57 | 5526 | 93 |
| 13:30:04.4 32:54:49 | 383 | 15.19 | 15698 | 50 |
| 13:30:10.9 32:50:38 | 383 | 14.62 | 14951 | 53 |
| 13:30:13.4 37:14:36 | 383 | 15.79 | 15164 | 67 |
| 13:30:14.9 33:02:41 | 383 | 15.65 | 14838 | 115 |
| 13:30:15.5 34:11:36 | 383 | 14.84 | 7491 | 16 |
| 13:30:19.9 31:20:49 | 444 | 15.96 | 14559 | 123 |
| 13:30:34.1 33:41:34 | 383 | 15.99 | 22010 | 143 |
| 13:30:45.7 31:13:03 | 444 | 14.97 | 15201 | 74 |
| 13:30:53.3 35:08:58 | 383 | 15.92 | 15377 | 147 |
| 13:31:01.2 35:07:39 | 383 | 15.88 | 21640 | 89 |
| 13:31:17.6 31:13:59 | 444 | 15.86 | 14842 | 89 |
| 13:31:17.8 27:54:11 | 444 | 14.85 | 9187 | 74 |
| 13:31:19.5 34:48:41 | 383 | 15.28 | 14917 | 69 |
| 13:31:21.8 32:43:17 | 383 | 14.43 | 15177 | 70 |
| 13:31:25.2 29:07:15 | 444 | 15.35 | 14008 | 96 |
| 13:31:30.3 35:09:30 | 383 | 15.37 | 9416 | 65 |
| 13:31:33.2 31:28:46 | 444 | 14.89 | 16271 | 85 |
| 13:31:39.7 36:33:12 | 383 | 16.00 | 15274 | 150 |
| 13:31:48.9 34:46:49 | 383 | 15.55 | 2367 | 21 |
| 13:31:53.3 34:58:33 | 383 | 15.35 | 16579 | 20 |
| 13:32:17.4 33:46:46 | 383 | 14.98 | 3878 | 52 |
| 13:32:28.5 31:10:15 | 444 | 14.86 | 14845 | 86 |
| 13:32:31.3 33:54:20 | 383 | 14.18 | 7208 | 66 |
| 13:32:48.9 31:27:42 | 444 | 15.94 | 11794 | 98 |
| RA (B1950) Dec | field | |||
|---|---|---|---|---|
| () | ||||
| 13:32:54.0 35:18:55 | 383 | 14.42 | 15438 | 54 |
| 13:33:21.5 36:38:27 | 383 | 15.17 | 15135 | 51 |
| 13:33:37.8 32:50:15 | 383 | 15.46 | 15688 | 105 |
| 13:33:41.2 33:49:11 | 383 | 14.19 | 3787 | 43 |
| 13:33:45.9 28:50:04 | 444 | 14.16 | 4516 | 89 |
| 13:34:05.6 34:08:42 | 383 | 15.14 | 4133 | 76 |
| 13:34:11.1 33:34:08 | 383 | 14.29 | 13931 | 87 |
| 13:34:12.6 28:16:45 | 444 | 15.90 | 15262 | 98 |
| 13:34:28.4 34:38:09 | 383 | 15.50 | 29247 | 103 |
| 13:34:43.7 31:37:28 | 444 | 15.38 | 11598 | 98 |
| 13:34:45.1 34:16:42 | 383 | 15.67 | 22108 | 68 |
| 13:34:49.6 33:35:55 | 383 | 15.54 | 11289 | 85 |
| 13:34:50.2 35:14:29 | 383 | 16.00 | 15162 | 89 |
| 13:34:59.3 35:23:12 | 383 | 14.68 | 15695 | 71 |
| 13:35:15.2 34:48:29 | 383 | 15.47 | 15162 | 92 |
| 13:35:21.3 31:41:48 | 444 | 15.26 | 14694 | 127 |
| 13:35:27.8 35:42:28 | 383 | 15.50 | 11327 | 74 |
| 13:35:47.0 34:17:07 | 383 | 15.24 | 15420 | 116 |
| 13:35:52.1 35:13:11 | 383 | 15.91 | 14685 | 37 |
| 13:36:00.6 36:11:38 | 383 | 14.66 | 13789 | 55 |
| 13:36:04.4 35:22:16 | 383 | 15.50 | 15223 | 89 |
| 13:36:04.7 36:20:26 | 383 | 15.80 | 13755 | 74 |
| 13:36:08.6 32:20:51 | 444 | 14.76 | 16298 | 77 |
| 13:36:15.9 36:39:42 | 383 | 15.30 | 15741 | 44 |
| 13:36:18.3 33:47:22 | 383 | 15.75 | 21245 | 28 |
| 13:36:32.6 35:12:49 | 383 | 15.47 | 19147 | 68 |
| 13:36:43.3 35:24:54 | 383 | 15.19 | 15791 | 78 |
| 13:36:44.2 33:45:54 | 383 | 15.13 | 15268 | 76 |
| 13:36:49.8 35:41:31 | 383 | 15.49 | 29346 | 77 |
| 13:36:56.1 33:24:07 | 383 | 14.54 | 15381 | 43 |
| 13:36:56.6 32:49:51 | 383 | 15.43 | 15345 | 135 |
| 13:37:12.1 32:48:53 | 383 | 15.43 | 11841 | 59 |
| 13:37:14.8 32:35:15 | 383 | 14.56 | 7254 | 14 |
| 13:37:15.1 34:05:41 | 383 | 15.66 | 21441 | 89 |
| 13:37:37.8 33:44:08 | 383 | 15.91 | 14867 | 61 |
| 13:37:39.9 35:25:16 | 383 | 15.54 | 15641 | 57 |
| 13:37:59.8 33:53:02 | 383 | 15.99 | 15579 | 30 |
| 13:38:01.9 33:25:24 | 383 | 15.47 | 15167 | 66 |
| 13:38:12.4 34:07:13 | 383 | 15.57 | 15485 | 98 |
| 13:38:22.3 35:24:09 | 383 | 14.38 | 15068 | 85 |
| 13:38:39.8 34:07:45 | 383 | 15.56 | 16973 | 66 |
| 13:38:40.8 33:41:14 | 383 | 15.39 | 15161 | 48 |
| 13:38:49.2 33:49:06 | 383 | 15.76 | 14610 | 47 |
| 13:38:52.4 35:37:34 | 383 | 14.88 | 11378 | 62 |
| 13:38:57.2 32:55:58 | 383 | 15.49 | 11945 | 65 |
| 13:39:27.0 36:56:20 | 383 | 14.84 | 11288 | 31 |
| 13:39:35.6 34:37:32 | 383 | 15.61 | 4454 | 51 |
| 13:39:43.7 37:21:55 | 383 | 15.78 | 10122 | 76 |
| 13:39:55.3 35:55:15 | 383 | 15.64 | 21887 | 155 |
| 13:40:02.0 34:43:11 | 383 | 15.07 | 16170 | 50 |
| 13:40:26.8 36:04:17 | 383 | 15.18 | 24883 | 122 |
| RA (B1950) Dec | field | |||
|---|---|---|---|---|
| () | ||||
| 13:40:33.4 32:59:43 | 383 | 15.55 | 12267 | 97 |
| 13:40:34.0 37:23:43 | 383 | 15.64 | 11113 | 52 |
| 13:40:40.2 34:31:47 | 383 | 15.08 | 17030 | 72 |
| 13:40:42.0 36:09:58 | 383 | 14.60 | 4311 | 59 |
| 13:40:52.6 34:49:27 | 383 | 14.32 | 16227 | 183 |
| 13:40:59.8 35:31:12 | 383 | 14.38 | 11637 | 28 |
| 13:41:14.7 34:05:19 | 383 | 14.87 | 11202 | 76 |
| 13:41:23.2 36:22:42 | 383 | 15.81 | 11498 | 46 |
| 13:41:23.9 33:51:28 | 383 | 15.21 | 11818 | 71 |
| 13:41:47.3 32:24:12 | 383 | 15.53 | 12438 | 76 |
| 13:41:49.3 35:11:00 | 383 | 15.45 | 37694 | 72 |
| 13:41:52.3 33:21:05 | 383 | 14.32 | 11063 | 31 |
| 13:41:55.5 34:22:45 | 383 | 15.24 | 14660 | 48 |
| 13:42:08.6 34:58:58 | 383 | 15.67 | 17045 | 66 |
| 13:42:10.1 32:38:25 | 383 | 15.77 | 12085 | 83 |
| 13:42:25.1 32:23:47 | 383 | 14.23 | 9469 | 41 |
| 13:42:33.6 36:31:58 | 383 | 15.05 | 11531 | 64 |
| 13:42:38.9 35:01:09 | 383 | 15.79 | 17237 | 50 |
| 13:42:56.1 33:46:54 | 383 | 15.10 | 15058 | 33 |
| 13:43:08.2 33:29:39 | 383 | 14.32 | 11662 | 44 |
| 13:43:17.6 34:14:50 | 383 | 15.67 | 24806 | 35 |
| 13:43:29.2 32:55:23 | 383 | 15.54 | 11760 | 52 |
| 13:43:32.6 35:50:50 | 383 | 15.11 | 11548 | 27 |
| 13:43:33.0 32:24:59 | 383 | 15.36 | 12884 | 52 |
| 13:44:02.0 33:04:05 | 383 | 15.98 | 11113 | 157 |
| 13:44:06.5 37:12:33 | 383 | 15.71 | 11357 | 50 |
| 13:44:06.7 35:03:53 | 383 | 15.23 | 11453 | 47 |
| 13:44:15.6 32:39:29 | 383 | 15.76 | 12304 | 159 |
| 13:44:16.1 33:08:38 | 383 | 15.44 | 11518 | 77 |
| 13:44:19.6 33:23:43 | 383 | 15.87 | 13010 | 70 |
| 13:44:22.8 36:07:31 | 383 | 15.04 | 10963 | 66 |
| 13:44:29.3 33:21:14 | 383 | 15.38 | 16117 | 48 |
| 13:44:29.5 32:50:50 | 383 | 14.99 | 11694 | 49 |
| 13:44:56.8 32:56:05 | 383 | 14.92 | 10328 | 29 |
| 13:45:05.5 32:37:12 | 383 | 15.59 | 11789 | 80 |
| 13:45:11.0 33:06:07 | 383 | 14.35 | 11901 | 34 |
| 13:45:18.8 32:32:24 | 383 | 15.74 | 12585 | 138 |
| 13:45:29.9 34:26:11 | 383 | 15.15 | 13896 | 88 |
| 13:45:37.7 35:26:14 | 383 | 15.90 | 30107 | 78 |
| 13:45:47.9 34:24:28 | 383 | 15.29 | 27740 | 73 |
| 13:45:49.1 37:14:52 | 383 | 15.47 | 11128 | 83 |
| 13:46:04.9 32:36:32 | 383 | 14.39 | 11603 | 49 |
| 13:46:05.4 33:09:44 | 383 | 14.72 | 10868 | 31 |
| 13:46:06.3 33:43:18 | 383 | 15.06 | 11327 | 35 |
| 13:46:56.0 35:14:07 | 383 | 15.60 | 28576 | 122 |
| 13:46:59.9 33:02:31 | 383 | 15.78 | 16129 | 67 |
| 13:47:03.7 36:30:57 | 383 | 15.22 | 30091 | 89 |
| 13:47:22.5 32:49:37 | 383 | 14.35 | 10522 | 50 |
| 13:47:38.1 32:25:54 | 383 | 15.49 | 11098 | 51 |
| 13:47:48.9 32:38:51 | 383 | 15.12 | 11270 | 37 |
| 13:48:08.4 35:50:11 | 383 | 15.46 | 22610 | 95 |