Infrared photometry of the Local Group dwarf irregular galaxy IC 10
Abstract
We present near infrared photometry for the central area of the irregular dwarf galaxy IC 10. Red stellar population of IC 10 contains young (10 – 50 Myr) massive red supergiants. Most of AGB stars are younger than 1 Gyr and have masses up to 12 . Comparing the red supergiants of IC 10 and IC 1613 we have determined the reddening of and the dereddened distance modulus mag of Population I stars in IC 10. Detection of six emission structures clearly outline two star forming regions in the central area of IC 10. There is no emissions down to 4.65 indicating that the dominant excitation mechanism of the molecular gas is from UV radiation from hot young stars. From the comparison of and fluxes, we derive average extinction toward the star forming regions . The summarized SFR derived from six and emission structures in our field of view is 0.6
Key Words.:
galaxies: Local Group – galaxies: individual: IC 10, IC 1613 – galaxies: stellar content1 Introduction
IC 10 is an irregular dwarf member of the Local group. This galaxy is an extremely peculiar and interesting object. As pointed out by Hubble (1936): ”The third nebula, IC 10 is one of the most curious objects in the sky. Mayall, at the Lick observatory, was the first to call attention to its peculiarities…The photographs are difficult to interpret fully, but they suggest that a portion of a large, late-type spiral is dimly seen between obscuring clouds”.
Shostak et al. (1989) and Wilcots et al. (1998) have mapped the extended gas around the irregular galaxy IC 10. They have shown that the gas around this galaxy is also amazingly complex. Singe-dish observations of IC 10 had suggested that the outer envelope was turbulent and there were velocity gradients at small and large scales (Cohen 1979), but the new VLA mosaic shows that the extended HI is concentrated in three arm-like structures and that IC 10 is merging with a large infalling cloud to the south of the disk (Hunter 1997).
The stellar content of IC 10 was investigated by several authors. Massey & Armandroff (1995) found a very well populated blue plume of main-sequence luminous stars in the color-magnitude diagram. They also found that IC 10 had a global surface density of Wolf-Rayet stars 3 times higher than any other Local Group galaxy. This high concentration of WR stars reinforces the idea that IC 10 is undergoing rather strong bursts of star formation. Saha et al. (1996) using Gunn filters reported the existence of a blue plume containing the blue supergiants, a red vertical plume at and other bright red supergiants redward of it. They also investigated the variable stars in IC 10 and reported four Cepheids. Wilson et al. (1996) confirmed the variability of these stars from IR photometry. Sakai et al. (1998) identify a well populated red giant branch, an ill-defined blue main sequence population and intermediate-age asymptotic giant branch. In latest works of Hodge & Zucker (1999), Hunter (1999) and Tikhonov (1999) stellar content, reddening and distance are also analyzed. Each of the above works however reported different values of the distance modulus and the reddening, varying from to and to . The calculations of reddening and distance reported above are based on different stellar population types — Wolf-Rayet stars (Massey & Armandroff 1995), Cepheid variables (Saha et al. 1996; Wilson et al. 1996) and the tip of the red giant branch method ( Sakai et al. 1998, Tikhonov 1999). The most probable explanation of these so different results is that IC 10 lies extremely close to the Galactic plane thus having a high optical foreground reddening. Another possible reason for these differences could be the fact that since this is a starburst galaxy it has a variable internal reddening.
This paper presents photometry of the central area of IC 10. The purposes of our work are to determine the stellar content, the reddening, the distance modulus and the ages of different stellar populations in IC 10 by means of an approach which is less sensitive to both the foreground and the internal reddening and is at the same time sensitive to the star formation activity – near IR observations.
Our observational material and data reduction techniques are described in Section 2 together with our analysis of the photometric errors and completeness corrections. Several aspects of the color-magnitude diagrams (CMD) of IC 10 including analysis of stellar content are described in Section 4. IC 10’s reddening, distance modulus and age are determined in Section 5 and Section 6. The recent star formation activity based on the emission is analyzed in Section 8 and in Section 9 we summarize the most important results of the present investigation.
2 Observations and data reduction
2.1 and observations
The data discussed here were acquired with the Infrared Camera ”CAMILA” (Cruz-Gonález et al. 1996) with a NICMOS3 ( pixels) detector attached to the 2.1-m telescope of the Observatorio Astronomíco National ”San Pedro Martir”, México. The scale was arcsec/pixel, resulting in a field size of about by arcmin. The total exposure times are 600 sec in , 480 sec. in and 640 sec. in . A set of frames was taken on January 11-13, 1998. images of the Local group irregular galaxy IC 1613 were being taken for comparison purposes on the same nights. An additional set of frames of IC 10 and Off-field (a field 30 arcmin north) were obtained on the 2-m Ritchey-Chretien telescope of the Bulgarian National Astronomical Observatory on September 15, 1999 with a Photometrics camera. The exposure times of optical images are 900 sec. The scale at the Cassegrain-focus CCD was and the observing area was centered on the same field as in infrared images. The seeing during these observations was between with stable and very good photometric conditions. Twelve UKIRT (Casali & Hawarden 1992) standard stars as well as Landolt (1992) standards were taken before and after all observations.
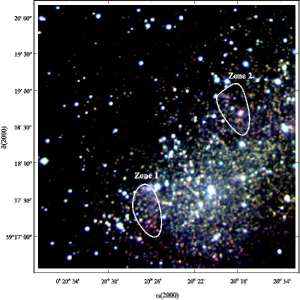
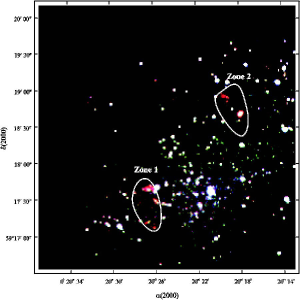
A red-green-blue composite true color image generated from J (blue), H (green) and K (red) images is shown in Fig. 1.
The IRAF data reduction package was used to carry out the basic image reduction. The stellar photometry of the frames was done using DAOPHOT (Stetson 1993).
In order to estimate the internal accuracy of our photometry we used the formal errors from the DAOPHOT package. For all stars the standard errors vs. magnitudes are displayed in Fig. 2. As can be seen we do not have large errors up to the magnitudes: , and . Only the stars brighter than these limits are used on the color-magnitude diagrams.
The artificial star technique (Stetson 1991) was used to outline the limits of our photometry and series of artificial frames were reduced in the same manner as the original frames. Since completeness is a function of the distance from the galaxy center and of the limiting magnitude, we performed the procedure in two radial annuli with arcmin and arcmin. Fig. 3 shows the completeness functions in the two different annuli plotted as a function of the K magnitude. As can be seen, completeness limit is at for the both zones. The analysis of Fig. 3 also shows that the large pixel of the IR detector can affect the detection of the bright stars. The number of detected stars for the fixed magnitude in the outer region is larger than in the inner region. We estimate our completeness limit to be 17.0 magnitudes in and filters.


2.2 and observations
Narrow band imaging in the , S(1) and continuum lines was carried out on the last night of the ”San Pedro Martir” observing run — 13 January 1998. The atmospheric conditions were stable. Flux calibration was made using the WD atmosphere model of the faint ESO DA0 spectrophotometric standard star G191-B2B (Oke 1990, Bohlin et al. 1995). Images of the standard star were taken at the same airmasses as the program fields.
3 Comparison with previous works
Unfortunately there are only two papers on the IR-photometry of IC 10 and IC 1613 and they deal with a few stars only — Wilson et al. (1996) and Elias & Flogel (1985).
There is only one star from our field of observations that is present in the infrared IC 10 data of Wilson et al. (1996) — the very red variable star V3. The difference in color is and in magnitude is .
There are two stars common to our and Elias & Flogel’s (1985) IR photometry of IC 1613 — the well known variable red supergiants V32 and V38 (Sandage 1971). Elias & Flogel (1985) give observed colors and magnitudes for V32 and V38 and , respectively. The differences between our data and that of Elias & Flogel are 0.1 in and 0.05 in for both stars.
Taking into account that V3 in IC 10 and V32 and V38 in IC 1613 are variable stars we have a good agreement between our data and that of Wilson et al. (1996) and Elias & Flogel (1985).
4 Color-magnitude diagrams
Fig. 4 and Fig. 5 show the and color-magnitude diagrams obtained for IC 10. Only stars with photometric errors less than were selected in all filters. Our final list contains 1036 sources with , and magnitudes. Data are available by e-mail on request to the first author.


4.1 Field star contamination
IC 10 is situated close to the galactic plane () and the foreground contamination is significant. It is obviously necessary to check the level of field star contamination before discussing the detailed structure of the color-magnitude diagrams and the stellar content of the IC 10.
The () color-magnitude diagrams of IC 10 and an Off-field image are shown in Fig. 6. The Off-field images were taken 30 arcmin north of the center of the galaxy with the same exposure time as the galaxy field (900 sec in both filters). As can be easily seen most of the stars with are field stars. The tip of the IC 10 main sequence stars is located close to and . The few most luminous stars from the red plume are located between and . These results agree with the analysis of Hodge & Zucker (1999) who obtained photometry with 3.5 m. Apache Pont Telescope.
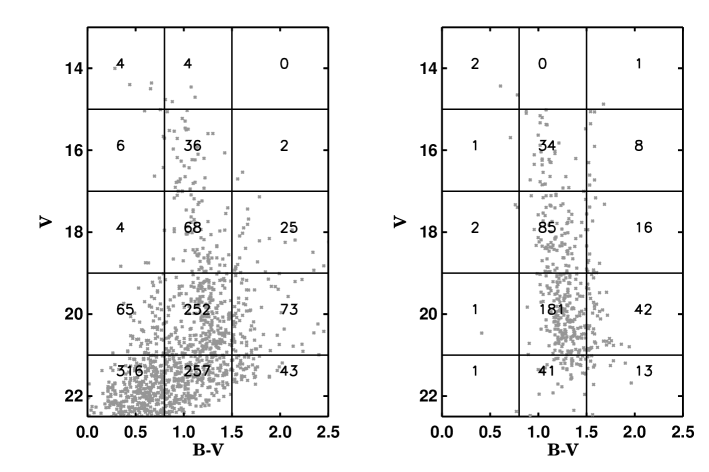
To decontaminate the color-magnitude diagram of IC 10 we divided the two CMDs, ”galaxy+field” and ”field” into 15 boxes (shown in Fig. 6 ) - five intervals in magnitude and three in color. The stars in each box in the two diagrams are counted. Then, an equivalent number of stars is removed from the single boxes of the diagram of ”galaxy+field”, on the basis of the number of field stars found in the diagram of the ”field” alone. Such obtained list of statistically selected field stars in the color-magnitude diagram were cross-identified with the IR photometry data and were superimposed on the color-magnitude diagram in Fig. 7 as open diamonds.
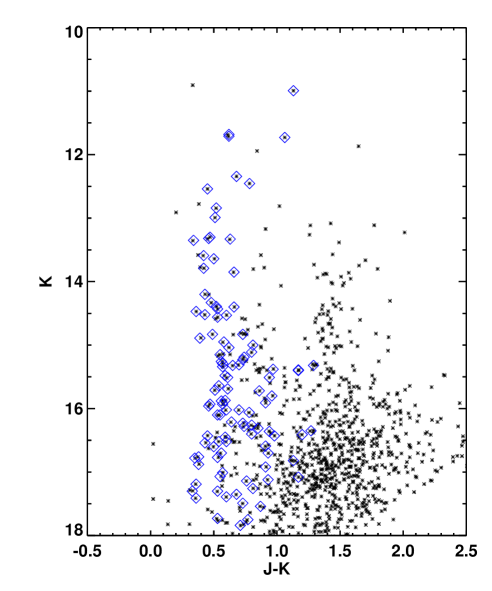
The analysis of Fig. 7 shows that most of the stars between and (see Fig. 4 and Fig. 5) are field stars while stars with colors greater than 1 and belong to IC 10 and only few field stars fall in the latter zone. The red supergiants stand around and mag. The AGB stars are visible at . The red giant population can be seen at the limit of our photometry at . Our photometry is not deep enough to see any IC 10 main sequence stars there.
The observed and color magnitude diagrams are decontaminated by subtracting the selected field stars (open diamonds in Fig. 7) from the list of photometry. The remaining of the stars between , and are considered to be the field stars and are also removed.
5 Reddening and Distance
A common method of determination of reddening and distance is the comparison with another well known galaxy. In our case we used as a comparison galaxy IC 1613. The selected area of IC 1613 is centered on the HII regions of the northeast sector. IC 1613 has a very low reddening (Sandage 1971; Freedman 1988; Georgiev et al. 1999), the field contamination from our Galaxy is negligible (Georgiev et al. 1999) and it has a relatively well known distance — (Freedman 1988, Saha et al. 1992). We choose to compare red supergiants of two galaxies. Elias et al. (1981) demonstrated that infrared photometry of M supergiants does not provide by itself reliable distances to galaxies because the stellar magnitude depends on galaxian luminosity and metallicity. In our case we have two galaxies with similar luminosity and metallicity. According to Mateo (1998) IC 10 has a total magnitude and and IC 1613 has and . Most of the red supergiants are known variables at visual wavelengths but there are no large variations in the infrared. Typical amplitudes are about 0.1 mag or less in . Irrespective of the very similar metallicities derived for both galaxies the () color magnitude diagrams were used to minimize the metallicity effects. The mean and values for the two red variables V38 and V32 of IC 1613 were corrected for reddening () and compared with the mean values of the brightest four red supergiants in IC 10 standing between and (marked in Fig. 8 as crosses). Based on the assumption that reddening is the only reason for the differences between the colors of the red supergiants of the two galaxies we derived mag. This value corresponds to mag, (the error is our conservative estimate) using the relation (Bessell & Brett 1988). The calculated distance modulus for IC 10 was obtained from the corresponding differences in the dereddened magnitudes. These values are very close to the values reported by Sakai et al. (1998) for Population I stars (, .
The superimposition of the color-magnitude diagrams of the two galaxies is shown in Fig. 8.
6 Age
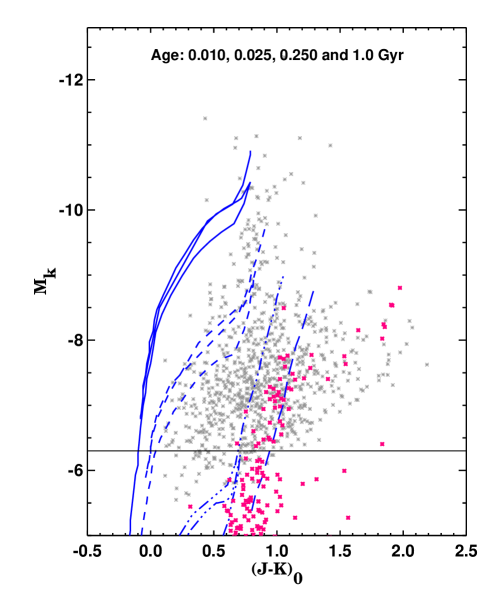
The next step in our analysis was to determine the age interval of IC 10. We used the () color magnitude diagram assuming , and and superimposing the isochrones for , , and years from Padua’s library (see Bertelli et al. 1994).
The analysis of the superimposed isochrones (Fig. 9) indicates that the red supergiants have ages between 10 and 50 Myr. The unambiguous presence of young red supergiants population corresponds to the presence of a large number of WR stars and the hypothesis of recent star burst formation. Most of AGB stars have ages less than 1 Gyr and can be identify at . There is a significant presence of AGB stars around 1 Gyr also. Some older AGB stars with ages of several Gyr can be seen.
In the same plot photometry of the stars in twelve Large Magellanic Clouds globular clusters (Ferraro et al. 1995) are also given (dark asterisks in Fig. 9). The horizontal line locate the separation threshold between AGB (upper part) and RGB (lower part) stars as given in Ferraro at al. (1995). The comparison with globular clusters AGB stars confirms the presence of early AGB stars in IC 10.
7 Theoretical H–R diagrams
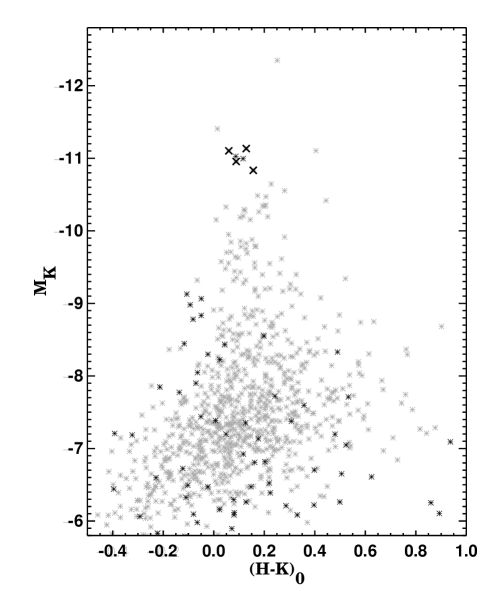
One of the best ways to analyze the stellar content of a galaxy is to put its stars on the theoretical H–R diagram. The comparison with theoretical evolutionary mass tracks predicted by theoretical models will give us the evolutionary stage of each star. To plot the stars on the theoretical H–R diagram we need to determine their effective temperatures and bolometric corrections (BC). We used Costa & Frogel’s (1996) method to transform K magnitudes and colors into and . We first transformed our magnitudes and colors into the CIT system by means of equations 1 and 2 derived by Ruelas-Mayorga (1997) for the Mexican set of filters. Then using equation 6 from Costa & Frogel (1996) we transformed our colors to the Johnson system. The bolometric correction for the K magnitude was calculated using their equation 1, while for each star was derived as the mean value of the temperatures given by their equations 8 and 9. The evolutionary mass tracks from Charbonnel et al. (1993) for were superimposed on the same plot. For IC 10 we used the distance modulus and reddening derived in Section 5. For IC 1613 – our comparison galaxy, the reddening and distance are (Sandage 1971; Freedman 1988; Georgiev et al. 1999) and (Freedman 1988, Saha et al. 1992) respectively. The resulting H–R diagrams are shown in Fig. 10.
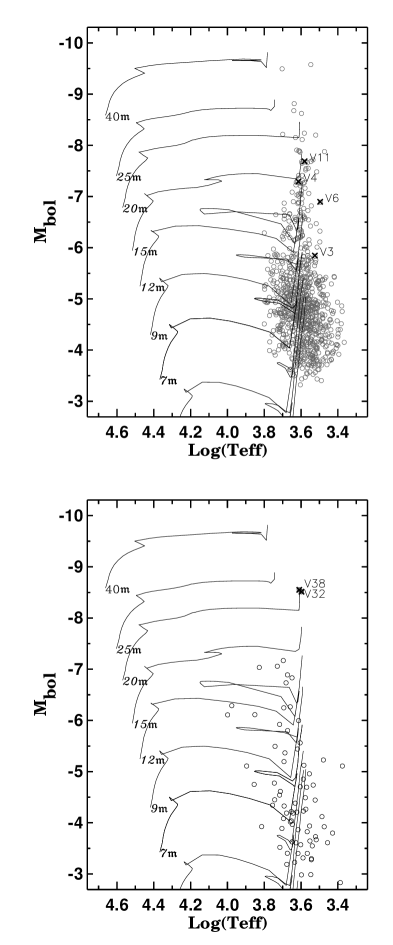
Analysis of H–R diagram of IC 1613 show that the two red irregular variables V32 and V38 (Sandage 1971) are the brightest representative of the red supergiants in this most active area of the galaxy. The derived effective temperatures of V32 and V38 are approx. 4000 K, which is in agreement with their M0Ia spectral class (Elias & Flogel 1985). Some early AGB or/and RSG can be identify at and 12 to 15 . The TRGB can be found around . Deeper photometry is necessary to investigate the red giant branch in details.
To analyze the variable stars in IC 10 we used the Saha et al. (1996) and Wilson et al. (1996) investigations of the light curves and periods for 13 variable stars. Four of them were found to be Cepheids. Unfortunately only four of these variables are measured in our photometry — V3, V4, V6 and V11. There are no Cepheid variables among them. V4 and V6 were found by Saha et al. (1996) to be eclipsing variables. Sakai et al (1999) reported V6 as a shortest-period Cepheid with days, but with very anomalous color. In our H–R diagram this star also have lower than normal Cepheid temperature. V3 is a very red variable star with whose status is unclear. V11 stands in the diagram of Saha et al. (1996) (see their Figure 7) among the red supergiants and has been classified by Saha et al. (1996) as a Cepheid-like variable with a very long period ( days). In Fig. 10 these stars are marked by crosses. As can be seen V11 has , and 15 .
Taking into account the analysis of IC 1613 and position of the variable stars on the H–R diagram of IC 10 we consider the stars with , and masses greater than 15 to be red supergiants. Some early AGB stars and/or RSG can be identify at evolutionary tracks with 12 . Intermediate age AGB stars stand between 7 to 9 . The TRGB can be found at . As in IC 1613 deeper photometry is necessary to investigate the red giant branch in details.
8 Survey of star forming regions in IC 10
The near infrared images can be used as continuum images which represent stellar light and hot dust emission from HII region complexes and dust extinction. On the red-green-blue composite true color image generated from J (blue), H (green) and K (red) images (Fig. 1) several structures with infrared excess can be identify. They can be divided in two regions named Zone 1 and Zone 2. The reddest object in Zone 1 is rather compact and has a mean diameter of 6 arcsec. Zone 1 also contains two fainter, extended and diffuse structures. Several stellar-like objects embedded into diffuse structures can be identify in Zone 2.
It is well known that the recombination line of hydrogen traces sources of Lyman continuum flux i.e. hot young stars, while arises from hot molecular gas and traces the material available for star formation. A red-green-blue composite true color image generated from the (blue), continuum (green) and (red) images is shown in Fig. 11. The emission structures in are clearly visible (almost pure red) on this composite image and they coincide with the clearly visible (red again) infrared excess structures on the true color image (Fig. 1).
A image with subtracted continuum was generated to outline better the star forming regions. The continuum level was determined by measuring the counts for several stars common to both the continuum and the line plus continuum images. The selected from the color-magnitude diagrams stars were main sequence foreground stars with photometric colors close to those of spectral class A0. The calculated ratios of counts were then averaged and the continuum image was scaled to the line plus continuum image so that the average ratio is unity. The continuum image was then subtracted from the line plus continuum image. Since the subtraction of continuum is a very important step we checked our results using the method of Golev et al. (1996). The resulting emission image obtained by this method is practically the same as previous one.
The emission structures are marked in Fig. 12. The lowest and the highest contours correspond to 3 and 10 respectively. The contour unit is 9.48 (1 level). Six ”knots” and ”spots” with diameters twice greater than FWHM can be located above the 3 sky value. Their measured positions in , , size in arcsec and fluxes per area per sec are given in Table 1. The emission sources are rather compact with sizes not larger than 20 arcsec. Br1, Br2 and Br3 have diffuse morphology while Br4, Br5 and Br6 are stellar-like objects. The distance between the nearest emission regions is much larger than the seeing during the observations (1-1.2 arcsec).

| Name | Size | Flux | ||
|---|---|---|---|---|
| (arcsec) | () | |||
| Br1 | 15.3 | 4.44 | ||
| Br2 | 15.3 | 2.41 | ||
| Br3 | 22.1 | 5.63 | ||
| Br4 | 8.5 | 1.24 | ||
| Br5 | 3.4 | 4.25 | ||
| Br6 | 4.2 | 3.25 |
Using the same procedure as in the reduction, continuum subtracted image was also obtained. There is no detected emissions down to 4.65 which corresponds to 3 level). According to Puxley et al. (1995) if the observed / ratios are smaller than 0.9 the dominant excitation mechanism of the hot molecular gas is from UV excitation by young stars, while if the ratio is larger than 0.9 there is mainly shock excitation.
There is an excellent spatial correlation between the (Hodge & Lee 1990) and the emission structures. All emission structures are cross-identified and in Table 2 their number and fluxes per area per sec as measured by Hodge & Lee (1990) (see their Table 2) are given. The fluxes are recalculated to the same size as . The comparison between and fluxes allow us to calculate the extinction for each of them using an intrinsic ratio / = 103.6 (Osterbrock 1989). Then using the reddening relation we calculate color excess. The results are given in Column 4 and 5 of Table 2. Taking into account errors in measured fluxes (both in and ) we estimated total error of . The mean extinction is
Since the emission is due to ionization from young stars, the flux is proportional to the star formation rate. Using equation 8 (Miller 1996) for normal disk and dwarf galaxies with Salpeter IMF the local star formation rates were calculated. Each of six emission structures is dereddened with their individual . The SFRs are given in Column 6 of Table 2. We can also determine the SFR from the luminosities. In this case we used the calibration equation 9 given in Calzetti (1997). To correct the fluxes for the extinction we assume . The calculated SFR (for star masses 0.1 - 100) are listen in Column 7 of Table 2. As can be seen we have very good agreement between SFRs obtained from and fluxes.
| Name | Hodge | Flux | ||||
|---|---|---|---|---|---|---|
| number | ||||||
| Br1 | E45 | 12.30 | 4.21 | 1.81 | 0.222 | 0.179 |
| Br2 | E50 | 7.94 | 3.98 | 1.72 | 0.116 | 0.095 |
| Br3 | E111c,d | 11.49 | 4.21 | 1.82 | 0.207 | 0.227 |
| Br4 | E111a | 1.74 | 4.37 | 1.88 | 0.036 | 0.051 |
| Br5 | E106a | 0.40 | 5.05 | 2.18 | 0.016 | 0.018 |
| Br6 | E106b | 1.78 | 3.36 | 1.45 | 0.015 | 0.012 |
The summarized SFR derived from six and emission structures in our field of view is and respectively. SFR for the whole galaxy given in Table 5 of Mateo (1998) is . Our field covers only the active area of IC 10 and hence the SFR of the whole galaxy must be higher, which confirms its starburst status.
9 Summary
The infrared photometry presented here together with the recombination line images provide useful information on the star-formation episodes of the Local group dwarf irregular galaxy IC 10.
The analysis of and color-magnitude diagrams clearly shows the presence of red supergiants, asymptotic giant branch stars and red giant branch stars. The red supergiants have masses between 15 and 30 and ages between 10 and 50 Myr. We would like to point out the presence of a significant amount of young (ages less than 1 Gyr) AGB star population.
Comparing the red supergiants of IC 10 and IC 1613 we have determined the reddening of and the dereddened distance modulus mag of Population I stars in IC 10.
The detection of six emission structures clearly outlines two star forming regions in our field of view. There is no emission down to 4.65 indicating that the dominant excitation mechanism of the molecular gas comes from UV radiation from hot young stars.
From the observed and fluxes, we derive the average extinction toward the star forming regions . This extinction refers to the ionized gas and is larger than the stellar reddening derived from the red supergiants. The sources are likely to be those with the highest surface brightness. As a consequence, they will tend to be compact H II regions, and compact H II regions are embedded in molecular clouds, usually deeply embedded. As a result, they are also highly reddened, which would explain why the nebular reddening is higher than stellar reddening.
The high SFR derived from six and emission structures in our field of view confirms starburst status of IC 10.
Acknowledgements.
L. G. and J. B. would like to thank Anabel Arieta and Alicia Porras for their help in the process of reducing the IR frames and also E. Chelebiev for his help. The authors gratefully acknowledge the useful comments and suggestions raised by Drs. F. Ferraro, M. R. Cioni, M. Richer, V. Golev, T. Bonev and V.D. Ivanov as well as the comments by an anonymous referee. This work was performed while J.B. was a visiting astronomer in UNAM, Mexico under contacts CONACYT No.400354-5-2398PE and DGAPA INI04696 and was supported in part by the Bulgarian National Science Foundation grant under contract No. F-812/1998 with the Bulgarian Ministry of Education and Sciences.References
- (1) Bessell, M., Brett, J. 1988, PASP, 100, 1134
- (2) Bertelli, G., Bressan, A., Fagotto, F., Choisi, C., Nasi, E., 1994, AAS, 106, 275
- (3) Bohlin, R., Colina, L., Finley, D., 1995, AJ, 110, 1316
- (4) Calzetti, D., 1997, AJ, 113, 1162
- (5) Casali, M. , Hawarden, T., 1992, JCMT-UKIRT Newsletter, No. 3, p. 33
- (6) Charbonnel, C., Maynet, G., Maeder, A., Schaller, G., Schaerer, D., 1993, AAS, 101, 415
- (7) Cohen, R. J., 1979, MNRAS, 187, 839
- (8) Costa, D., Frogel, G., 1996, AJ, 112, 2607
- (9) Cruz-Gonález, I.,Salas, L., & Ruiz, E., 1996 , Manual de Usuario 96-02,Instituto de Astronomía, UNAM
- (10) Elias, J., Frogel, J., Humphreys, R., Persson, S., 1981, ApJL, 249, 55
- (11) Elias, J., Frogel, J., 1985, AJ, 289, 141
- (12) Ferraro, F., Fusi Pecci, F., Testa, F., Greggio, L., Corsi, C. et al., 1995, MNRAS, 272, 391
- (13) Freedman,W.,1988, AJ, 96, 1248
- (14) Georgiev, L., Borissova, J., Rosado, M., Kurtev, R., et al., 1999, AAS, 134, 21
- (15) Golev, V., Jankulova, V.,Bonev, T., 1996, MNRAS, 280, 29
- (16) Hodge, P., Lee, M., 1990, PASP, 102, 26
- (17) Hodge, P., Zucker, D., 1999, Proceeding of IAU Symp.193, ”Wolf Rayet phenomena in massive stars and starburst galaxies”, ed. by Van Der Hucht, K., Koenigsberger, G. and Eenens, P., p.482
- (18) Hubble, E., ”The realm of the nebulae”, 1936, Yale University Press, New Haven.
- (19) Hunter,1997, PASP,109,937
- (20) Hunter,1999, Proceeding of IAU Symp.193, ”Wolf Rayet phenomena in massive stars and starburst galaxies”, ed. by Van Der Hucht, K., Koenigsberger, G. and Eenens, P., p.484
- (21) Landolt, A.,1992,AJ, 104, 1
- (22) Massey, P., Armandroff,T. ,1995, AJ, 109, 2470
- (23) Mateo, M., 1998, ARA&A, 36, 435
- (24) Miller, B., 1996, AJ,112, 991
- (25) Ruelas-Mayorga, A., 1997, RevMexxAA, 33, 9
- (26) Oke, J., 1990, AJ, 99, 1621
- (27) Osterbrock, D., 1989, Astrophysics of Gaseous Nebulae and Active Galactic Nuclei, University Scince Books, Milt Valley, USA.
- (28) Puxley P., Stone, J., Teuben, P., 1995, ApJ, 449, 508
- (29) Saha, A., Freedman, W., Hoessel, J., Mossman, A., 1992, AJ, 104, 1072
- (30) Saha, A., Hoessel, J., Krist, J., Danielson, E., 1996, AJ, 111, 197
- (31) Sandage, A., 1971, ApJ, 166, 13
- (32) Shostak, G.S., Skillman, E.D. ,1989, AA,214,33
- (33) Sakai, S., Madore, B., Freedman, W., 1999, ApJ, 511, 671
- (34) Stetson, P., 1993, User’s Manual for DAOPHOT II.
- (35) Stetson, P. 1991, in The Formation and Evolution of Star Clusters, ASP Conf. Ser. Vol. 13, edited by K. A. Janes (ASP, San Francisco), p. 88
- (36) Tikhonov, N., Proceeding of IAU Symp.193 ”Stellar content of Local group galaxies, ed. by P.Whitelok and R. Cannon, p. 244.
- (37) Wilson, C., Welch, D., Reid, I., Saha, A., Hoessel, J., 1996, 111, 3
- (38) Wilcots, E., Miller, B., 1998, AJ, AJ, 116, 2363