Stellar populations in the Phoenix dwarf galaxy. ††thanks: Based on data collected at the European Southern Observatory, La Silla, Chile, Proposal N.57.A-0788
Abstract
We have obtained deep CCD photometry in the , , and bands of Phoenix, a galaxy considered a transition case between dwarf spheroidal (dSph) and dwarf irregular (dI) galaxies. A comparison of our data with the giant branches of Galactic globular clusters gives a mean metal abundance [Fe/H] dex. The presence of an intrinsic color dispersion in the upper red giant branch (RGB) suggests an abundance range of about 0.5 dex, although a range in age may also affect the RGB width. The color-magnitude diagram (cmd) of Phoenix reveals for the first time a horizontal branch (HB) predominantly red yet moderately extended to the blue, similar to those of Leo II or And I, at . The detection of a relatively blue HB indicates the presence of a significant population with age comparable to that of old halo Galactic globular clusters. As in other dwarf spheroidals, this HB morphology in a metal-poor system indicates a mild “second parameter” effect. The mean level of the HB has been used to derive a true distance modulus , in good agreement with the distance modulus estimated from the well defined cutoff of the red giant branch at . This confirms the correct identification of the RGB tip. We also find a radial gradient in the Phoenix HB morphology, as measured by an increasing ratio of blue HB stars to red giant stars in the outskirts of the galaxy. The color-magnitude diagrams show a small number of stars above the tip of the RGB, well in excess over field contamination, that most likely are asymptotic giant branch (AGB) stars belonging to an intermediate age population. Their number indicates that the fraction of intermediate age (3 to 10 Gyr) population in Phoenix is approximately 30–40%. A young stellar population is definitely present in Phoenix, consistent with a star formation episode started at least 0.6 Gyr ago, up to yr ago. Both young stars and AGB stars are centrally concentrated, which indicates that recent star formation preferentially occurred in the inner galaxy regions. In many respects, including an extended star formation history and even the presence of a modest amount of neutral hydrogen, Phoenix appears not dissimilar from dwarf spheroidal galaxies in the Local Group.
Key Words.:
Galaxies: fundamental parameters – Galaxies: individual: Phoenix – Local Group – Galaxies: stellar content1 Introduction
Photometric studies of dwarf spheroidals, and in particular of their color-magnitude diagrams, have shown a variety of star formation histories, ranging from the globular cluster-like diagrams of Draco or Tucana (Grillmair et al. gril+97 (1997); Saviane et al. savi+96 (1996), hereafter Paper I) to the considerable intermediate age populations of Carina (Smecker-Hane et al. smec+94 (1994)) and Fornax (Beauchamp et al. beau+95 (1995); Stetson et al. stet+98 (1998); Saviane & Held savi+held98 (1999)), with a range of intermediate cases for which we refer the reader to the recent reviews of Da Costa (daco98 (1998)) and Mateo (mate98 (1998)).
The dwarf galaxy Phoenix represented a particularly interesting case in this respect since it is currently forming stars on top of a seemingly old, metal-poor population. Ortolani & Gratton (orto+grat88 (1988), hereafter OG88) obtained CCD photometry in a field centered on the blue star association first described by Canterna & Flower (cant+flow77 (1977)). Their color-magnitude diagrams show bright blue stars likely belonging to a yr-old recent burst of star formation, involving , superposed onto a predominantly old ( yr) metal-poor stellar population. A comparison with metal-poor Galactic globular clusters led OG88 to estimate a distance modulus , thus locating Phoenix well within the Local Group. OG88 also found a color distribution on the RGB somewhat broader than accounted for by instrumental errors, the intrinsic color dispersion corresponding to an abundance range of about 0.6 dex. A further study of the resolved stellar populations of Phoenix by van de Rydt et al. (vdry+91 (1991), hereafter VDK91), yielded a slightly shorter distance modulus of and a metal abundance [Fe/H]. The integrated luminosity, , is similar to that of Carina. These photometric studies together with limited spectroscopic data of Da Costa (daco94 (1994)), also indicated the presence of low-luminosity carbon stars consistent with an intermediate age population older than 8–10 Gyr.
Both studies concluded that Phoenix may belong to an intermediate class between dI’s and dSph’s, a view supported by the detection of neutral hydrogen towards the optical galaxy at a heliocentric radial velocity of 56 km s-1 (Carignan et al. cari+91 (1991)). More recently, Young & Lo (youn+lo97 (1997)) obtained VLA maps of Hi in a region around Phoenix at a resolution . Their maps show an Hi cloud (“cloud B”) at about from the optical center, at a heliocentric velocity of km s-1, which is identified with the emission detected by Carignan et al. (cari+91 (1991)). Its velocity dispersion is low, only km s-1. In addition, that study revealed a new Hi feature peaked at km s-1, about southwest of the optical galaxy (“cloud A”), whose curved shape suggests a physical link with the galaxy (see the Hi contour maps in their Fig. 17). However, it is conceivable that both clouds are associated with the complex Hi velocity structure of the Magellanic Stream.
The presence of young stars along with neutral gas in an essentially old galaxy may provide the clue to understanding the role of multiple bursts of star formation in the evolution of dwarf spheroidals (and possibly of their more massive counterpart, the dwarf ellipticals). For this reason, we have undertaken a study of the old, young, and intermediate age populations of Phoenix. A first task was establishing whether Phoenix harbors a significant populations of metal-poor stars of age comparable to Galactic globular clusters, in which case a blue HB is expected. Indeed, we have been able to detect for the first time a moderately blue HB at . A further aim was a quantitative estimate of the contribution of young and intermediate age stars to the stellar populations of Phoenix, in particular to understand if the recent burst of star formation represents an isolated episode after a long quiescent period.
The plan of the paper is as follows. Section 2 presents our new observations in , , and of the Phoenix dwarf over a field. Careful analysis of the instrumental errors and foreground/background contamination, essential to estimate the contribution of the young and intermediate age stellar populations, is also presented. In Sect. 3 we describe the main features of the color-magnitude diagrams, and outline the spatial distribution of stars of different ages. In particular, we introduce our first detection of the horizontal branch of Phoenix. The basic properties of the galaxy are derived in Sect. 4. There we provide a new distance estimate based both on the magnitude of the luminosity of the RGB tip, and on the mean magnitude of horizontal branch stars. The wide photometric baseline employed in this study allows us to re-address the problem of an intrinsic color range and abundance dispersion of the red giants. The stellar populations of the Phoenix dwarf are discussed in Sect. 5, where in particular we estimate the contribution of young and intermediate age stars to the galaxy luminosity, and map the distribution of the star-forming regions across the galaxy. The main results of this paper are summarized in Sect. 6 along with concluding remarks.
2 Observations and data reduction
Observations of a single field centered on Phoenix were obtained on September 7 and 8, 1996 using EFOSC2 at the ESO/MPI 2.2m telescope. The detector was a thinned Loral CCD with pixels of 026. The images were trimmed to pixels during readout to avoid the vignetted edges of the image. Fast readout, appropriate for broad band imaging, yielded a read-out noise of 7.8 e-/pixel and a conversion factor of 1.34 e-/ADU. A control field located at a few degrees from the galaxy was also observed to estimate the foreground and galaxy background contamination. Sky conditions were photometric on the second night of the run. The seeing was quite variable, so that only the best pairs of images in each filter were selected for processing. Table 1 lists the images used in this study, including the comparison field exposures. Images with poorer seeing (not listed here) were used for calibration purposes, namely to evaluate the zero point stability.
| ID | Night | Filter | [s] | airmass | FWHM |
|---|---|---|---|---|---|
| Ph/b5 | 2 | B | 2400 | 1.04 | 1.4 |
| Ph/b6 | 2 | B | 2400 | 1.04 | 1.3 |
| Ph/i2 | 2 | I | 2400 | 1.06 | 1.2 |
| Ph/i3 | 2 | I | 1800 | 1.10 | 1.3 |
| Ph/v1 | 1 | V | 1500 | 1.29 | 1.5 |
| Ph/v2 | 1 | V | 1500 | 1.21 | 1.4 |
| bck/b1 | 1 | B | 2400 | 1.04 | 1.3 |
| bck/b2 | 1 | B | 2400 | 1.06 | 1.3 |
| bck/i1 | 1 | I | 2400 | 1.07 | 1.3 |
| bck/i2 | 1 | I | 2400 | 1.04 | 1.3 |
| bck/v1 | 1 | V | 1500 | 1.15 | 1.7 |
| bck/v2 | 1 | V | 1500 | 1.11 | 1.7 |
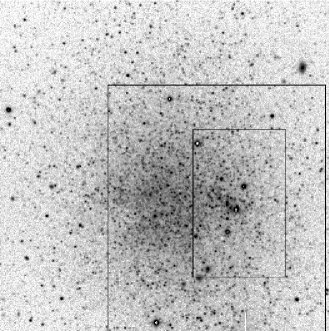
Image pre-processing was carried out with the eso midas package in the standard way. First, all images were cleaned using a map of the bad features of the CCD. After checking the bias stability, a master bias was subtracted from all images. Several daylight dome flats and twilight flat-fields were obtained in each filter and used to construct dome and sky master flat-fields. The sky flats were preferred for correcting the scientific frames, because of the higher signal-to-noise ratio and better color match, though the dome flats were almost as good. The images were then registered to a common reference frame and coadded. The size of the Point Spread Function (PSF) of the averaged images shows no degradation with respect to the individual frames. As an example, our sum image is shown in Fig. 1.
Stellar photometry was performed using daophot ii and allstar (Stetson stet87 (1987)). The PSF was iteratively constructed from a starting list of about 100 (relatively bright) reference stars, uniformly distributed across the CCD. After fitting a preliminary PSF to the sum images, all reference stars with faint neighbors were culled out of the catalog by careful visual inspection of the star-subtracted images. A better point spread function was then obtained from the selected list of PSF stars. Different PSF shapes were tested by checking the residuals after subtraction. The best fitting was obtained using a Moffat function with and quadratic radial dependence. The subtraction residuals were generally satisfactory due to the good sampling of stellar images. Photometry was then obtained by running daophot and allstar twice on the sum images.
| bin | |||
|---|---|---|---|
| 16.25 | 0.004 | ||
| 16.75 | 0.014 | ||
| 17.25 | 0.012 | ||
| 17.75 | 0.013 | ||
| 18.25 | 0.015 | ||
| 18.75 | 0.015 | ||
| 19.25 | 0.007 | 0.025 | 0.021 |
| 19.75 | 0.009 | 0.006 | 0.023 |
| 20.25 | 0.014 | 0.010 | 0.031 |
| 20.75 | 0.019 | 0.013 | 0.043 |
| 21.25 | 0.024 | 0.021 | 0.061 |
| 21.75 | 0.032 | 0.028 | 0.087 |
| 22.25 | 0.041 | 0.031 | 0.116 |
| 22.75 | 0.059 | 0.041 | 0.124 |
| 23.25 | 0.079 | 0.056 | 0.145 |
| 23.75 | 0.163 | 0.078 | 0.101 |
| 24.25 | 0.105 | 0.087 | |
| 24.75 | 0.111 | 0.148 |
The photometric errors and the degree of completeness of our data were estimated by extensive artificial star experiments. We used a technique in which artificial stars added to each image are randomly scattered about the vertices of a fixed grid or “lattice”. This prevents overlapping of simulated stars (“self-crowding”). Lists of input stars (typically ) were created for the image, with randomly distributed coordinates and magnitudes uniformly distributed within the limits of the Phoenix cmd. Random () and () colors were employed, so that the artificial star colors spanned the entire useful intervals in the Phoenix color-magnitude diagrams. We made 30 experiments per filter, corresponding to stars in each bandpass. The frames containing the simulated stars were reduced exactly in the same way as the real images. The master catalog of star experiments contains the artificial stars retrieved in at least one filter, ready for calibration as the real photometry catalogs.
Table 2 lists the photometric errors obtained in each bandpass separately. The first column gives the center of the magnitude bin in , , and . The photometric errors were obtained by grouping the stars in magnitude bins and calculating the differences between the retrieved and input magnitudes. The standard deviations are those of a Gaussian fitted to the observed distribution of . The are typically 50% larger than the daophot errors. The completeness was calculated in a two-dimensional way by dividing each color-magnitude diagram in cells with size 0.2 mag in magnitude and 0.5 mag in color. Contours of equal completeness, smoothed over cells, are superimposed to the color-magnitude diagrams.
Observations of standard stars from Landolt (land92 (1992)) were used to calibrate the photometry. A value of s was assumed for the shutter delay time, which implies a correction of 0.003 mag for the standard stars. The raw magnitudes were normalized to 1 s exposure time and zero airmass:
| (1) |
where are the instrumental magnitudes measured in circular apertures of radius (close to the photoelectric aperture employed by Landolt land92 (1992)), is the shutter delay, and is the airmass. The adopted mean extinction coefficients for La Silla are , , and . A fit of the normalized instrumental magnitudes to the magnitudes of the standard stars in the Landolt’s (land92 (1992)) fields gives the following relations:
| (2) | |||||
| (3) | |||||
| (4) | |||||
| (5) |
where the coefficients were derived from the standard stars observed on the second night. The r.m.s. scatter of the residuals of the fit (0.007, 0.008, and 0.008 mag in , , and respectively) was assumed to represent our calibration uncertainties.
Before applying these calibrating relations to our photometry, the instrumental profile-fitting magnitudes (measured on the sum frames) were converted to the scale of the standard star measurements. To this purpose, a sample of bright isolated objects were selected in all individual images, all neighboring faint stars subtracted, and the cleaned frames were used to measure magnitudes through circular digital apertures with radii (the same as for standard stars). Aperture corrections were then calculated for each image as the median of 5 to 8 independent corrections in each filter. The r.m.s. scatter about the median zero point is 0.015 in , 0.011 in , and 0.012 in . This uncertainty includes not only the errors on aperture measurements and corrections, but also the effects of extinction variations during the nights. Following aperture correction, calibrated magnitudes were obtained by applying the calibrating relations in the form of a linear system solved by the Kramer method (a procedure equivalent to the more usual iterative method). The total zero-point uncertainties, obtained by quadratic sum of the aperture correction and calibration errors, are 0.017, 0.014, and 0.014 mag in , , and respectively.

Figure 2 shows a comparison of our photometry with the results of van de Rydt et al. (vdry+91 (1991)) for stars brighter than . We obtain the following median magnitude and color differences (this study VDK91): , , , and . The errors are standard deviations of the differences, following a rejection of the outliers. Van de Rydt et al. (vdry+91 (1991)) report the result of their comparison with the data of Ortolani & Gratton (orto+grat88 (1988)). They found mean differences, in the sense VDK91 OG88, of and . Thus our () colors are somewhat redder than those of VDK91 and consistent with the results of OG88. Our slightly brighter magnitude scale is explained by the larger reference aperture (indeed, using the OG88 aperture we would have obtained a zero point dimmer by mag).
3 The color-magnitude diagrams


Figure 3 shows the , color-magnitude diagram of Phoenix. The most notable feature is our detection of the horizontal branch (HB) of Phoenix at , discernible up to . An extended blue tail, similar to that of metal-poor Galactic globular clusters, is not evident. The HB is found at a magnitude level where our cmd is significantly incomplete and photometric errors are quite severe, so deeper data are certainly important. The morphology of the HB will be analyzed in more detail in Sect. 5. Figure 3 also displays a red giant branch (RGB) sharply cut at , and a blue sequence extending to luminosities brighter than the tip of the RGB, representing the young star population detected by OG88 and VDK91. This blue star sequence, partially overlapping the HB region, is also noticeable in other c-m diagrams. Figure 4 shows the color-magnitude diagram of Phoenix using the wider color baseline. The trend of the isocompleteness contours in Fig. 4 illustrates the relatively high incompleteness of -band photometry in the case of blue stars. The cmd of Phoenix is compared with the similar cmd of the control field in the right panel of Fig. 4. A comparison of the two diagrams shows that the foreground and background counts do not represent a major source of contamination for the most interesting regions of the cmd. There are no foreground or background objects bluer than , so that we are confident that all stars bluer than this limit belong to a young stellar population in the dwarf galaxy. We have therefore defined a young star sample by selecting all stars in the cmd region having and .

The spatial distribution of the blue star sample is plotted in Fig. 5, along with the distribution of stars in the red giant sample (defined below). The galaxy center, marked by a large cross, was defined using the mode of the marginal distributions of star coordinates. The star formation sites in Phoenix are clearly delineated in this figure. The young stars are found in clumps in the central region of the galaxy, the most prominent clump being the well-known “association” described by Canterna & Flower (cant+flow77 (1977)) and studied by OG88. The spatial distribution of the different stellar populations in Phoenix will be further discussed in Sect. 5. This information is used here to define a “red giant sample” by excluding all objects in the two most prominent star forming regions (approximated by the two rectangles in Fig. 5).
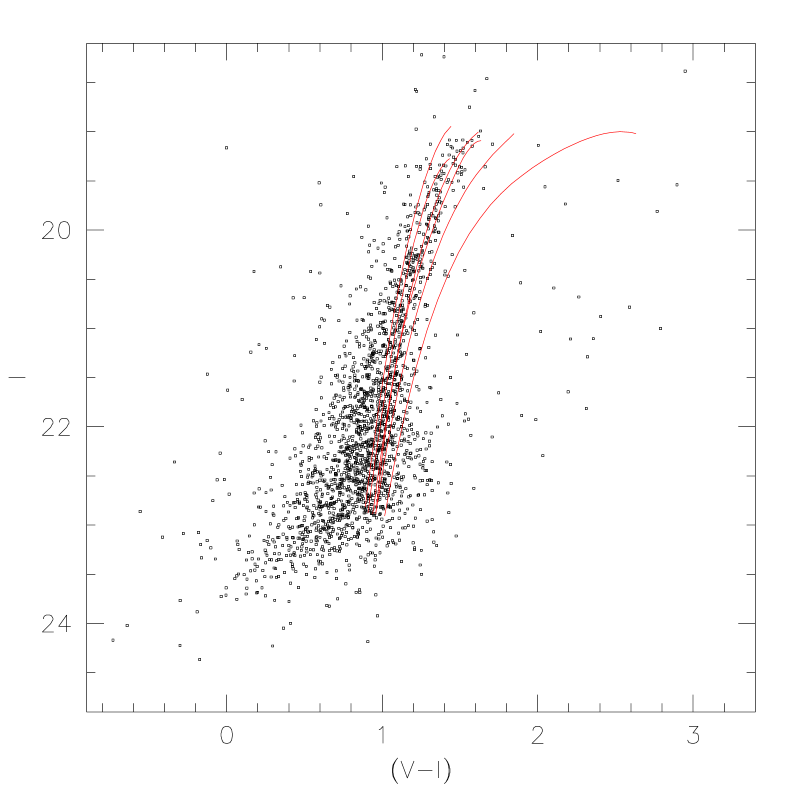
Figure 6 presents the , color-magnitude diagram of the stars in the RGB sample, together with the fiducial red giant branches of Galactic globular clusters from Da Costa & Armandroff (daco+arma90 (1990)). From blue to red, the globular clusters are M15, NGC 6397, M2, NGC 6752, NGC 1851, and 47 Tuc, whose metallicities are –2.17, –1.91, –1.58, –1.54, –1.29, and –0.71 dex, respectively. We note the extremely well defined RGB cutoff of Phoenix, suggesting the lack of a dominant intermediate age population.

An expanded view of the horizontal branch of Phoenix is provided in Fig. 7. This diagram was obtained by picking only stars in the outer region of the galaxy (), thus excluding all objects in the star formation regions. This selection proved to enhance the contrast between the HB and the RGB, partly because photometric error are smaller in the outer, less crowded regions, but possibly also because of an intrinsic difference in the radial distributions of the RGB and HB populations (we will return to this point in Sect. 5). Figure 7 clearly confirms the presence of a moderately blue horizontal branch in Phoenix at . We note that the HB is hardly detected in the , diagram because most of the faint, blue HB stars fall below the detection threshold in the band. The fiducial loci of the Galactic globular cluster M3 (which appears obviously more metal-rich than Phoenix: [Fe/H]) are shown for comparison purposes, appropriately shifted to the Phoenix distance as derived from the RGB cutoff (see Sect. 4.1). The data for M3 are from Buonanno et al. (buon+88 (1988)), and the apparent distance modulus and reddening from Harris (whar98 (1997)).
4 Distance and metallicity
The sample of red giant branch stars used to construct the Phoenix RGB luminosity function (LF) is a subset of the master red sample defined in the previous section. To reduce the contamination by young stars and field objects, we further selected a “2 RGB sample” which comprises all stars within from the fiducial ridge line. The details of the method are given in Sect. 4.4. The stars in the red giant sample are used below to derive the fundamental parameters of Phoenix, distance and metal abundance.
4.1 Luminosity function and distance based on the RGB tip
The distance to Phoenix was first estimated from the absolute magnitude of the tip of the red giant branch (see Madore & Freedman mado+free95 (1995) for a discussion of the method and previous work). The cutoff was found at . The error mainly reflects the uncertainty in locating the RGB tip, which is larger than the systematic error on our magnitude scale. To assess the effects of crowding on the estimated RGB cutoff, we simulated the upper part of the RGB using artificial stars in the cmd region , . After processing the artificial data as the real RGB stars, the cutoff magnitude of the retrieved stars was 0.03 mag too bright, independently of the radial distance from the galaxy center. A correction for this small bias was included in our estimation of the distance modulus.
The bolometric and luminosities of the RGB tip, and , and the bolometric correction, were then estimated using the relations of Da Costa & Armandroff (daco+arma90 (1990)). From the extinction-corrected color of red giants near the tip, , we obtain . The bolometric absolute magnitude of the tip was then inferred from our estimate of the mean metal abundance of Phoenix, (cf. Sect. 4.3). The result was (the error reflects the uncertainty on metal abundance), from which was finally obtained. For the extinction and reddening corrections we used and , adopting mag from Burstein & Heiles (burs+heil82 (1982)), with a mag reddening uncertainty. The distance modulus to Phoenix determined from the extinction-corrected magnitude of the RGB tip is then , where the error includes the photometric and reddening uncertainties, and the uncertainty on . This distance modulus is slightly shorter than that derived by VDK91 using the same method and reddening.
4.2 Distance based on horizontal branch stars

Our first detection of the HB of Phoenix allows to obtain an independent estimate of the distance to Phoenix. The mean magnitude of the horizontal branch was calculated as the median magnitude of the 553 HB stars in the cmd region , . The median is , with a r.m.s. scatter 0.17 mag, yielding a formal error on the mean of mag. The mean value was found to remain constant for different radial sub-samples, within the internal errors. The total uncertainty, including the systematic error of the magnitude scale, is mag.
Given the significant incompleteness of our photometry at the HB level, the effects of errors and incompleteness on the measured location of the HB need careful investigation. The results of our artificial star experiments were used to simulate the HB as a narrow strip in the cmd (, ). The distribution of the retrieved artificial stars in the color-magnitude diagram (Fig. 8) was then analyzed exactly in the same way as the real HB data. The median HB level of the retrieved stars was , i.e. the simulated HB appears slightly biased toward brighter magnitudes due to the rapidly changing photometric completeness, though the effect is relatively modest. Taking into account this bias, we adopt as the mean observed magnitude of the blue HB.
Using this value for , we calculated the distance modulus of Phoenix on the Lee et al. (ywlee+90 (1990)) distance scale, using their relation for the absolute visual magnitude of RR Lyrae variables,
| (6) |
for a helium abundance of . We adopt this calibration since it is also the basis of the RGB tip method (Da Costa & Armandroff daco+arma90 (1990); Lee et al. mglee+93 (1993)). On the Lee’s et al. scale, which gives mag for a metallicity [Fe/H] (cf. Sect. 4.3), we estimate a distance modulus . Note that the distance error includes the photometric (statistical and zero-point) errors and the reddening uncertainty, but does not take into account the uncertainty of the adopted HB calibration and distance scale. For example, using the empirical calibration of the mean absolute magnitude of the HB in 8 M31 globular clusters by Fusi-Pecci et al. (fusi+96 (1996)), the distance modulus would be , i.e. brighter by about 0.2 mag.
The distance based on the HB is only marginally larger than that determined from the tip of the RGB, and the agreement is good in view of the many sources of uncertainty. The average of the two determinations, , corresponding to kpc, is finally adopted as our best estimate of the distance to Phoenix.
4.3 Mean abundance

As in Paper I, the mean metal abundance of Phoenix was estimated by direct comparison of the red giant branch in the , color-magnitude diagram with the RGB ridge lines of the template globular clusters from Da Costa & Armandroff (daco+arma90 (1990)). We calculated the mean color differences between the data in the Phoenix red giant sample and the fiducial loci of the template clusters, using different choices for the luminosity range. The values of were corrected for extinction adopting . We note that for magnitudes fainter than , the color distribution of the Phoenix RGB is skewed towards bluer colors, due to the presence of the unresolved AGB of the old population (a similar trend was noticed in the cmd of And I by Da Costa et al. daco+96 (1996)). In Galactic globular clusters, AGB stars can be separated from red giant branch stars below an absolute magnitude . In Phoenix this precisely corresponds to or .
Figure 9 shows the mean color residuals (calculated in the range ) against the metallicities of the Galactic clusters. A linear fit to the differences, excluding only the metal- rich cluster 47 /Tuc, gives the relation
| (7) |
applicable in the range . This relation implies that the interpolated metal abundance of Phoenix is [Fe/H] dex. The abundance () error is derived from the total uncertainty on the mean color using Eq. 7. The uncertainty on includes the statistical error ( mag), the systematic error due to calibration uncertainties (0.02 mag), and the reddening uncertainty. We do not include the uncertainties related to systematic differences between abundance scales for the Galactic globular clusters. Note that for metal-poor populations, however, there is reasonable agreement between different abundance scales (e.g., Carretta & Gratton carr+grat97 (1997)).
The mean abundance derived here is slightly higher than the value measured by van de Rydt et al. (vdry+91 (1991)). The difference is probably to be ascribed to the small shift in the calibrated colors (cf. Sect. 2). Using a wider magnitude range for calculation of the values, a slightly lower metal abundance would have been derived (e.g., [Fe/H] using the upper 2 mag of the RGB). This reflects the bias in the giant branch color due to the presence of AGB stars. The difference is comprised in the quoted uncertainties, though.
4.4 Metallicity dispersion
| RGB | simul. | intrinsic | ||
|---|---|---|---|---|
| 19.25 | 1.43 | 0.090 | 0.044 | 0.079 |
| 19.75 | 1.33 | 0.079 | 0.049 | 0.093 |
| 20.25 | 1.22 | 0.079 | 0.052 | 0.059 |
| 20.75 | 1.11 | 0.100 | 0.052 | 0.085 |
| 21.25 | 1.03 | 0.150 | 0.072 | 0.137 |
| 21.75 | 0.95 | 0.153 | 0.087 | 0.126 |
| 22.25 | 0.90 | 0.183 | 0.127 | 0.132 |
| 22.75 | 0.80 | 0.217 | 0.163 | 0.143 |

Previous work has suggested the presence of an intrinsic color width in the red giant branch of Phoenix. We find confirmation of this claim in our data. Table 3 gives our results for the mean color and measured RGB width at different luminosities (columns 2 and 3). The mode and standard deviation of the color distribution of red giants were measured in 0.5 -mag bins on a rectified version of the RGB, using a Gaussian fit with a clipping to discard field objects and young stars. The instrumental scatter derived from artificial star experiments is given in column 4. The color dispersion of simulated stars, distributed along the RGB fiducial locus, was measured with the same robust approach used to derive the RGB widths. The observed color dispersions and instrumental errors are compared in Fig. 10. Clearly, the RGB color scatter is significantly larger at any luminosity than expected from measurement errors alone. The intrinsic dispersions calculated as the quadratic difference between the measured and instrumental scatter are given in col.5 of Tab. 3. The average color dispersion in the 4 brightest magnitude bins () is (r.m.s. error on the mean). It is interesting to note that the values are roughly constant above . Below this magnitude, the presence of AGB stars evolving away from the horizontal branch precludes reliable analysis.
This evidence for an intrinsic scatter has been independently confirmed by a direct comparison of our photometry with the data of van de Rydt et al. (vdry+91 (1991)). In the range , the color differences for the stars in common yield a standard deviation of 0.072 mag. Under the simple assumption that the two samples have comparable errors, we obtain an instrumental scatter of 0.051 mag, which implies 0.074 mag for the intrinsic scatter, in good agreement with that obtained from crowding simulations. We thus conclude that an intrinsic color scatter is indeed present in Phoenix, of the order mag. If we are to explain this scatter as due to an abundance spread, it would correspond to a metallicity dispersion dex (using Eq. 7). Our data thus seem to indicate that the RGB stars in Phoenix span a () range in metal abundance dex, i.e. a range of dex. This confirms the relatively modest abundance range found by OG88, while VDK91 give a somewhat larger metallicity spread.
An abundance scatter similar to that found in the Phoenix dwarf is well established in many dwarf spheroidals, where it has been confirmed also by spectroscopic observations (Suntzeff et al. sunt+93 (1993); Da Costa daco98 (1998)). In dSph’s, a range in metal abundance is indicative of an enrichment process in which multiple stellar generations have taken place from interstellar gas enriched by previous episodes. However, a range in age may also affect the RGB color dispersion. As an example, we have calculated the mean color difference between two isochrones with ages of 15 and 5 Gyr respectively, using the models of Bertelli et al. (bert+94 (1994)). The shift was calculated in the luminosity range , i.e. the interval used for calculating , for two different metallicities, ([Fe/H]) and ([Fe/H]). We find a mean shift for the metal-poor isochrones and for the metal-rich ones (younger stars are bluer). The effect of an age mix on the colors of the red giants is therefore not negligible, particularly in the case of metal-poor isochrones, for which the color difference near the RGB tip mimics a metallicity variation of dex. Thus, depending on the details of the star formation and enrichment history of each galaxy, the effects of a younger age and a higher metallicity may partly cancel out, in which case the abundance spread inferred from the color dispersion would underestimate the metallicity range. An extreme example of such a combined effect may be at work in the Carina dwarf, which has a very narrow RGB indicative of little chemical enrichment (of the order 0.2 dex) although it has had several generations of stars (Smecker-Hane et al. smec+94 (1994); Hurley-Keller et al. hurl+98 (1998)). Understanding the observed color-magnitude diagrams of a complex stellar system requires realistic modeling of both its star formation and chemical enrichment histories (best performed on high-resolution data), and independent information on metal abundances such as that provided by spectroscopy of individual stars.
5 The stellar content of Phoenix
5.1 The old population: horizontal branch morphology
We begin our analysis and discussion of the star content of Phoenix with a few comments on our HB detection. The moderately blue horizontal branch unquestionably implies that Phoenix harbors a sizable old stellar population. Due to the relatively large photometric errors, stars on the red HB cannot be disentangled from the RGB, yet we can obtain some information about the HB morphology looking at Fig. 7. The horizontal branch of Phoenix appears mostly populated on the red side and moderately extended to the blue (), with a hint of the RR Lyrae gap at . Thus it appears remarkably similar to the HB types of the dwarf spheroidals Leo II (Demers & Irwin deme+irwi93 (1993); Mighell & Rich migh+rich96 (1996)), And I (Da Costa et al. daco+96 (1996)), Draco (Grillmair et al. gril+97 (1997)), and Tucana (Seitzer et al. seit+98 (1998); see also Da Costa daco98 (1998)). Given the mean metallicity of Phoenix, this HB morphology implies a mild second parameter effect, since old halo clusters with [Fe/H] have blue horizontal branches. Under the hypothesis that the HB morphology of Phoenix is mainly driven by age, the theoretical HB models of Lee et al. (ywlee+94 (1994)), and in particular their HB-type versus metallicity diagram, would indicate for its old population an age Gyr younger than that of the old halo clusters. However, it appears most likely that the HB of Phoenix is due to a mixture of stars of different ages.
Recent studies have shown that the blue HB population in some dSph s (e.g., And I and Fornax) is less centrally concentrated than the red HB stars and the red giants, most likely due to a gradient in the mean age of the galaxy populations (e.g., Da Costa et al. daco+96 (1996); Stetson et al. stet+98 (1998)). To investigate the presence of a radial population gradient in Phoenix, we have compared the radial distribution of the blue horizontal branch stars (, ) to that of red giants just above the HB (, ). The surface density profile of the HB stars appears to be substantially more extended than that of red giants. A two-sided Kolmogorov-Smirnov test clearly indicates that the two spatial distributions differ at a 99% confidence level. Since there might be some concern that apparent gradients be induced by different crowding and completeness in the two magnitude and color ranges, we applied the same test to the radial distributions of simulated stars in the same cmd regions. The cumulative radial density profiles of the blue-HB and RGB artificial stars look very similar. Formally, the null hypothesis (the two data sets are drawn from the same parent population) cannot be rejected at any significant confidence level. We therefore conclude that the detected gradient cannot be produced by instrumental effects.
This extended distribution of the blue-HB sample (i.e. of the oldest stars) can have different implications. A radial change in the horizontal branch morphology could be due either to a radial change in the mean age of the stellar populations, or to a higher mean abundance in the central regions, or both. Clearly, it is not easy to decide between these alternatives on the basis of our data (the radial dependence of the HB morphology will be better investigated using HST photometry). We just note that the observed central concentration of young and intermediate age stars (see Sect. 5.3) indicates that multiple star formation episodes occurred preferentially in the central regions.
5.2 The intermediate age population: AGB stars

Previous studies of Phoenix have found a few very red stars located above the red giant branch tip. These may be AGB stars belonging to an intermediate age component. Da Costa (daco94 (1994)) obtained spectroscopic confirmation of two carbon stars with in Phoenix. These two confirmed C stars are less luminous than the brightest carbon stars in the Gyr old SMC cluster Kron 3, and considerably fainter than those in the populous young (1–3 Gyr old) clusters in the LMC. This would indicate that Phoenix did not form many stars since 8–10 Gyr ago (Da Costa daco98 (1998)). This suggestion, however, is based on a very limited sample of C stars, and brighter intermediate age stars may be identified with a complete census of possible upper-AGB stars in this galaxy.
The relatively large field investigated in this paper gives us the possibility to better assess the contribution of an intermediate age population in Phoenix, and to obtain some constraints on the star formation history of this dwarf galaxy. To this purpose, we selected stars brighter and redder than the RGB tip (, ) as candidate upper-AGB stars younger of Gyr (Fig. 11). The lower magnitude limit, , was chosen slightly fainter of the RGB tip to account for possible large magnitude errors due to blending. All selected stars were visually inspected, and those with elongated shapes or other hints of nearby companions were flagged as less reliable, although further study (in particular spectroscopy) will be needed to confirm the nature of any candidate. Figure 11 also shows the foreground and background objects found in the same color and magnitude range (crosses). The brightest stars are obviously in excess over field objects.
Taking into account field contamination and incompleteness, we counted 11 AGB stars in the cmd region just above the RGB tip (), in the color range . This interval is equivalent to a range in bolometric luminosity between (the RGB tip, where AGB evolution terminates in metal-poor globular clusters) and , this brighter end roughly corresponding to the maximum AGB luminosity reached by 3 Gyr old stars (Frogel et al. frog+90 (1990); Marigo et al. mari+96 (1996)). For comparison, 156 RGBAGB stars are counted within 1 mag below the RGB tip ().
The occurrence of upper-AGB stars in dSph’s generally indicates the presence of a population significantly younger than that of galactic globular clusters, and this seems to be the case also for Phoenix. Alternative explanations for the stars brighter than the RGB tip seem unlikely. For instance, large amplitude long-period variable stars (LPV’s) have not been found in old halo globular clusters as metal-poor as Phoenix (Frogel & Elias frog+elia88 (1988); Frogel & Whitelock frog+whit98 (1988)). Even accounting for the modest abundance dispersion inferred in Sect. 4.4, there is no evidence for a significant component in Phoenix with metallicity higher than [Fe/H]. We have also considered the possibility that some of our AGB candidates are artifacts of blending of red giants near the tip (Renzini renz98 (1998)). Assuming that the luminosity of Phoenix (, van de Rydt et al. vdry+91 (1991)) is uniformly distributed over a area, and adopting a resolution element 1.7 , we expect less than one resolution element (0.4) in our frame to contain two red giants near the RGB tip. Further, in our simulations we find just 1 star scattered above the RGB tip by photometric errors.
Thus we conclude that most of the stars brighter than trace the extended AGB of an intermediate age population. Our counts of upper-AGB stars are used to estimate the contribution of the intermediate age component to the luminosity of Phoenix, following the methods of Renzini & Buzzoni (renz+buzz86 (1986)) and Renzini (renz98 (1998)). The “fuel consumption theorem” gives the number of stars in a post-MS evolutionary phase , , as a function of the total bolometric luminosity of the population () and the lifetime of the phase (). The specific evolutionary flux is of the order stars -1 yr-1 in good approximation for any age between 3 and 10 Gyr. Even though evolutionary predictions in Renzini (renz98 (1998)) are given for a stellar population with solar composition, the results for are almost unchanged for metal-poor systems because a lower metallicity has opposite effects on the bolometric corrections and lifetimes of red giants at a given age (Maraston 1998, priv. comm.). For thermally pulsing AGB stars we assume a standard lifetime of 1 Myr for each magnitude of luminosity increase (Renzini renz98 (1998)). An absolute magnitude is adopted for the red populations of Phoenix, corresponding to a total luminosity (van de Rydt et al. vdry+91 (1991)). If the bulk of the Phoenix population were of intermediate age ( Gyr), then the expected ratio between the number of thermally pulsing AGB stars in the 1 mag interval above the tip, and the sum of RGB and early-AGB stars in the 1 mag range below the tip, would be /. This is about 3 times the fraction observed in Phoenix, where / (the error simply reflects the count statistics). The number of upper-AGB stars is therefore consistent with % of the stellar population in Phoenix being of intermediate age, i.e. even the small observed number of AGB stars implies a significant intermediate age population. This not surprising since the lifetime of the thermally pulsing AGB phase is short enough that a large sample of progenitors is required to observe an appreciable number of upper-AGB stars. The possible concentration of stars on the red side of the HB is indeed consistent with the presence of an Gyr component, although a firm quantitative estimate of the fraction of intermediate age stars, and their mean age, must await for deeper images.
5.3 The young stars

We now turn to one of the most distinctive features of Phoenix, the presence of a recent burst of star formation. The wide baseline of the color used in this study, and the availability of a comparison field, allow us a better separation of stars in different evolutionary phases. Figure 12 presents our cmd for stars comprised within the star formation regions (the rectangles in Fig. 5). Superposed on the diagram are three representative isochrones from the Padua stellar evolution models (Bertelli et al. bert+94 (1994)), for a metal abundance ([Fe/H]) and ages , yr, and yr. The corresponding masses at the MS turnoff are 4.8, 3.0, and 2.0 , respectively. The model colors are sensitive to the adopted metallicity particularly in their evolved part. A yr old model provides a good fit to the upper main sequence of the young population in Phoenix. While in general core helium burning (HeB) stars on the blue loops give a substantial contribution to the blue plume in ground-based photometry (e.g., Tosi et al. tosi+91 (1991)), the gap at in Fig. 12 suggests that we have reached a good separation of the hydrogen and HeB star sequences. The group of bright blue stars having and matches quite well the expected location of HeB stars belonging to a 250 Myr old population. This suggestion is confirmed by the presence of a distinct sequence at which appear to trace the red end of the blue loops. Also, a short sequence of stars comprised in the region , is quite well matched by the blue loop phase of the yr old isochrone. The brightest red stars () almost overlap the red supergiant phase of the same yr isochrone (although the precise location of these luminous stars is a sensitive function of metallicity). Thus, the emerging picture is one in which the most recent star formation episode in Phoenix had finite duration (of the order 0.5 Gyr or more), with evidence of a distinct burst 0.6 Gyr ago, and went on forming stars until about yr ago. It is interesting to note that this picture is similar to what we have found in Fornax, where star formation proceeded from 1 Gyr until 0.2 Gyr ago (Held et al. held+99 (1999)).
How significant is this young population in terms of luminosity and mass ? To estimate the luminosity of the young star component, we selected the blue stars in the color and magnitude range , (the faint limit roughly corresponds to the MS turnoff of the 0.25 Gyr isochrone). The stars were counted in 0.5 mag bins, and corrected for incompleteness according to the results of the artificial star experiments. We found 57 blue stars, corresponding to 106 stars after completeness correction. Assuming that all these are MS stars distributed according to a Salpeter initial mass function, an order-of-magnitude estimate of the luminosity of the youngest stars was obtained following Renzini (renz98 (1998)), under the simple assumption of a single 100 Myr old burst of star formation. The observed stars are predicted in the mass range for a total luminosity of . Using the bolometric corrections and mass-to-light ratios of Maraston (mara98 (1998)), these correspond to in bolometric units or a mass of for the most recent burst. The youngest stars thus contribute 6% to the luminosity of the galaxy, corresponding to a mass fraction . These results are similar to those obtained by Mould (moul97 (1997)) and Aparicio et al. (apar+97 (1997)) for LGS3, a dwarf galaxy which shares the basic characteristics of Phoenix, i.e. a smooth optical appearance accompanied by recent star formation. These estimates do not include the blue stars older than Myr, in particular the 600 million yr component. The star formation history of Phoenix (in particular in the last 1 Gyr) will be studied in more detail in a future paper using deeper data and synthetic cmd’s

The spatial distribution of young and intermediate age stars, and their relationship with the neutral gas in Phoenix (Young & Lo youn+lo97 (1997)), are shown in Fig. 13. The original blue star sample (Sect. 3) was split at in two subsets of stars older and younger than yr (open circles; larger symbols represent the brighter, younger stars). The location of the youngest stars suggests that the most recent star formation took place in a few central sites, while stars older than Gyr are spread over a larger area. The overall distribution of blue stars appears elongated in the NE–SW direction, i.e. roughly perpendicular to the halo of Phoenix (cf. VDK91 and Fig. 1) and pointing towards the Hi cloud. Since the radial velocity of Phoenix is not known, we do not really know if the Hi cloud A is physically associated with the galaxy, or the Magellanic Stream, or neither (e.g., Young & Lo youn+lo97 (1997)). However, if we assume that cloud A is associated with the galaxy (as its location and shell-like appearance seem to suggest), then the mass in neutral gas would be . This corresponds to /, an order of magnitude smaller than the Hi content in dwarf irregulars, which typically have a gas-to-star mass ratio of the order of unity (; Carignan et al. cari+98 (1998)). Among the several plausible scenarios, we only briefly comment on the possibility that the cloud A consists of gas accumulated from mass lost by evolved stars, blown out by the energy input of the most recent star formation episode. We have made a simple calculation of the mass released by an old population by adopting a total mass loss rate from red giants, AGB stars and planetary nebula ejecta of 0.015 yr-1 per yr (cf. Mould et al. moul+90 (1990)). We obtain a gas return of after 10 Gyr of normal evolution of old stars in Phoenix, i.e. the observed amount of Hi could have been accumulated in Gyr. By comparison, we estimate that only of gas have been returned to the interstellar medium by type II supernovae evolved from massive ( ) stars in the recent burst. Although the ability of a dwarf galaxy to retain its gas depends on poorly known physical parameters, such as the effects of SN explosions and the presence of a dark matter halo, these figures are not inconsistent with an internal origin of the gas in Phoenix.
6 Summary and conclusions
We have presented a deep CCD study of the Phoenix dwarf, a galaxy often regarded as a transition case between gas-poor dwarf spheroidals and gas-rich dwarf irregulars. Here we summarize the main conclusions of this study.
The detection of the HB of Phoenix represents one of the main results of this paper. We find a mean magnitude after correction for instrumental biases. Information on the HB morphology was obtained using a statistical approach. The horizontal branch of Phoenix turns out to be well extended to the blue, although red stars are about twice as numerous. This morphology, similar to that of And I, Leo II, and Tucana has two important implications. First, it demonstrates the presence of a significant (if not dominant) population older than 10 Gyr. Second, it implies that Phoenix, given its low metallicity, represents yet another (mild) example of the “second parameter effect” in dwarf galaxies. If the origin of this effect is identified with an age difference, the bulk of the stellar populations in Phoenix would have to be younger (by 2–3 Gyr) than stars in old halo globular clusters. We find that the spatial distribution of blue () HB stars is significantly more extended than that of red giant stars. Our result indicates that the early star formation episode occurred in Phoenix on a larger spatial scale that subsequent bursts. Horizontal branch stars have been used as tracers of the spatial distribution of the oldest stellar populations in other dwarf galaxies (And I, Fornax, Antlia), with similar results.
Besides this old population, Phoenix has a significant intermediate age component. We have confirmed the presence of a small number of stars above the RGB tip, significantly in excess over field contamination, and argued that these most likely trace the extended AGB of an intermediate age population. Using a standard lifetime for the upper AGB stars, we estimate that the intermediate age populations contribute about 30–40% of the luminosity of Phoenix. While we cannot establish the age of this component, there is some evidence that star formation declined since 8–10 Gyr ago. The candidate AGB stars seem to concentrate in the inner part of the galaxy, although to a lesser degree than the young stars.
Our wide photometric baseline has provided new information on the young stellar population in Phoenix. We have shown that the recent star formation episode, responsible for the sprinkling of blue stars characteristic of this dwarf, started at least 0.6 Gyr ago. The recent burst of stars formation ( yr ago) accounts for less than 6% of the luminosity of Phoenix and 0.2% in terms of mass. The blue stars which trace the most recent burst are concentrated in clumps or “associations” near the galaxy center, with a spatial distribution elongated in a direction perpendicular to the major axis defined by the diffuse galaxy light, and slightly offset towards the Hi cloud observed by Young & Lo (youn+lo97 (1997)). The neutral gas could have been blown out by the recent burst, a possibility the should be further investigated when the hypothesis of a physical link receives support by measurements of the galaxy radial velocity.
Excluding the regions of recent star formation, we have defined a clean sample of RGB stars that has been employed to re-derive the galaxy basic properties. A new distance modulus was obtained using the well defined cutoff of the red giant branch in the , diagram. More importantly, we have obtained for the first time an independent estimate of the distance to Phoenix, , based on the mean level of horizontal branch stars. The mean of the two independent measurements gives a distance , which confirms previous estimates. A mean metal abundance [Fe/H] was obtained with a direct comparison of the upper part of the RGB with the fiducial sequences of template Galactic globular clusters. A careful analysis based on extensive artificial star tests and comparison with previous photometry confirms the presence of an intrinsic color scatter in the red giants of Phoenix, mag, corresponding to a metallicity dispersion dex.
In conclusion, this paper provides new evidence that Phoenix has had an extended history of star formation. Its stellar populations appear fundamentally similar to those found in many dwarf spheroidal galaxies – even the young population has ages comparable to those of the youngest stars in Fornax (Beauchamp et al. beau+95 (1995), Stetson et al. stet+98 (1998), Saviane & Held savi+held98 (1999); Held et al. held+99 (1999)). Its Hi content (if any) is comparable to the amount of neutral gas found in Sculptor. In view of these results, we are inclined to regard Phoenix as a low-mass dwarf spheroidal seen in the middle of a star formation episode (during which gas is perhaps expelled). This similarity in the stellar populations of Phoenix and more luminous dSph’s is noteworthy given the difference either in mass or in location with respect to the big Local Group spirals. There appears to be no obvious correlation between the timescale of star formation and galaxy mass, although there is one between mass and production of heavy elements, as made evident by the well-know luminosity-metallicity correlation (e.g., Buonanno et al. buon+85 (1985)). The effects of the environment are not clear either, although Phoenix seems to fit well the trend suggested by van den Bergh (vdbe94 (1994)) between the presence of young or intermediate age populations in dSph’s and their distance from the Galaxy or M31. The origin of the striking difference in the star formation histories of Phoenix and Tucana (both are isolated Local Group dwarfs) remains rather puzzling, since these two dwarfs not only have comparable luminosities and metal abundances, but also a similar HB morphology, which probably indicates an old population formed nearly at the same epoch.
Acknowledgements.
It is a pleasure to thank C. Maraston and G. P. Bertelli for clarifying discussions on stellar population synthesis in metal-poor systems. We are grateful to C. Chiosi and S. Ortolani for careful reading of the original manuscript, and to the referee, Dr. Demers, for useful comments and suggestions. G. Da Costa kindly provided unpublished information on his spectroscopic observations of candidate AGB stars. I.S. acknowledges support of ANTARES, an astrophysics network funded by the HCM programme of the European Community. Y. M. acknowledges support from the Italian Ministry of Foreign Affairs and the Dottorato di Ricerca program at the University of Padova.References
- (1) Aparicio A., Gallart C., Bertelli G., 1997, AJ 114, 680
- (2) Beauchamp D., Hardy E., Suntzeff N.B., Zinn R., 1995, AJ 109, 1628
- (3) Bertelli G., Bressan A., Chiosi C., Fagotto F., Nasi E., 1994, A&AS, 106, 275
- (4) Buonanno R., Corsi C.E., Fusi Pecci F., Hardy E., Zinn R., 1985, A&A 152, 65
- (5) Buonanno R., Buzzoni A., Corsi C. E., Fusi Pecci F., Sandage A. R., 1988. In: Grindlay, J. E., Davis Philip A. G. (eds.) Proc. IAU Symp. 126, The Harlow- Shapley Symposium on Globular Cluster Systems in Galaxies. Kluwer, Dordrecht, p. 621
- (6) Burstein D., Heiles C., 1982, AJ 87, 1165
- (7) Canterna R., Flower P. J., 1977, ApJ 212, L57
- (8) Carignan C., Demers S., Côté S., 1991, ApJ 381, L13
- (9) Carignan C., Beaulieu S., Côté S., Demers S., Mateo M., 1998, AJ 116, 1690
- (10) Carretta E., Gratton R. G., 1997, A&AS 121, 95
- (11) Da Costa G.S., 1994. In: Meylan G., Prugniel P. (eds) Proc. ESO Workshop 49, Dwarf Galaxies. ESO, Garching, p. 221
- (12) Da Costa G.S., 1997. In: Arnaboldi M., Da Costa G. S., Saha P. (eds.) Proc. ASP Conf. Ser. 116, The Second Stromlo Symposium: The Nature of Elliptical Galaxies. ASP, San Francisco, p. 270
- (13) Da Costa G.S., 1998. In: Aparicio A., Herrero A. (eds.) Proc. of the VIIIth Canary Islands Winter School, Stellar Astrophysics for the Local Group: A First Step to the Universe. Cambridge University Press, Cambridge, p. 351
- (14) Da Costa G. S., Armandroff T. E., 1990, AJ 100, 162
- (15) Da Costa G. S., Armandroff T. E., Caldwell N., Seitzer P., 1996, AJ 112, 2576
- (16) Demers S., Irwin M. J. 1993, MNRAS 261, 657
- (17) Frogel J. A., Elias J. H., 1988, ApJ 324, 823
- (18) Frogel J. A., Whitelock P., 1998, AJ 116, 754
- (19) Frogel J. A, Mould J. R., Blanco V. M., 1990, ApJ 352, 96
- (20) Fusi Pecci F., Buonanno R., Cacciari C., Corsi C. E., Djorgovski S. G., Federici L., Ferraro F. R., Parmeggiani G., Rich M. R., 1996, AJ 112, 1461
- (21) Grillmair C. J., Mould J. R., Holtzman J. A., et al. (WFPC2 IDT), 1997, AJ 115, 144
- (22) Harris W. E., 1998, Electronically Published Catalog of Galactic Globular Clusters, http://physun.physics.mcmaster.ca/Globular.html
- (23) Held E.V., Bertelli G., Saviane I., 1999, in preparation
- (24) Hurley-Keller D., Mateo M., Nemec J., 1998, AJ 115, 1840
- (25) Landolt, A. U., 1992, AJ 104, 340.
- (26) Lee M. G., Freedman W. L., Madore B. F., 1993, ApJ 417, 553
- (27) Lee Y. W., Demarque P., Zinn R., 1990, ApJ 350, 155
- (28) Lee Y. W., Demarque P., Zinn R., 1994, ApJ 423, 248
- (29) Madore B. F., Freedman W. L., 1995, AJ 109, 1645
- (30) Maraston C., 1998, MNRAS 300, 872
- (31) Marigo P., Bressan A., Chiosi C., 1996, A&A 313, 545
- (32) Mateo M., 1998, ARA&A 36, 435
- (33) Mighell K. J., Rich R. M., 1996, AJ 111, 777
- (34) Mould J. R., 1997, PASP 109, 125
- (35) Mould J. R., Bothun G. D., Hall P. J., Staveley-Smith L., Wright A. E., 1990, ApJ 362, L57
- (36) Ortolani S., Gratton R.G, 1988, PASP 100, 1405 (OG88)
- (37) Renzini A., 1998, AJ 115, 2459
- (38) Renzini A., Buzzoni A., 1986. In: Chiosi C., Renzini A. (eds.) Spectral Evolution of Galaxies. Reidel, Dordrecht, p. 195
- (39) Saviane I., Held E.V., 1999, in preparation
- (40) Saviane I., Held E. V., Piotto G., 1996, A&A, 315, 40 (Paper I)
- (41) Seitzer P., Lavery R. J., Suntzeff N. B., Walker A. R., Da Costa G. S., 1998, in preparation
- (42) Smecker-Hane T. A., Stetson P. B, Hesser J. E., Lehnert M. D., 1994, AJ 108, 507
- (43) Stetson P. B., 1987, PASP 99, 191
- (44) Stetson P. B., Hesser J. E., Smecker-Hane T. A. 1998, PASP 110, 533
- (45) Suntzeff N. B., Mateo M., Terndrup D. M., et al., 1993, ApJ 418, 208
- (46) Tosi M., Greggio L., Marconi G., Focardi P., 1991, AJ 102, 951
- (47) van den Bergh S., 1994, ApJ 428, 617
- (48) van de Rydt F., Demers S., Kunkel W. W., 1991, AJ 102, 130 (VDK91)
- (49) Young L. M., Lo K. Y., 1997, ApJ 490, 710