Submillimeter detection
of the Sunyaev – Zel’dovich effect
toward the most luminous X-ray cluster at z=0.45
Abstract
We report on the detection of the Sunyaev – Zel’dovich (SZ) signals toward the most luminous X-ray cluster RXJ1347-1145 at Nobeyama Radio Observatory (21 and 43 GHz) and at James Clerk Maxwell Telescope (350 GHz). In particular the latter is the first successful detection of the SZ temperature increment in the submillimeter band which resolved the profile of a cluster of galaxies. Both the observed spectral dependence and the radial profile of the SZ signals are fully consistent with those expected from the X-ray observation of the cluster. The combined analysis of 21GHz and 350GHz data reproduces the temperature and core-radius of the cluster determined with the ROSAT and ASCA satellites when we adopt the slope of the density profile from the X-ray observations. Therefore our present data provide the strongest and most convincing case for the detection of the submillimeter SZ signal from the cluster, as well as in the Rayleigh – Jeans regime. We also discuss briefly the cosmological implications of the present results.
RESCEU-3/99
UTAP-318/98
The Astrophysical Journal (Letters), in press
1 Introduction
The Sunyaev – Zel’dovich (SZ) effect (Zel’dovich & Sunyaev 1969; Sunyaev & Zel’dovich 1972), a change in the apparent brightness of the cosmic microwave background toward a cluster of galaxies, provides important probes for cluster gas properties, the global cosmological parameters and the peculiar velocity field on large scales (e.g. Silk & White 1978; Sunyaev & Zel’dovich 1980; Rephaeli & Lahav 1991; Kobayashi, Sasaki & Suto 1996; Yoshikawa, Itoh & Suto 1998; Birkinshaw 1999). While the temperature decrement due to the SZ effect is observed for tens of clusters in the Rayleigh – Jeans regime, there is no unambiguous SZ detection in the Wien region (i.e., the submillimeter band) where the apparent brightness increases. Andreani et al. (1996,1999) and Holzapfel et al. (1997) reported the detection of the SZ temperature increment of the clusters RXJ0658-5557 and A2163, respectively, at the wavelength mm. Although their total fluxes are consistent with the SZ signals from the clusters, it is not clear to what extent the obtained signals are affected by other possible contaminations including the dust in our Galaxy and submm sources in the cluster field (Smail, Ivison & Blain 1997; Hughes et al. 1998). This question also applies to a recent claim of the submm SZ detection (Lamarre et al. 1998) toward A2163 which is solely based on the spectral dependence because their beamsize is very large ().
This simply implies that the mapping observation of the SZ effect is essential. At cm wavelengths, more than a dozen of clusters have been already mapped with interferometers, but this technique is not yet feasible at submm bands. In the present Letter, we describe our successful SZ mapping observation of the X-ray cluster RXJ 1347-1145 () at 350 GHz (0.85mm) with SCUBA (Submillimetre Common-User Bolometer Array) on JCMT (James Clerk Maxwell Telescope) as well as the scanning observations (at 21 and 43 GHz) at Nobeyama Radio Observatory.
2 Observation of the Sunyaev – Zel’dovich effect
toward RXJ 1347-1145 at cm, mm and submm bands
2.1 the target cluster RXJ 1347-1145
ROSAT and ASCA satellites revealed that RXJ 1347-1145 at is the brightest X-ray cluster of galaxies observed so far (Schindler et al. 1997). With the additional ROSAT/HRI data acquired recently, the total exposure time of the cluster in the X-ray observation of RXJ 1347-1145 is now 36.5 ksec. We have reanalyzed the new X-ray radial profile, and found that it is well fitted by the isothermal model:
| (1) |
with the following parameters; the central electron density , the core radius , and , where quoted errors represent 90% statistical uncertainties (unless otherwise stated, we assume km/sec/Mpc and with vanishing cosmological constant ). Since the corresponding SZ radial profile is given by
| (2) |
the cluster is definitely an ideal SZ target due to its unusually large central density and high temperature keV (Schindler et al. 1997). In addition, its small core radius should enable us to map the radial profile at 350 GHz within the field-of-view () of the SCUBA, while retaining a reasonable angular resolution (the beamsize of SCUBA is ). This is the reason why we selected the cluster RXJ 1347-1145 as our SZ target at 350 GHz in the JCMT/SCUBA, as well as at 21 and 43 GHz in the Nobeyama Radio Observatory (NRO).
2.2 21 and 43 GHz at Nobeyama 45-m telescope
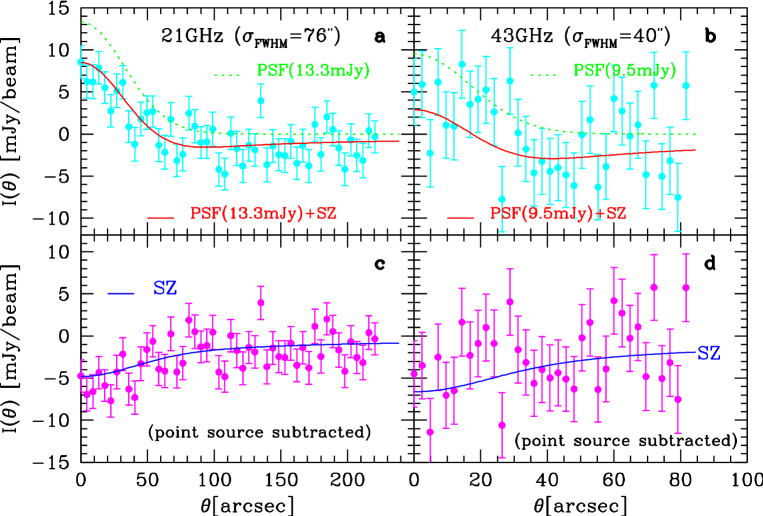
First we observed RXJ 1347-1145 at 21 (43) GHz with HEMT amplifier (SIS mixer) mounted on the Nobeyama 45-m telescope between March 3rd and 15th, 1998. The observation was performed in the cross-scan mode with chop throw in azimuth, and NGC7027 was used to calibrate the flux (estimated calibration error is less than 10%). A total exposure time is 16.2 (14.4) ksec and the beamsize of the PSF (Point Spread Function) is , at 21 (43) GHz. To cut lower frequency noise due to the sky variation, the data were high-pass filtered with a time-constant of 30 (21) sec, and then integrated and averaged over radial bins. The resulting radial profiles of the cluster at 21 and 43 GHz (upper panels in Fig.1) indicate the presence of a point source near the cluster center in addition to the SZ signal. In fact the radio source was detected also in the NRAO 1.4 GHz sky survey (Condon et al. 1998) and in the OVRO serendipitous survey of SZ effect at 28.5GHz (Cooray et al. 1998; Carlstrom, private communication). The former suggests that the radio source is located at (J2000). This is away from the optical center, defined as the location of the central galaxy. This offset is within a relative positional error between our radio frame (Johnston et al. 1995) and the optical frame (MacGillivray & Stobie 1985) adopted in Schindler et al. (1995).
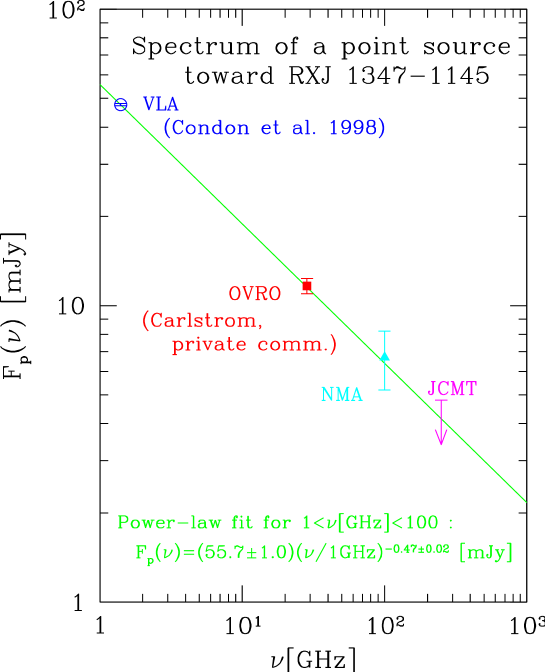
Since the accurate flux of the point source is crucial in properly extracting the SZ signal, we observed the central source at 93 GHz and 105 GHz simultaneously with Nobeyama Millimeter Array (NMA) between May 19th and 21st 1998 (15 hours’ exposure at each frequency), and at 250 GHz in the photometry mode of SCUBA (Holland et al. 1998) on May 30th and 31st, 1998 (2 hours’ exposure). Since the thermal SZ effect vanishes around at 250 GHz (Rephaeli & Lahav 1991), the latter signal, if any, is expected to be dominated by the point source. We detected the point source flux of mJy at 100 GHz, while the 250 GHz observation placed a upper limit of 4.8 mJy. These results are summarized in Figure 2. We have corrected the point-source fluxes for the SZ decrement at the corresponding frequency, although the contamination is comparable or less than the quoted error bars in Figure 2.
We fitted the three data of the point source at GHz to a single power-law:
| (3) |
where the quoted errors represent . Since equation (3) yields a fairly accurate approximation for the flux at 21 and 43 GHz, we subtract the corresponding contribution of the point source from our data. Most radio sources with the spectrum index less than are known to exhibit a small amount of time variation (Eckart, Hummel & Witzel 1989). Therefore it is unlikely that the total flux estimated from equation (3) varies significantly due to the possible variability of the source. The corrected radial profiles of the cluster plotted in lower panels of Figure 1 clearly exhibit an extended negative intensity characteristic of the SZ signal. They are quite consistent with those expected from the X-ray observation, especially at 21 GHz where the S/N is significantly higher than at 43 GHz.
2.3 350 GHz at JCMT/SCUBA
We observed the cluster at 350 GHz with SCUBA in the jiggling mode on May 30th and 31st, 1998. Unfortunately the weather conditions during our observation were bad (the zenith optical depth at 350 GHz ranged around ). The observation was performed over 64 independent points over the sky spaced by each other with chop throw in azimuth. A total exposure time amounts to 18.6 ksec. The primary flux calibration and beam measurement were carried out using Uranus, and the secondary calibrations were performed at the beginning and the end of each observation using IRC10216 and 16293-2422, respectively, to check the stability of gain. The resulting PSF has a beamsize of , and the calibration error is less than 15%. The beam profile was approximately Gaussian, but our analysis takes account of the effect of the residual beam-wing as well.
First we analyzed the raw data using REMSKY (Jenness, Lightfoot & Holland 1998) in SURF package (Jenness & Lightfoot 1998) to remove spatially correlated sky-noise. With REMSKY we subtract the sky-noise at each integration from the entire map using the median value of the bolometers (except for very noisy ones). Therefore the zero-level of the resulting map after all integrations is still uncertain depending on the sky condition. We estimated 1 error of our base-level or DC offset to be as large as mJy/beam due to the bad weather conditions. Then the data were reduced and converted to the image using SURF ver 1.2. The resulting image turned out to contain several bright point sources in the field. We detected 7 spurious contamination sources above a threshold of 3 using SExtractor package (Bertin & Arnouts 1996). While some of them might simply be due to the sky noise, others would be real sources; in fact the previous SCUBA deep surveys toward clusters of galaxies (Smail, Ivison & Blain 1997; Smail et al. 1998) and blank fields (Hughes et al. 1998; Barger et al. 1998) detected many submillimeter sources in their fields (but with mJy typically). Since it is premature to discuss further the reality of the “sources” at this point, we consider the cases with and without the 7 sources, separately.
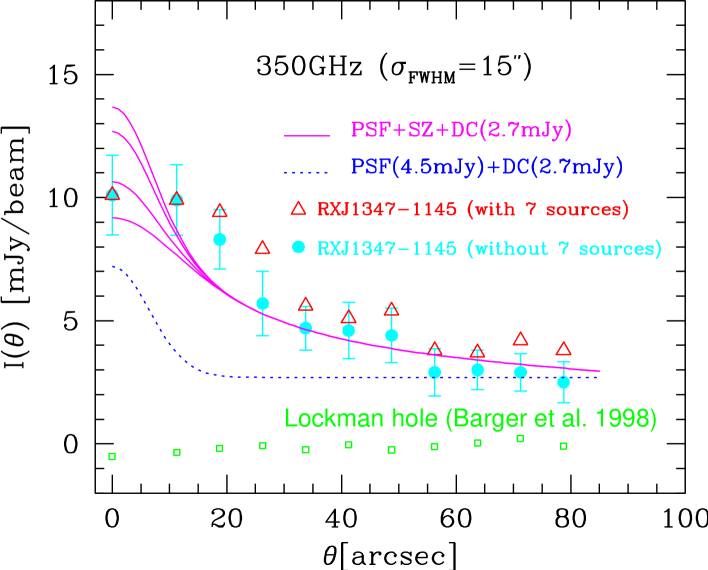
The radially averaged profile of the image is plotted in Figure 3. We confirmed that the presence of the extended feature comparable to the cluster extension is robust even with retaining the 7 sources. In this plot, we adopted the cluster center as the position of the optical center. It should be noted that the error bars in the inner annuli are smaller than those in the outer annuli, despite the smaller effective area. This is because several noisy bolometers located at outer annuli contribute significantly to the noise-level of the corresponding annuli. Thus the noise level is in fact dependent on the angular radius. These complex noise properties of the SCUBA should be kept in mind in interpreting the result below.
In fitting our observed profile to the model prediction at 350 GHz, we have to take account of the DC offset mentioned above, , and the possible contribution of the central point source . In what follows, we mainly consider three values for the point-flux so as to take into account the associated uncertainties; mJy (extrapolated from eq.[3]), mJy (a conservative 2 upper limit from eq.[3]) and . We adopt the latter since many radio sources are known to exhibit a steep decline of flux around submillimeter bands (e.g., Gear et al. 1994). Incidentally mJy is a similar flux level reported for the submm emission from two central galaxies in luminous X-ray clusters (Edge et al. 1999). Thus the analysis using mJy may be also useful in understanding the effect of the possible dust emission from the central galaxy. Then we treat the DC offset always as a free fitting parameter. Note that the central feature of our data is significantly more extended than the PSF of beam even for the case with mJy (blue dotted curve in Fig.3). The best-fit parameters for and are listed in Table 1 together with the corresponding value of the reduced . Table 1 indicates that the fit is unacceptable without including the SZ profile, while the agreement with the SZ profile is insensitive to the 7 sources.
| 7 sources | SZ | [mJy] | [mJy/beam] | reduced |
|---|---|---|---|---|
| No | No | 7.4 | 4.0 | 3.6 |
| Yes | No | 6.1 | 5.1 | 3.6 |
| No | Yes | 1.5 | 2.7 | 0.73 |
| Yes | Yes | 0.2 | 3.8 | 0.79 |
We applied the same reduction procedure for the Lockman-hole data with SCUBA (Barger et al. 1998), and found no central extended signal or significant DC offset. This confirms that our signal profile does not suffer from any systematic effects in the reduction procedure. In addition, it supports our suspicion that our large DC offset is due to the relatively large sky-noise during our observing run; our and their noise levels are typically 8 mJy/beam and 0.8 mJy/beam, respectively.
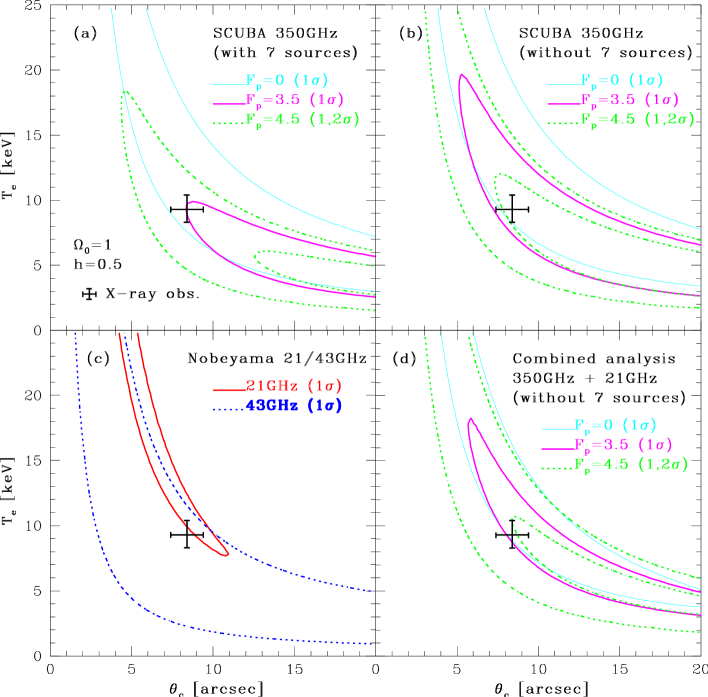
We repeated the similar fitting analysis in 21 and 43 GHz as well. The results are summarized in confidence contours on the – plane (Fig.4). Panels a) to c) indicate that the profile in each band is consistent with each other and actually in good agreement with the parameters estimated from the X-ray observation. Combined data analysis of 21 and 350 GHz further improves the agreement and puts more stringent constraints on and (panel d). Therefore our present data provide the strongest and most convincing case for the detection of the submm SZ signal from the cluster as well as in the Rayleigh – Jeans regime.
3 Discussion
Detection of the SZ signals in multi-bands for one particular cluster has important cosmological implications; combining our data in the X-ray, 21 GHz and 350 GHz of RXJ1347, we estimated the angular diameter distance at as Mpc assuming mJy and the spherical symmetric profile of the cluster (Silk & White 1978; Kobayashi, Sasaki & Suto 1996; Birkinshaw 1999). The first and second quoted errors come from the uncertainties of the observed SZ intensity and of the parameters from X-ray observation, respectively. This angular diameter distance is translated to and km/sec/Mpc for ( and , respectively. While the estimates still have fairly large errors compared with those from optical observations, it is encouraging that they fit in a reasonable range, and we expect to improve the estimates by observing the cluster again (hopefully in much better weather condition). Then it will be feasible to separate the kinematic and thermal SZ effects by a simultaneous fit to the 21 and 350 GHz data, which will yield a estimate of the peculiar velocity of the cluster (Rephaeli & Lahav 1991; Yoshikawa, Itoh & Suto 1998; Birkinshaw 1999).
In the above discussion, we have neglected several issues which could affect our interpretation of the detection of the SZ signal from the cluster in principle, including a possible variability of the central point source, a non-sphericity and a non-isothermality (Yoshikawa, Itoh & Suto 1998; Makino, Sasaki & Suto 1998; Suto, Sasaki & Makino 1998; Yoshikawa & Suto 1999), a cooling flow (Fabian 1994; Allen 1998; Allen & Fabian 1998), contribution of submm dust (Lamarre et al. 1998; Edge et al. 1999), unresolved lensed sources, and a peculiar velocity of the cluster. These would definitely contribute to put additional uncertainties in the best-fit parameters of the cluster to some extent. Nevertheless, it is almost impossible to explain both the spectral dependence in three bands and the radial profile in each band simultaneously by the combination of those effects alone without the SZ effect, as clearly demonstrated in Figure 4. Detailed analysis taking account of those issues will be presented elsewhere (Komatsu et al., in preparation).
We thank Iain Coulson, Nario Kuno and Satoki Matsushita for kind assistance during our observing runs at JCMT, Nobeyama 45-m and Nobeyama Millimeter Array, respectively. We also thank Nick Tothill for providing the calibration data for our observation, and Tim Jenness, John Richer, Remo Tilanus and Goeran Sandell for many fruitful comments and suggestions on data analysis via the SCUBADR mailing list. We are grateful to A. J. Barger for providing the SCUBA data of Lockman-Hole, to John Carlstrom for information on the flux of the central source at 28.5 GHz, and to an anonymous referee for several critical comments. The travel of E. K. to Hawaii was supported in part by Satio Hayakawa Foundation in the Astronomical Society of Japan. T. K. acknowledges support from a JSPS (Japan Society for the Promotion of Science) fellowship. This research was supported in part by the Grants-in-Aid for the Center-of-Excellence (COE) Research of the Ministry of Education, Science, Sports and Culture of Japan to RESCEU (No.07CE2002).
REFERENCES
Allen, S. W. 1998, MNRAS, 296, 392
Allen, S. W. & Fabian, A. C. 1998, MNRAS, 297, L57
Andreani, P. et al. 1996, ApJ, 459, L49
Andreani, P. et al. 1999, ApJ, in press (astro-ph/9811093)
Barger, A. J., Cowie, L. L., Sanders, D. B., Fulton, E., Taniguchi, Y., Sato, Y., Kawara, K. & Okuda, H. 1998, Nature, 394, 248
Bertin, E. & Arnouts, S. 1996, A&AS, 117, 393
Birkinshaw, M. 1999, Phys. Rep., in press (astro-ph/9808050)
Condon, J. J., Cotton, W. D., Greisen, E. W., Yin, Q. F., Perley, R. A., Taylor, G. B. & Broderick, J. J. 1998, AJ, 115, 1693
Cooray, A. R., Grego, L., Holzapfel, W. L., Joy, M. & Carlstrom, J. E. 1998, AJ, 115, 1388
Eckart, A., Hummel, C. A. & Witzel, A. 1989, MNRAS, 239, 381
Edge, A. C., Ivison, R. J. Smail, I., Blain,A.W., & Kneib, J.-P. 1999, MNRAS, in press (astro-ph/9902038)
Fabian, A. C. 1994, ARA&A, 32, 277
Gear, W. K., et al. 1994, MNRAS, 267, 167
Holland, W. S., Cunningham, C. R., Gear, W. K., Jenness, T., Laidlaw, K., Lightfoot, J. F. & Robson, E. I. 1998, Proc. SPIE, 3357, 305
Holzapfel, W.L., Ade, P.A.R., Church, S.E., Mauskopf, P.D., Rephaeli, Y., Wilbanks, T.M., & Lange, A.E. 1997, ApJ, 481, 35
Hughes, D. H., et al. 1998, Nature, 394, 241
Jenness, T., Lightfoot, J. F. & Holland, W. S. 1998, Proc. SPIE, 3357, 548
Jenness T. & Lightfoot, J. F. 1998, Starlink User Note 216.3
Johnston, K.J. et al. 1995, AJ, 110, 880
Kobayashi, S., Sasaki, S. & Suto, Y. 1996, PASJ, 48, L107
Lamarre, J. M., et al. 1998, ApJ, 507, L5
Makino, N., Sasaki, S. & Suto, Y. 1998, ApJ, 497, 555
MacGillivray, H. T. & Stobie R. S. 1985, Vistas in Astronomy, 27, 433
Rephaeli, Y. & Lahav, O. 1991, ApJ, 372, 21
Schindler, S. et al. 1995, A&A, 299, L9
Schindler, S., Hattori, M., Neumann, D. M. & Böhringer, H. 1997, A&A, 317, 646
Silk, J. & White, S. D. M. 1978, ApJ, 226, L103
Smail, I., Ivison, R. J. & Blain, A. W. 1997, ApJ, 490, L5
Smail, I., Ivison, R. J., Blain, A. W. & Kneib, J.-P. 1998, ApJ, 507, L21
Sunyaev, R. A. & Zel’dovich, Ya. B. 1972, Comments Astrophys. Space Phys., 4, 173
Sunyaev, R. A. & Zel’dovich, Ya. B. 1980, MNRAS, 190, 413
Suto, Y., Sasaki, S. & Makino, N. 1998, ApJ, 509, 544
Yoshikawa, K., Itoh, M. & Suto, Y. 1998, PASJ, 50, 203
Yoshikawa, K. & Suto, Y. 1999, ApJ, 513, March 10 issue, in press (astro-ph/9810247)
Zel’dovich, Ya. B. & Sunyaev, R. A. 1969, Astrophys. Space. Sci., 4, 301