RESCEU-2/99
UTAP-317/98
Advances in Space Research, in press.
COSMOLOGICAL IMPLICATIONS OF GALAXY CLUSTERS
IN X-RAY, MILLIMETER, AND SUBMILLIMETER BANDS
Yasushi Suto1,2, Tetsu Kitayama2, Eiichiro Komatsu3, Makoto Hattori3, Ryohei Kawabe4, Hiroshi Matsuo4, Sabine Schindler5, and Kohji Yoshikawa6
1Research Center for the Early Universe, School of Science,
University of Tokyo, Tokyo 113-0033, Japan
2Department of Physics, University of Tokyo,
Tokyo 113-0033, Japan
3Astronomical Institute, Tôhoku University,
Sendai 980-8578, Japan
4Nobeyama Radio Observatory,
Nagano 384-1305, Japan
5Astrophysics Research Institute, Liverpool John Moores
University, Liverpool L3 3AF, UK
6Department of Astronomy, Kyoto University,
Kyoto 606-8502, Japan
ABSTRACT
Cosmological implications of clusters of galaxies are discussed with particular attention to their importance in probing the cosmological parameters. More specifically we compute the number counts of clusters of galaxies, Log – Log relation, in X-ray and submm bands on the basis of the Press–Schechter theory. As an important step toward breaking the degeneracy among the viable cosmological models, we observed the most luminous X-ray cluster RXJ1347-1145 in three bands (21 and 43 GHz in the Nobeyama Radio Observatory, Japan, and 350 GHz in the J. C. Maxwell telescope at Mauna Kea, Hawaii). We report on the preliminary results which are in good agreement with the profile of the Sunayev – Zel’dovich effect predicted on the basis of the previous X-ray observation of the cluster.
1 INTRODUCTION
There are several reasons why clusters of galaxies are regarded as useful tools in cosmology; (i) since the dynamical time-scale of clusters is comparable to the age of the universe, they should retain the cosmological initial conditions fairly faithfully, (ii) clusters can be observed in various wavelengths including optical, X-ray, radio, mm and submm bands, and recent and future big projects (e.g., SDSS, AXAF, PLANCK) aim to make extensive surveys and detailed imaging/spectroscopic observations of clusters, (iii) to the first order approximation, clusters can be regarded as a simple system of dark matter, gas and galaxies, and thus theoretically well-defined and relatively well-understood, at least compared with galaxies themselves, (iv) clusters of galaxies can be observed up to high redshifts and thus provide a probe of the distant universe.
X-ray observations are particularly suited for the study of clusters, because the X-ray emissivity is proportional to and less sensitive to the projection contamination which has been known to be a serious problem in their identifications with the optical data. In addition, the Sunyaev – Zel’dovich (SZ) effect (Sunyaev & Zel’dovich 1972), observed in radio, millimeter and submillimeter bands, is now opening a new window to investigating cluster properties, especially at high redshifts. In this paper, we aim to show the significance of current and future observations in these bands in cosmology.
2 LOG – LOG OF X-RAY CLUSTERS
We compute the number of clusters observed per unit solid angle with X-ray flux greater than by
| (1) |
where is the speed of light, is the cosmic time, is the angular diameter distance, and are respectively the gas temperature and the band-limited absolute luminosity of clusters, and is the comoving number density of virialized clusters of mass at redshift .
Given the observed flux in an X-ray energy band [,], the source luminosity at in the corresponding band [,] is written as
| (2) |
where is the luminosity distance. We adopt the observed relation parameterized by
| (3) |
We take , and as a fiducial set of parameters on the basis of recent observational indications (David et al. 1993; Mushotzky & Scharf 1997). Then we translate into the band-limited luminosity by properly taking account of metal line emissions in addition to the thermal bremsstrahlung (we fix the abundance of intracluster gas as 0.3 times the solar value).
Assuming that the intracluster gas is isothermal, its temperature is related to the total mass by
| (4) | |||||
where is the Boltzmann constant, is the gravitational constant, is the proton mass, is the mean molecular weight (we adopt ), and is a fudge factor of order unity which may be calibrated from hydrodynamical simulations or observations. We adopt as canonical based on the recent simulation results (e.g. Bryan & Norman 1998). The virial radius of a cluster of mass virialized at is computed from , the ratio of the mean cluster density to the mean density of the universe at that epoch. We evaluate this quantity using the formulae for the spherical collapse model presented in Kitayama & Suto (1996b) and assuming for simplicity that is equal to the epoch at which the cluster is observed. Finally, we compute the mass function in equation (1) using the Press–Schechter theory (Press & Schechter 1974) assuming as above. The effect of is discussed by Kitayama & Suto (1997) in this context, and the more general consideration of is given in Lacey & Cole (1993), Sasaki (1994), and Kitayama & Suto (1996a,b).
3 BREAKING THE DEGENERACY
WITH THE SUNYAEV
– ZEL’DOVICH EFFECT
As has been realized for a while, a cosmological observation is often accounted for by a set of quite different models. In the present case, we found that the following models equally fit the Log – Log of ROSAT X-ray clusters (quoted numbers are 1 statistical and systematic errors, respectively):
| (5) |
for Cold Dark Matter (CDM) models, and
| (6) |
for CDM models. In order to exhibit this degeneracy among viable cosmological models, we select several examples listed in Table 1 which reproduce the ROSAT Log – Log in almost an indistinguishable manner (Fig.1a).
| Model | ||||||
|---|---|---|---|---|---|---|
| L03 | 0.3 | 0.7 | 0.7 | 1.04 | 3.4 | 1.2 |
| O045 | 0.45 | 0 | 0.7 | 0.83 | 3.4 | 1.2 |
| E1 | 1.0 | 0 | 0.5 | 0.56 | 3.4 | 1.2 |
| L03 | 0.3 | 0.7 | 0.7 | 0.90 | 3.4 | 1.5 |
| L01 | 0.1 | 0.9 | 0.7 | 1.47 | 2.7 | 1.2 |

While this degeneracy can be broken by several methods, one possibility is to combine with observations of the Sunyaev & Zel’dovich (SZ) effect, the distortion of the cosmic microwave background (CMB) spectrum due to the inverse-Compton scattering in high temperature intracluster electrons (Sunyaev & Zel’dovich 1972, SZ). The specific intensity of the SZ signal at the rest frame of the cluster is given by
| (7) |
where is the Planck constant, and is the Compton -parameter:
| (8) |
In the above expressions, is the CMB temperature divided by K, is the photon energy in units of , and
| (9) | |||||
| (10) |
By integrating equation (7) over a cluster, one obtains the excess flux from the cluster relative to the CMB:
| (11) | |||||

The spectrum of the SZ effect is completely specified by the function which is independent of cluster properties. Most importantly, is negative at (GHz, cm), while positive at (Fig.2). Clusters of galaxies therefore serve as negative (absorbing) sources at mm and cm bands, and as positive (emitting) sources at submm band. At keV, relativistic effects of electrons become important and the above expressions need to be modified. We thus apply the relativistic correction to the intensity change derived by Rephaeli (1995; see also Rephaeli & Yankovitch 1997): At the observed wavelength of 0.85 mm, the above correction leads to 4%, 11% and 16% reduction in the excess flux, i.e., , at keV, keV and keV, respectively. While clusters with keV are rare and the above correction does not make significant difference, we take it into account for completeness.

Panels (b) and (c) in Figure 1 show the number counts of clusters of galaxies in the hard X-ray (2–10 keV) and the submm (0.85 mm, due to the SZ effect) bands for models which reproduce the observed Log – Log in the soft X-ray band (Table 1). Clearly the predictions in submm bands are significantly different among the models. To see this clearly, we plot in Figure 3 contour maps of the cluster log–log in different bands on the plane. For the 0.5–2 keV band, the 1 significance level is plotted, while for the 2–10 keV and submm bands, the contours of the number of clusters per steradian (, , from bottom to top) at erg cm-2 s-1 and mJy are plotted, respectively. The values derived from the COBE 4 year data (Bunn & White 1997) are also given for reference. Panels (a) and (b) show that the contours for the 2–10 keV band counts run almost parallel to the contour of the 0.5–2 keV band counts. In this sense, future log–log data in the hard X-ray band will provide an independent consistency check of the ROSAT soft X-ray data. The shape of the submm log–log contours, on the other hand, is quite different, especially at high , and thus should place complementary constraints on and . If the fixed shape parameter () is adopted, the corresponding log–log contours are similar to the conventional CDM () case, except at and . By contrast, the COBE normalized is very sensitive to any changes in the spectral shape.
4 SEARCH FOR THE SUBMM SZ EFFECT OF RXJ 1347-1195
RXJ 1347.5-1145 () is the most luminous X-ray cluster of galaxies known so far (Schindler et al. 1997). Its exceptionally high column density of electrons at the center implies that this is one of the most promising clusters for the detection of the first unambiguous SZ increment signal. This is clearly illustrated in Table 2 where we compute the expected central SZ intensity at 0.85mm for several clusters with measured SZ temperature decrement in the Rayleigh – Jeans regime (except for our current target, RXJ 1347-1195). Wherever available, 1 errors in the parameters are shown which are also adopted to estimate the error in .
| cluster | [keV] | [arcsec] | ||||
|---|---|---|---|---|---|---|
| RXJ 1347–1145 | 0.45 | 9.4 | ||||
| CL0016+16 | 0.555 | 0.81 | 51 | 0.65 | ||
| A2163 | 0.201 | |||||
| A2218 | 0.171 | 0.63 | ||||
| A2142 | 0.0899 | |||||
| A478 | 0.0881 | |||||
| A2256 | 0.0581 | |||||
| Coma | 0.0235 |
On the basis of this analysis, we performed the search for the SZ effect towards the cluster RXJ1347-1145, at 21 and 43 GHz with NRO (Nobeyama Radio Observatory) 45m telescope between March 3 and 15, 1998, and at 350 GHz with SCUBA installed on JCMT (J.C.Maxwell Telescope) 15m telescope on May 30 and 31, 1998. Although there have been a few claims of the detection of the SZ temperature increment for some clusters (e.g. Andreani et al. 1996; Lamarre et al. 1998), they measured the total flux alone which could be significantly contaminated by the dust in our Galaxy and also by submm sources in the field. Therefore it is essential to map the profile of a cluster so that one can test it against the predicted SZ signal profile. This is the reason why we attempted the observation with SCUBA which has a reasonable angular resolution, in FWHM, with a FOV of .
As a matter of fact, it turned out that a radio point source exists near the center of our target cluster. The flux of the central point source had been determined to be mJy at 1.4GHz with VLA (Condon et al. 1988), and mJy at 28.5GHz in the OVRO serendipitous survey of SZ effect (J.Carlstrom, private communication). We also observed the central source at 100 GHz with Nobeyama Millimeter Array (NMA) between May 19th to 21st, 1998, and found the flux to be mJy. The three data at GHz are very well approximated by a single power-law:
| (12) |
where the quoted errors are . We subtracted the contribution of the point source according to equation (12) from our data at 21 and 43 GHz. Although the point source might be a variable, the degree of variability is known to be fairly small for radio sources with steep spectrum (spectral index ; e.g. Eckart, Hummel & Witzel 1989).
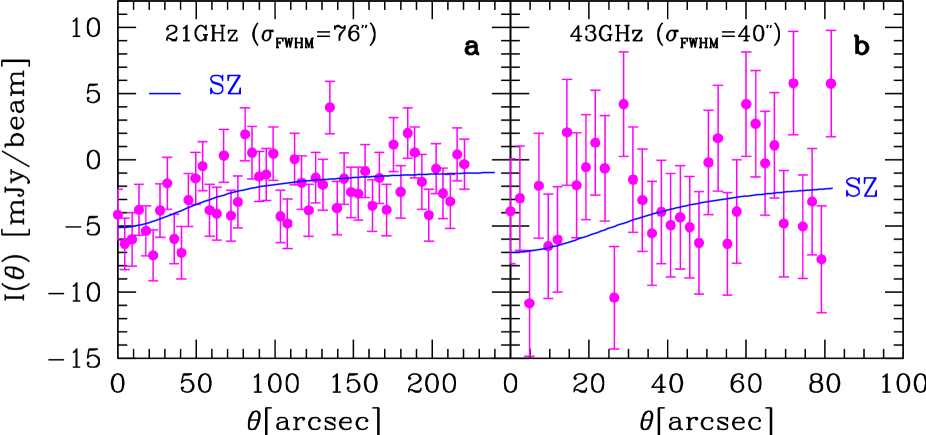
Figure 4 shows the profiles of the scans towards the cluster at 21 and 43 GHz after subtracting the point source. In both cases, a extended negative intensity profile is clearly visible. Especially at 21 GHz where the S/N is significantly higher than at 43GHz, the profile is quite consistent with the SZ profile expected from the X-ray observation. This is the first detection of the SZ temperature decrement towards the cluster RXJ 1347-1145.
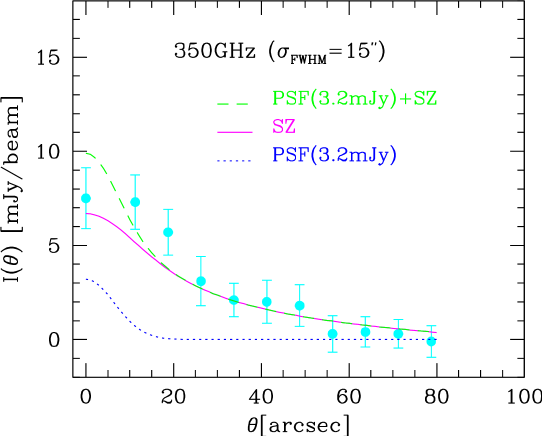
The observation of the cluster at 350 GHz with SCUBA was performed on May 30 and 31, 1998. The raw data were processed with REMSKY in SURF package to remove spatially correlated sky-noise. Since REMSKY systematically changes the base-level of the map up to the sky-noise level, the resulting zero-level is uncertain depending on the sky condition. We estimated 1 error of our base-level or DC offset, , to be as large as mJy/beam; the sky condition during our observation was not so good (the zenith optical depth at 350 GHz ranged around ). Also we extracted 7 spurious contamination sources above a threshold of 3 using SExtractor package. The radially averaged profile of the cluster at 350 GHz after subtracting the sources and the uncertain DC level is plotted in Figure 6. Also plotted in the figure are the SZ intensity profiles at 350 GHz predicted from the latest X-ray observation with the point source of and 3.2 mJy, as well as the point spread function of the 3.2 mJy source. Since normal radio sources often show a steep decline of flux at higher (submillimeter), we regard the value, 3.2 mJy, extrapolated from equation (12) as the upper limit of the flux. Again it is clear that the extended feature of the observed intensity profile cannot be described by the point spread function alone.
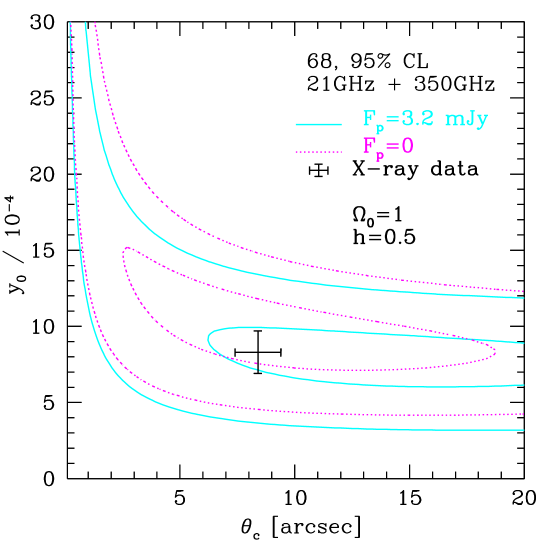
To express the result in a statistical and quantitative manner, we carried out a fit to the SZ profiles at 21 and 350 GHz simultaneously on the basis of the -model with taking a central -parameter, , and the angular core radius, , as free parameters. The results are summarized in Figure 6. The agreement with the X-ray observation is remarkable and reassuring, and we conclude that the present data provide the strongest and most convincing case for the detection of the submm SZ signal from the cluster. Detailed analysis taking account of various astrophysical effects and the cosmological implications will be presented elsewhere (Komatsu et al. 1999a,b).
5 DISCUSSION AND CONCLUSIONS
It is widely recognized now that many cosmological models are more or less successful in reproducing the structure at redshift by construction. This is because the models have still several degrees of freedom or cosmological parameters which can be appropriately adjusted to the observations at (, , , , ). There are several ways to break such cosmological degeneracy. For instance, combining the COBE 4 year data with the cluster Log – Log observation, we showed that low-density CDM models with and are viable models, while the Einstein – de Sitter model is strongly disfavored even if equation (5) can be satisfied by adjusting accordingly.
Along with such consideration, we proposed a cluster survey based on the SZ effect. As a first step toward the goal, we conducted the search for the SZ effect towards the cluster RXJ1347-1145 in multi-bands. We detected the extended signal which are in good agreement with the predicted SZ profiles, especially at 21 and 350 GHz. In particular, our results provide the strongest and most convincing case for the detection of the SZ temperature increment in the submm band in which the profile of a cluster of galaxies is resolved for the first time.
We thank Iain Coulson, Nario Kuno and Satoki Matsushita for kind assistance during our observing runs at JCMT, Nobeyama 45-m and Nobeyama Millimeter Array, respectively. We also thank Nick Tothill for providing the calibration data for our observation, and Tim Jenness, John Richer, Remo Tilanus and Goeran Sandell for many fruitful comments and suggestions on data analysis via the SCUBADR mailing list. We are also grateful to John Carlstrom for information of the flux of the central source at 28.5 GHz. The travel of E. K. to Hawaii was supported in part by Satio Hayakawa Foundation in the Astronomical Society of Japan. T. K. gratefully acknowledges support from a JSPS (Japan Society for the Promotion of Science) fellowship. This research was supported in part by the Grants-in-Aid for the Center-of-Excellence (COE) Research of the Ministry of Education, Science, Sports and Culture of Japan to RESCEU (No.07CE2002).
REFERENCES
-
Andreani, P., et al. Astrophys.J., 459, L49 (1996)
-
Bryan, G. L., Norman, M. L. Astrophys.J., 495, 80 (1998)
-
Bunn, E. F., White, M. Astrophys.J., 480, 6 (1997)
-
Cagnoni, I., Della Ceca, R., Maccacaro, T. Astrophys.J., 493, 54 (1998)
-
Condon, J. J. et al. Astron. J., 115, 1693 (1998)
-
Ebeling, H., Edge, A. C., Fabian, A.C., Allen, S. W., Crawford, C. S. Astrophys. J., 479, L101 (1997)
-
Ebeling H., et al. Mon.Not.R.Astron.Soc., submitted (1998)
-
Eckart, A., Hummel, C. A., Witzel, A. Mon. Not. R. Astron. Soc., 239, 381 (1989).
-
David, L. P., Slyz, A., Jones, C., Forman, W., Vrtilek, S. D. Astrophys. J., 412, 479 (1993)
-
Kitayama, T., Sasaki, S., Suto, Y. Publ. Astron. Soc. Japan, 50, 1 (1998)
-
Kitayama, T., Suto, Y. Mon.Not.R.Astron.Soc., 280, 638 (1996a)
-
Kitayama, T., Suto, Y., Astrophys.J., 469, 480 (1996b).
-
Kitayama, T., Suto, Y., Astrophys.J., 490, 557 (1997).
-
Komatsu, E., Kitayama, T., Suto, Y., Hattori, M., Kawabe, R., Matsuo, H., Schindler, S., Yoshikawa, K., Astrophys.J., in press (1999a)
-
Komatsu, E., et al., in preparation (1999b)
-
Lacey, C. G., Cole, S. Mon.Not.R.Astron.Soc., 262, 627 (1993)
-
Lamarre, J. M., et al. Astrophys. J. 507, L5 (1998)
-
Mushotzky, R. F., Scharf, C. A. Astrophys.J., 482, L13 (1997)
-
Piccinotti, G., Mushotzky, R. F., Boldt, E. A., Holt, S. S., Marshall, F. E., Serlemitsos, P. J., Shafer, R. A. Astrophys.J., 253, 485 (1982)
-
Press, W. H., Schechter, P. Astrophys.J., 187, 425 (1974)
-
Rephaeli, Y. ARA&A 33, 541 (1995)
-
Rephaeli, Y., Yankovitch, D. Astrophys.J., 481, L55 (1997)
-
Rosati, P., Della Ceca, R., Burg R., Norman, C., & Giacconi, R. Astrophys.J., 445, L11 (1995)
-
Rosati, P., Della Ceca, R., Norman, C., Giacconi, R. Astrophys. J., 492, L21 (1998)
-
Sasaki, S. Publ. Astron. Soc. Japan, 46, 427 (1994)
-
Schindler, S., Hattori, M., Neumann, D. M. Böhringer, H. Astron. Astrophys., 317, 646 (1997)
-
Sunyaev R.A., Zel’dovich Ya.B. Commts. Astrophys. Space Phys., 4, 173 (1972)
-
Ueda, Y., Takahashi, T., Inoue, H., Tsuru, T., Sakano, M., Ishisaki, Y., Ogasaka, Y., Makishima, K., Yamada, T., Ohta, K., Akiyama, M. Nature, 391, 866 (1998)