Giant radio sources
Abstract
We present multi-frequency VLA observations of two giant quasars, 0437244 and 1025229, from the Molonglo Complete Sample. These sources have well-defined FRII radio structure, possible one-sided jets, no significant depolarization between 1365 and 4935 MHz and low rotation measure ( RM 20 rad m-2). The giant sources are defined to be those whose overall projected size is 1 Mpc. We have compiled a sample of about 50 known giant radio sources from the literature, and have compared some of their properties with a complete sample of 3CR radio sources of smaller sizes to investigate the evolution of giant sources, and test their consistency with the unified scheme for radio galaxies and quasars. We find an inverse correlation between the degree of core prominence and total radio luminosity, and show that the giant radio sources have similar core strengths to the smaller sources of similar total luminosity. Hence their large sizes are unlikely to be due to stronger nuclear activity. The degree of collinearity of the giant sources is also similar to the sample of smaller sources. The luminosity-size diagram shows that the giant sources are less luminous than our sample of smaller-sized 3CR sources, consistent with evolutionary scenarios where the giants have evolved from the smaller sources losing energy as they expand to these large dimensions. For the smaller sources, radiative losses due to synchrotron radiation is more significant while for the giant sources the equipartition magnetic fields are smaller and inverse Compton losses with the microwave background radiation is the dominant process. The radio properties of the giant radio galaxies and quasars are consistent with the unified scheme.
keywords:
galaxies: active - galaxies: nuclei - galaxies: jets - quasars: general - radio continuum: galaxies - polarization1 Introduction
Giant radio sources (GRSs), defined to be those with a projected linear size 1 Mpc (q∘=0.5 and H∘=50 km s-1 Mpc-1), are the largest single objects in the Universe, and are extremely useful for studying a number of astrophysical problems. These range from understanding the evolution of radio sources, constraining orientation-dependent unified schemes to probing the intergalactic medium at different redshifts (e.g. Saripalli 1988; Subrahmanyan & Saripalli 1993, Subrahmanyan, Saripalli & Hunstead 1996; Mack et al. 1998; Schoenmakers et al. 1998a). There are about 50 known giant sources, only 5 of which are quasars, the largest being the radio galaxy 3C236 with a projected linear size of 5.7 Mpc (Willis, Strom & Wilson 1974; Strom & Willis 1980; Barthel et al. 1985). In the complete sample of 3CR radio sources (Laing, Riley & Longair 1983), about 6 per cent of the radio sources are giants. The GRSs are usually of low radio luminosity with values often in the transition region between the FRI and FRII type sources (Fanaroff & Riley 1974), and are believed to be advancing outwards through the low-density (10 cm-3) intergalactic medium. Their spectral ages have been estimated to be about 107 to 108 yr (e.g. Mack et al. 1998), but these values are dependent on a number of assumptions and have to be treated with caution (e.g. Eilek, Melrose & Walker 1997).
In this paper we report further observations of two giant quasars (GQs), 0437244 and 1025229, which we had earlier observed as part of our study of the depolarization properties of a well-defined sample of radio sources selected from the Molonglo Complete sample (Ishwara-Chandra et al. 1998, hereinafter referred to as IC98, and references therein). The quasar 0437244 at a redshift of 0.84 is at present the highest redshift giant quasar known. The paper is organized as follows. In Section 2, observations of the two giant quasars from the Molonglo Sample are presented. In Section 3, we list some of the properties of known giant radio galaxies and quasars, and discuss their consistency with proposed evolutionary scenarios for these objects. In Section 4, we examine the consistency of the giant sources with the unified schemes for radio sources, and possible effects of the environment. The conclusions are summarized in Section 5.
2 Giant quasars from the Molonglo sample
In this section we present the observations and observational results of the two giant quasars 0437244 and 1025229 from the Molonglo complete sample. The GQ 0437244 has an angular size of 128′′ which corresponds to a projected linear size of 1.06 Mpc at a redshift of 0.84. This is presently the highest redshift GQ; the only other known GQ with a redshift greater than 0.5 is 1127300 (Bhatnagar, Gopal-Krishna & Wisotzki 1998) which is at a redshift of 0.6337. The second GQ 1025229 is relatively nearby at a redshift of 0.309, and has an angular size of 198′′, which corresponds to a linear size of 1.11 Mpc. The luminosities at 1.4 GHz are 2.88 and 3.47 W Hz-1 for 0437244 and 1025229 respectively.
2.1 Observations and analyses
The sources were observed in the L, C, X and U bands with the Very Large Array (VLA) and the observing log is summarized in Table 1. The observations in the L, C and U bands were scaled-array ones, while those in the X-band were with a higher resolution. The L- and C-band total-intensity and linear-polarization images have been reported earlier by IC98. However, the spectral index and rotation measure estimates based on these images are presented here. All the data were calibrated in the standard way using the NRAO AIPS package. The final images in the L, C and U bands were restored with a beam of 4.5 along PA = for 0437244, and 8.0 along PA for 1025229. The restoring beam for the BnA-array observations at the X-band are 1.89 along PA for 0437244, and 0.80 along PA for 1025229. The images at the X and U bands have been corrected for primary beam attenuation. The U-band images have not been self-calibrated because they have low signal to noise ratio.
| Array | Obs. | Obs. | Band- | Date of obs. |
|---|---|---|---|---|
| Conf. | band | Freq. | width | |
| MHz | MHz | |||
| BnA | L | 1365 | 50 | 1995 Sep 20 |
| L | 1665 | 25 | ||
| CnB | C | 4635 | 50 | 1996 Jan 20,31 |
| C | 4935 | 50 | ||
| DnC | U | 14965 | 50 | 1997 Oct 3, 12 |
| BnA | X | 8447 | 25 | 1997 Feb 3 |
2.2 Observational results
2.2.1 0437244
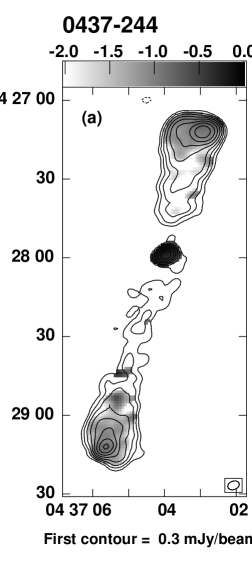
In Figure 1a we present the total-intensity image at 1365 MHz with the spectral index between 1365 and 4935 MHz superimposed in grey. The scaled-array 15 GHz image, and the high-resolution 8.4 GHz image are presented in Figures 1b and 1c respectively.


| Source | Freq | rms | Comp | Peak | Int. | |
| Name | noise | |||||
| 0437244 | 1365 | 100 | N Lobe | 66.2 | 281.2 | 8.0 |
| S Lobe | 44.1 | 165.6 | 12.2 | |||
| Core | 16.9 | 18.2 | ||||
| Total | 471 | |||||
| 1665 | 150 | N Lobe | 53.4 | 198.8 | 7.7 | |
| S Lobe | 35.8 | 106.7 | 9.2 | |||
| Core | 15.2 | 16.0 | ||||
| Total | 321 | |||||
| 4635 | 55 | N Lobe | 22.2 | 74.5 | 8.2 | |
| S Lobe | 15.9 | 42.5 | 10.3 | |||
| Core | 12.9 | 13.6 | ||||
| Total | 130 | |||||
| 4935 | 55 | N Lobe | 20.3 | 66.6 | 7.8 | |
| S Lobe | 14.8 | 38.7 | 6.7 | |||
| Core | 12.5 | 13.0 | ||||
| Total | 121 | |||||
| 8450 | 45 | N Lobe | 2.2 | 19.2 | ||
| S Lobe | 5.7 | 17.0 | ||||
| Core | 10.5 | 11.6 | ||||
| Total | 46.6 | |||||
| 14965 | 170 | N Lobe | 4.2 | 15.1 | ||
| S Lobe | 2.8 | 6.63 | ||||
| Core | 2.7 | 4.91 | ||||
| Total | 30.9 | |||||
| 1025229 | 1365 | 165 | N Lobe | 78.6 | 286.5 | 9.0 |
| S Lobe | 18.4 | 211.1 | 10.7 | |||
| Core | 13.5 | 21.8 | ||||
| Total | 560 | |||||
| 1665 | 150 | N Lobe | 64.3 | 214.5 | 8.8 | |
| S Lobe | 16.6 | 155.1 | 10.5 | |||
| Core | 11.0 | 16.91 | ||||
| Total | 421 | |||||
| 4635 | 65 | N Lobe | 28.2 | 66.9 | 7.1 | |
| S Lobe | 6.5 | 39.2 | 10.2 | |||
| Core | 10.1 | 11.2 | ||||
| Total | 128 | |||||
| 4935 | 70 | N Lobe | 26.1 | 59.8 | 8.5 | |
| S Lobe | 6.0 | 39.2 | 8.5 | |||
| Core | 10.2 | 11.2 | ||||
| Total | 118 | |||||
| 8450 | 45 | N Lobe | 3.2 | 15.9 | ||
| S Lobe | 0.8 | 1.95 | ||||
| Core | 10.0 | 11.03 | ||||
| Total | 40 | |||||
| 14965 | 230 | N Lobe | 3.8 | 8.23 | ||
| S Lobe | 3.8 | 17.8 | ||||
| Core | 8.7 | 10.0 | ||||
| Total | 36 |
Note: Frequency is expressed in MHz, rms in units of Jy/beam, peak flux densities are in units of mJy/beam, integrated flux density is in mJy and , is the scalar percentage polarization.
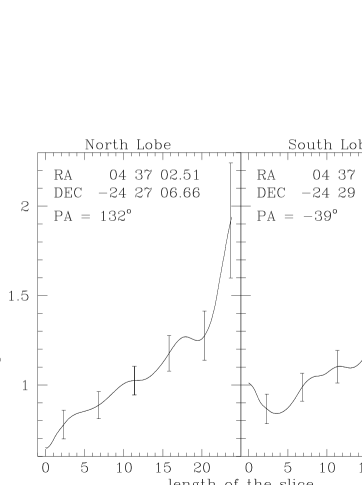
The GQ 0437244 is a classical double-lobed FRII radio source with well-defined hotspots at the outer edges, a core contributing about 10 per cent of the total flux density at an emitted frequency of 8 GHz, and signs of a possible jet towards the southern component. The spectral indices, (defined as S ), at the peaks of emission in the outer lobes are about 0.6 and 0.9 for the northern and southern components respectively. In both components the spectral indices steepen significantly up to distances of about 20 arc sec (about 170 kpc) from the peaks of emission (Figure 2). The errors in the spectral indices have been estimated assuming an error of 3 per cent in the measured flux density. Adopting the formalism of Myers & Spangler (1985), the age estimates due to synchrotron radiative losses in the Kardashev-Pacholczyk model (Pacholczyk 1977) are 5.8 and 2.7 yr for the northern and southern lobes respectively. The injection spectra have been estimated from the spectral indices of the hotspots, which have been defined to be the peaks of emission in the outer lobes. The integrated spectra of the northern and southern lobes are straight between 1.4 and 15 GHz with spectral indices of 1.160.07 and 1.100.09 respectively since these are dominated by the hotspots. The core has a flat spectrum between 1.4 and 8.4 GHz with a spectral index of 0.230.10 but shows evidence of steepening between 8.4 and 15 GHz, with a spectral index of 1.500.24. Such a steep spectral index is uncommon; this is the only quasar in our sample of Molonglo radio sources (cf. IC98) with a core spectral index between 8.4 and 15 GHz which is steeper than about 0.5. The steep core spectrum is possibly due to variability of the core flux density. The integrated spectrum of the entire source between 408 MHz and 15 GHz is 0.940.05.


We have computed the rotation measures for both lobes of the giant quasars using two widely spaced L band (1365 MHz and 1665 MHz) and the C band (4935 MHz) frequencies. For 0437244, the northern lobe has an integrated RM of about 13.61.3 rad m-2, while for the southern lobe the RM is about 4.23.4 rad m-2. The depolarization parameter, defined to be the ratio of the degree of polarization at 1365 MHz to that at 4935 MHz is close to about 1, indicating that there is no significant depolarization till about 1365 MHz (cf. IC98).
2.2.2 1025229
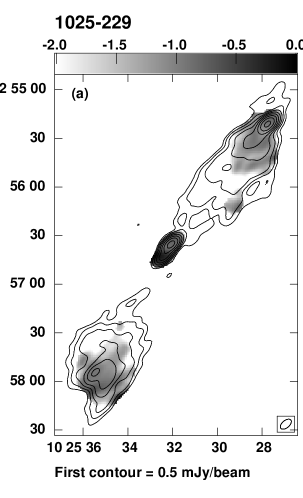
This is also a well-defined FRII radio source with two hotspots in the southern lobe, a core contributing about 12 per cent of the total flux density of the source, and a jet-like structure close to the radio core (Figures 3a-d). The high-resolution 8.4 GHz image of the core region resolves the core and the jet-like structure; the latter consists of two components along a PA of . This is significantly different from the PA of defined by the core and the northern hotspot (Figures 3c and d). A deep optical image might help clarify whether this feature is an unrelated source. However, the similarity in RM of the jet-like feature and the lobes, which are listed later in this section, suggests that these might be related. The spectral index slices for the two lobes are presented in Figure 4. The spectral index of the northern hotspot is about 0.9 and steepens to about 1.5 over a distance of 40′′ (about 220 kpc), while for the southern lobe both the peaks of emission have a spectral index of 0.6 which steepens to about 1.7 over a distance of about 40′′. Adopting the formalism of Myers & Spangler (1985), the age estimates due to synchrotron radiative losses in the Kardashev-Pacholczyk model (Pacholczyk 1977) are 7.8 and 1.2 yr for the northern and southern lobes respectively. The injection spectra have again been estimated from the hotspot spectral indices. Estimating the ages for a subset of 10 sources chosen at random from our Molonglo sample (IC98) yields ages in the range of 0.6 yr with a median value of about 2.3 yr. The integrated spectral index of the northern and southern lobes between 1365 MHz and 15 GHz are 1.310.09 and 1.080.06 respectively. The spectral index of the entire source is 0.900.04 between 408 MHz and 15 GHz, while that of the core is 0.260.10 between 1.665 and 15 GHz. The depolarization parameter between 1365 and 4935 MHz is again close to about 1, while the rotation measures estimated from the two L-band (1365 MHz and 1665 MHz) and C-band data are 21.32.3, 15.30.9 and 21.53.6 rad m-2 for the northern and southern lobes and the steep-spectrum jet-like feature close to the radio core.

3 The sample of giant radio sources
To understand the evolution of GRSs, examine their consistency with the unified schemes and use them as probes of their environment and the intergalactic medium, we have compiled a sample of known giant radio sources from the literature. A GRS is defined to be one with an overall projected linear size 1 Mpc. Our sample of known GRSs consists of 53 sources, 48 of which are associated with galaxies and the remaining 5 with quasars. These are listed in Table 3, which is arranged as follows. Columns 1 and 2: source name and an alternative name. Most sources have peaks of emission in the outer parts of the lobes and either belong to FRII or are in FRI/FRII transition region. Those with a clear FRI structure such as in 3C129 and 3C130 are marked with an asterisk in column 1. Column 3: optical identification where G and Q denote galaxy and quasar respectively; column 4: redshift; columns 5 and 6: the largest angular size in arcsec and the corresponding projected linear size in Mpc; column 7: the luminosity at 1.4 GHz in units of W Hz-1; column 8: the fraction of emission from the core, fc, at an emitted frequency of 8 GHz, with a sign indicating those sources whose core flux density has been estimated by us from the available images; columns 9 and 10: the minimum energy density, umin, in units of 10-14 J m-3 and the equipartition magnetic field, Beq, in nT (1T = 104 G); column 11: the ratio, rθ defined to be 1, of the separation of the oppositely directed components from the nucleus; column 12: the misalignment angle, , defined to be the supplement of the angle formed at the nucleus by the outer hotspots; column 13: references for the radio structure. The minimum energy density and equipartition magnetic field have been estimated (Miley 1980; Longair 1994) for the extended emission assuming a cylindrical geometry, a filling factor of unity and that energy is distributed equally between relativistic electrons and protons. The size of the lobes has been estimated from the lowest contours in the available images, and the core flux density has been subtracted while estimating the minimum energy density. In the case of a few sources, such as the 7C ones, for which reliable lobe sizes could not be obtained, umin and Beq have not been listed in the Table. The luminosity has been estimated between 10 MHz and 10 GHz using the known spectral indices of the extended emission. For estimating the error in umin we have assumed errors of 5 per cent in the flux density, 0.1 in spectral index and 25 per cent in the volume.
| Source | Other | Id | z | LAS | LLS | P1.4 | fc | umin | Beq | Ref | ||
| Name | Name | ′′ | Mpc | WHz-1 | Jm-3 | nT | ∘ | |||||
| 0017205 | MRC | G | 0.197 | 372 | 1.55 | 26.20 | 0.063 | 1.41 | 3 | 1 | ||
| 0055300 | NGC315 | G | 0.0167 | 3480 | 1.64 | 24.82 | 0.32 | 1.94 | 0.137 | 2.04 | 9 | 2,3 |
| 0109492 | 3C35 | G | 0.067 | 635 | 1.10 | 25.64 | 0.035 | 2.46 | 0.154 | 1.06 | 5 | 4 |
| 0114476 | PKS | G | 0.146 | 702 | 2.35 | 26.51 | 0.012 | 4.25 | 0.202 | 1.39 | 18 | 5 |
| 0132376 | 3C46 | G | 0.4373 | 163 | 1.09 | 27.21 | 0.0078 | 38.74 | 0.611 | 1.56 | 7 | 6 |
| 0136397 | 4C39.04 | G | 0.2107 | 343 | 1.50 | 26.30 | 0.016 | 4.49 | 0.208 | 1.19 | 2 | 7,8 |
| 0157405 | 4C40.08 | G | 0.078 | 840 | 1.67 | 25.62 | 0.018 | 0.99 | 0.098 | 2.54 | 0 | 8,9 |
| 0211479 | PKS | G | 0.2195 | 378 | 1.70 | 26.54 | 0.0069 | 6.68 | 0.254 | 1.15 | 1 | 5 |
| 0309411 | B3 | G | 0.136 | 570 | 1.80 | 26.01 | 0.54 | 0.97 | 0.097 | 1.67 | 14 | 10 |
| 0313683 | WENSS | G | 0.0902 | 894 | 2.01 | 25.64 | 0.19 | 4.46 | 0.207 | 1.45 | 6 | 11 |
| 0313271 | MRC | G | 0.216 | 227 | 1.01 | 26.06 | 0.011 | 3.31 | 0.179 | 1.25 | 10 | 1 |
| 0319454 | PKS | G | 0.0633 | 1538 | 2.54 | 25.81 | 0.023 | 1.57 | 0.123 | 2.22 | 1 | 12 |
| 0424728 | PKS | G | 0.1921 | 346 | 1.42 | 26.51 | 0.039 | 12.41 | 0.346 | 1.09 | 6 | 5 |
| 0437244 | MRC | Q | 0.84 | 128 | 1.06 | 27.46 | 0.10 | 47.50 | 0.677 | 1.54 | 0 | 13 |
| 0445449∗ | 3C129 | G | 0.021 | 1800 | 1.06 | 25.21 | 0.023 | 6.53 | 0.251 | 4 | ||
| 0448519∗ | 3C130 | G | 0.109 | 584 | 1.54 | 26.29 | 0.043 | 5.22 | 0.224 | 4 | ||
| 0503286 | MRC | G | 0.038 | 2400 | 2.48 | 25.26 | 0.029 | 1.28 | 0.111 | 1.89 | 14 | 14,15 |
| 0511305 | PMN | G | 0.0583 | 684 | 1.05 | 25.70 | 0.017 | 3.93 | 0.195 | 1.88 | 18 | 5 |
| 0634205 | PMN | G | 0.056 | 810 | 1.20 | 26.07 | 0.021 | 7.17 | 0.263 | 1.32 | 2 | 16,17 |
| 0654482 | 7C | G | 0.776 | 135 | 1.10 | 26.69 | 18 | |||||
| 0707359 | PKS | G | 0.2182 | 492 | 2.21 | 26.71 | 0.10 | 8.03 | 0.278 | 1.44 | 7 | 5 |
| 0744558 | DA240 | G | 0.0356 | 2040 | 1.99 | 25.50 | 0.077 | 0.61 | 0.077 | 1.39 | 2 | 19,20 |
| 0821695 | 8C | G | 0.538 | 402 | 2.94 | 26.29 | 0.22 | 3.23 | 0.177 | 1.12 | 1 | 21 |
| 0915320∗ | B2 | G | 0.062 | 660 | 1.07 | 24.69 | 0.14 | 2.12 | 0.143 | 22 | ||
| 0945734 | 4C73.08 | G | 0.0581 | 884 | 1.35 | 25.77 | 0.024 | 1.68 | 0.127 | 1.70 | 6 | 4 |
| 1003351 | 3C236 | G | 0.0988 | 2340 | 5.70 | 26.41 | 0.46 | 1.32 | 0.113 | 1.68 | 2 | 19,23,24 |
| 1025229 | MRC | Q | 0.309 | 198 | 1.11 | 26.54 | 0.12 | 16.73 | 0.402 | 1.25 | 8 | 13 |
| 1029571∗ | HB13 | G | 0.034 | 1110 | 1.03 | 24.50 | 0.19 | 4.30 | 0.204 | 25 | ||
| 1058368 | 7C | G | 0.75 | 158 | 1.22 | 26.86 | 18 | |||||
| 1127130 | PKS | Q | 0.6337 | 297 | 2.30 | 27.53 | 0.087 | 6.93 | 0.259 | 1.21 | 0 | 26 |
| 1144352 | WENSS | G | 0.063 | 701 | 1.15 | 25.09 | 0.95 | 1.18 | 0.107 | 1.20 | 10 | 27 |
| 1158351 | 87GB | G | 0.55 | 140 | 1.03 | 26.79 | 0.015 | 33.22 | 0.566 | 1.24 | 5 | 28 |
| 1209745 | 4C74.17 | G | 0.107 | 420 | 1.09 | 25.52 | 0.089 | 2.59 | 0.158 | 1.55 | 18 | 29 |
| 1218639 | TXS | G | 0.2 | 420 | 1.77 | 26.69 | 30 | |||||
| 1232216 | 3C274.1 | G | 0.422 | 152 | 1.00 | 27.32 | 0.031 | 47.53 | 0.677 | 1.21 | 6 | 31 |
| 1312698 | DA340 | G | 0.106 | 420 | 1.09 | 25.93 | 30 | |||||
| 1331099 | PKS | G | 0.081 | 820 | 1.68 | 26.06 | 0.11 | 4.84 | 0.216 | 1.09 | 3 | 32 |
| 1349647 | 3C292 | G | 0.71 | 133 | 1.06 | 28.09 | 0.0013 | 162.53 | 1.252 | 1.12 | 3 | 31 |
| 1358305 | B2 | G | 0.206 | 649 | 2.80 | 26.03 | 0.011 | 1.17 | 0.106 | 2.13 | 5 | 33 |
| 1452517 | MRC | G | 0.08 | 1218 | 2.48 | 25.66 | 0.35 | 1.10 | 0.103 | 1.60 | 12 | 8,34 |
| 1519513 | 87GB | G | 0.37 | 258 | 1.59 | 27.06 | 0.017 | 18.20 | 0.419 | 1.08 | 0 | 28 |
| 1545321 | PKS | G | 0.1085 | 498 | 1.31 | 26.03 | 0.032 | 12.29 | 0.344 | 1.02 | 4 | 5 |
| 1549202 | 3C326 | G | 0.0895 | 1173 | 2.63 | 26.15 | 0.012 | 2.00 | 0.139 | 1.95 | 3 | 35 |
| 1602376 | 7C | G | 0.814 | 175 | 1.44 | 26.93 | 18 | |||||
| 1626518 | WENSS | G | 0.056 | 1140 | 1.68 | 25.10 | 0.14 | 1.44 | 5 | 36 | ||
| 1636418 | 7C | G | 0.867 | 130 | 1.09 | 26.67 | 18 | |||||
| 1637826 | NGC6251 | G | 0.023 | 3120 | 2.00 | 24.66 | 0.75 | 0.38 | 0.061 | 1.71 | 26 | 37,38 |
| 1701423 | 7C | G | 0.476 | 180 | 1.24 | 26.47 | 18 | |||||
| 1721343 | 4C34.47 | Q | 0.2055 | 244 | 1.05 | 26.51 | 0.60 | 8.02 | 0.278 | 1.05 | 1 | 39,40 |
| 1834620 | WENSS | G | 0.519 | 197 | 1.42 | 27.19 | 20.85 | 0.449 | 1.03 | 0 | 41 | |
| 1910800 | PKS | G | 0.346 | 366 | 2.18 | 26.79 | 0.059 | 10.16 | 0.313 | 1.06 | 0 | 5 |
| 2043749 | 4C74.26 | Q | 0.104 | 610 | 1.55 | 26.03 | 0.51 | 3.02 | 0.171 | 1.04 | 7 | 42 |
| 2309184 | 3C457 | G | 0.427 | 205 | 1.36 | 27.38 | 0.013 | 32.96 | 0.564 | 1.00 | 6 | 43 |
References: 1. Kapahi et al. 1998b; 2. Bridle et al. 1976; 3. Willis et al. 1981; 4. Jägers 1986; 5. Subrahmanyan, Saripalli & Hunstead 1996; 6. Gregorini et al. 1988; 7. Hine 1979; 8. Saripalli 1988; 9. Vigotti et al. 1989 ; 10. de Bruyn 1989; 11. Schoenmakers et al. 1998a; 12. Saripalli, Subrahmanyan & Hunstead 1994; 13. Present work; 14. Saripalli et al. 1986; 15. Subrahmanya & Hunstead 1986; 16. Danziger, Goss & Frater 1978; 17. Kronberg, Wielebinski & Graham 1986; 18. Cotter, Rawlings & Saunders 1996; 19. Willis, Strom & Wilson 1974; 20. Strom, Baker & Willis 1981; 21. Lacy et al. 1993; 22. Ekers et al. 1981; 23. Strom & Willis 1980; 24. Barthel et al. 1985; 25. Masson 1979; 26. Bhatnagar, Gopal-Krishna & Wisotzki 1998; 27. Schoenmakers et al. 1998b; 28. Machalski & Condon, 1985; 29. van Breugel & Willis 1981; 30. Saunders, Baldwin & Warner 1987; 31. Alexander & Leahy 1987; 32. Saripalli et al. 1996; 33. Parma et al 1996; 34. Jones & McAdam 1992; 35. Willis & Strom 1978; 36. Röttgering et al. 1996; 37. Waggett, Warner & Baldwin 1977; 38. Willis et al. 1982 ; 39. Jägers et al. 1982; 40. Barthel 1987; 41. de Bruyn et al. 1998; 42. Riley et al 1989; 43. Leahy & Perley 1991.


3.1 Energy density and magnetic field
The minimum energy density is in the range of 0.4 to 162 10-14 J m-3 with a median value of about 4.4 10-14 J m-3, while the equipartition magnetic field for the lobes range from 0.06 to 1.25 nT with a median value of 0.2 nT. The minimum energy density might be expected to increase with redshift due to better confinement by the intergalactic medium, and greater dissipation of energy by the beams interacting with a denser environment. An earlier study by Subrahmanyan & Saripalli (1993) showed marginal evidence of an increase in minimum energy density or pressure with redshift. However, it is important to confirm whether such trends might be due to possible selection effects. For example, if the giant sources are chosen from a given flux-density limited sample, luminosity and minimum energy density could be strongly correlated with redshift since most sources are close to the flux density limit of the survey. Although the giant radio sources in our sample have been selected from surveys ranging from the 3CR to WENSS (Laing, Riley & Longair 1983; Rengelink et al. 1997), the observed range in flux density at say 1.4 GHz for almost all the objects for which we have been able to evaluate umin are within one order of magnitude, while the luminosity spans about 3 orders of magnitude. Thus although the luminosity and minimum energy density appear correlated with redshift (Figures 5a and b) with Spearman rank correlation co-efficients of 0.90 and 0.68 respectively, we need to identify a large number of giant sources from surveys such as WENSS and NVSS to determine whether there is a genuine trend for the minimum energy density to increase with redshift.

3.2 Evolution of giant radio sources
We investigate the evolution of the giant radio sources by plotting them in a power-linear size or P-D diagram along with the complete sample of 3CR (Laing et al. 1983) radio sources. The P-D diagram is, in principle, a powerful tool for investigating the temporal evolution of radio sources (Shklovskii 1963; Scheuer 1974), although in practice the detailed interpretation is debatable (cf. Baldwin 1982; Kaiser, Dennett-Thorpe & Alexander 1997; Blundell et al. 1999). One must also be careful of possible selection effects since large sources with weak lobes or cocoons may sometimes appear to be disconnected and hence misclassified as independent sources. Also, weak FRI sources with diffuse extended lobes may have only the bright inner parts detected at large redshifts and hence appear smaller in size (cf. Neeser et al. 1995). However, all but 4 of the GRSs are clear FRIIs or are in the FRI/II transition region and have well-defined peaks of emission towards their outer edges. Hence their parameters are unlikely to be affected by such selection effects. The P-D diagram for the complete sample of 3CR radio sources with sizes between 50 kpc and 1 Mpc, and all the giant sources (Figure 6) show that there is a clear deficit of giant sources (1 Mpc) with high radio luminosity, suggesting that the luminosity of radio sources decrease as they evolve. This trend was suggested earlier (Baldwin 1982; Cotter et al. 1996, Kaiser & Alexander 1997; Kaiser et al. 1997) using small samples of giant sources, and has now been established with a sample of over 50 giant radio sources. Our sample of 53 giant sources includes all those from a complete sample of sources selected from the Molonglo Reference Catalogue or MRC (Large et al. 1981; Kapahi et al. 1998a,b and references therein), and early results from the WENSS survey in addition to the searches for giants undertaken by Cotter et al. (1996) from the 7C survey and Subrahmanyan et al. (1996) from the MRC. Given the range of surveys and the systematic searches for giant sources, the dearth of giant objects with high radio luminosity is unlikely to be due to any selection effects. There is also a sharp cutoff in the sizes of the GRSs at about 3 Mpc, with only one exception, namely 3C236, which has a size of 5.7 Mpc. To investigate whether there are larger sources which may have been missed, one requires low-frequency surveys with higher sensitivity to diffuse, low-brightness emission. In Figure 6, we superimpose the evolutionary tracks suggested by Kaiser et al. (1997) for three different jet powers and find that our sample of giant sources is roughly consistent with their self-similar models where the lobes lose energy due to expansion and radiative losses due to both inverse-Compton and synchrotron processes. In the models developed by Blundell et al. (1999), the luminosity declines more rapidly than the Kaiser et al. tracks, and provides a somewhat better fit to the upper envelope for large linear sizes. The P-D diagram along with these evolutionary models suggest that the progenitors of the giants are normal FRII or FRI radio sources, depending on their jet power, and the giant sources do not represent objects with unusually large nuclear engines or increased activity in the nucleus.


3.3 Radiation losses in giant sources
In this section we investigate the relative importance of synchrotron and inverse-Compton losses in the evolution of giant radio sources. The equipartition magnetic field of the lobes for almost all the giant sources are less than the equivalent magnetic field of the microwave background radiation, suggesting that inverse-Compton losses are larger than the synchrotron radiative losses in the evolution of the lobes of these giant sources. For comparison, we have computed the equipartition magnetic field for all the sources, except 3C293 & 3C321, which are in the 3CR complete sample and have been observed by Leahy & Williams (1984), Leahy, Muxlow & Stephens (1989), Leahy & Perley (1991), Fernini et al. (1993), Johnson, Leahy & Garrington (1995), Fernini, Burns & Perley (1997) and Hardcastle et al. (1997), and also the corresponding inverse Compton field, Bic=0.32(1 + z)2 nT, at the redshift of the source. The above two sources were excluded because their bridges have not been well-mapped. A plot of the linear size of the radio source against the ratio of inverse Compton field to equipartition magnetic field (Figure 7a) shows that synchrotron losses dominate over inverse Compton losses for almost all objects below about a Mpc while the reverse is true for the giant sources. This is also illustrated in Figure 7b where we plot the linear size against the ratio, B/(B + B), which represents the ratio of the energy loss by synchrotron radiation to total energy loss due to both the processes. The ratio is close to about 1 for the small sources, lies between about 0.5 and 1 for sources less than a Mpc, and falls sharply for the giant sources to a value of about 0.05. This is consistent with similar suggestions made earlier by Gopal-Krishna, Wiita & Saripalli (1989). Since the sample of giant radio sources has been compiled from a large number of surveys complete to different flux density limits, we have checked and confirmed these trends by considering 3CR and giant sources over a similar luminosity range of 1025 to W Hz-1. This range was chosen to maximize the number of 3CR and giant radio sources in a similar luminosity range. It is also relevant to note here that de Ruiter et al. (1990) reported a strong trend for decreasing internal energy density with size, even after taking into account the correlation of size and radio power in their sample. The energy density of microwave background radiation increases steeply with redshift, and it is relevant to enquire whether our trends might be due to a higher redshift for the giant sources. The median redshift for the GRSs is about 0.15, while for the comparison sample it is about 0.26 showing that the importance of inverse-Compton losses for the giant sources is not due to higher redshifts for these objects. However, this illustrates that inverse-Compton losses are likely to severely constrain the number of GRSs at high redshifts since the microwave background energy density increases as .
The rate of energy loss by the electrons due to both inverse Compton and synchrotron processes, proportional to (B + B), is plotted against the overall linear size for the GRSs and the comparison sample in Figure 7c. For the smaller sources where synchrotron losses dominate, the rate of energy loss decreases with linear size and tapers to a minimum value of about 0.10 for the GRSs which is set by the equivalent magnetic field of the microwave background radiation. The lifetime of a relativistic electron at an observed frequency, , due to both synchrotron and inverse-Compton losses is given by
where is in MHz and the magnetic fields Bic and Beq are in units of 10-10 T. For sources of 2 Mpc, the ratio is about 3 (cf. Figure 7a). For the median redshift of the giant galaxies (z 0.1), the lifetime of the radiating electron is yr at 327 MHz. The time scale for transport of energy from the nucleus is about 7 yr for a speed of 0.1c. Thus the source is likely to be visible well after the supply of energy to the outer lobes has ceased. These sources would be more easily detectable at low radio frequencies, and systematic searches for GRSs 3 Mpc using telescopes such as the GMRT would help clarify the late stages of their evolution.

4 Constraints on orientation and environment
To examine further whether the giant radio sources might evolve to large sizes because of a powerful nuclear engine, we investigate the relative strength of the cores as an indicator of nuclear activity. Although the degree of core prominence may vary over the lifetime of the radio source, it might be possible to arrive at statistically meaningful results. However, one must also bear in mind that in the unified schemes the strength of the core is a statistical indicator of orientation of the source axis to the line of sight. Here, the sources at small angles to the line of sight have prominent cores compared to those at large angles due to the effects of relativistic beaming (cf. Blandford & Königl 1979). In the unified schemes, the radio galaxies and quasars are believed to be intrinsically similar objects, but appearing to be different because of their different angles of inclination to the line of sight with the quasars being seen at small angles while the radio galaxies lie close to the plane of the sky (Scheuer 1987; Barthel 1989; Antonucci 1993; Urry & Padovani 1995). The core flux density has been estimated from images with angular resolutions of about an arcsec or so, and any possible contamination of core flux density by small-scale jets in the intermediate luminosity objects is minimal and unlikely to affect the trends reported here.
4.1 Core prominence
There have been suggestions that the giant sources have stronger nuclear activity represented by more prominent cores than the smaller sources (e.g. Gopal-Krishna et al. 1989). In this section, we investigate this aspect using our sample of giant and smaller 3CR sources. In Figure 8 we show the distributions of the fraction of emission from the core at an emitted frequency of 8 GHz, fc, for all the giant sources (upper panel) and the complete sample of 3CR sources with sizes between 50 kpc and 1 Mpc (lower panel). The quasars are shown hatched. For both the giant sources as well as the 3CR sources it is clear that the quasars have more prominent cores than the radio galaxies, suggesting that the giants associated with quasars are also at smaller angles to the line-of-sight than the giant radio galaxies, consistent with the unified scheme. The median values of fc for the giant quasars and radio galaxies are 0.12 and 0.034 respectively. However, for the 3CR sources in the size range of 50 kpc to 1 Mpc, the median values of fc are 0.052 and 0.0071 for the quasars and radio galaxies respectively. At first glance it appears that the giant galaxies do have more prominent cores than the smaller 3CR galaxies, and one might be tempted to suggest that they have stronger nuclear engines. The difference for the quasars needs to be examined further since there are only 5 giant quasars. Since many of the giant galaxies are in the borderline of the FRI/FRII classification, we examine the dependence of fc on the total radio luminosity for the complete sample of 3CR radio sources with sizes between 50 kpc and 1 Mpc, and our sample of giant sources (Figure 9a). There is a clear tendency of the weaker radio sources to have more prominent cores. While the fading of lobes in the giant radio sources may be a contributing factor, this is possibly due to greater dissipation of energy close to the nucleus in the sources with low-powered radio jets. This can also be seen in the plot of the total radio luminosity against the core radio luminosity (Figure 9b). A linear least-squares fit shows that they are related as logPc = (0.440.043) logPt + (12.351.16) for galaxies and logPc = (0.590.047) logPt + (8.581.25) when quasars are also included. The sample includes core flux density measurements for almost our entire sample of 3CR as well as giant radio sources. The trend is consistent with the results reported earlier by Feretti et al. (1984) and Giovannini et al. (1988) although in their studies many of the cores had reasonably high upper limits to the core flux density. A similar trend considering 3CR and B2 sources has been found by de Ruiter et al. (1990).


Considering the giant and smaller sources of similar radio luminosity, we do not find a significant trend for the giant radio sources to have more prominent radio cores than the smaller ones. For example in the luminosity range, 1025 to 1027 W Hz-1 where there is maximum overlap of the giants and the smaller sources, the median value of fc for the giant galaxies is 0.035 compared to 0.031 for the smaller sources. This also suggests that the giants are similar objects to the normal radio sources except for being larger and perhaps older. It is perhaps worth noting that in a couple of giant sources such as 3C236 which has a steep-spectrum core, and 1144+352 which has a GPS core, the high fc values may be different from the conventional flat-spectrum cores.
| Source | Epoch | Flux | References |
|---|---|---|---|
| name | density | ||
| (mJy) | |||
| NGC315 | 1978.56 | 62019 | Bridle et al. 1979 |
| 1980.80 | 55520 | Rudnick et al. 1986 | |
| 1980.88 | 59030 | Perley 1982 | |
| 1982.55 | 56517 | Saikia et al. in prep | |
| 1989.29 | 58818 | Venturi et al. 1993 | |
| 1995.83 | 73522 | Cotton et al. 1999 | |
| 1996.36 | 69521 | Cotton et al. 1999 | |
| 1996.77 | 68621 | Cotton et al. 1999 | |
| 1996.84 | 66820 | Cotton et al. 1999 | |
| 1997.53 | 68921 | Cotton et al. 1999 | |
| 1990.92 | #58818 | Venturi et al. 1993 | |
| 1994.53 | #74622 | Cotton et al. 1999 | |
| NGC6251 | 1980.88 | 65030 | Perley 1982 |
| 1982.55 | 66420 | Saikia et al. in prep | |
| 4C74.26 | 1986.5 | 42010 | Riley et al. 1989 |
| 1987.5 | 37010 | Riley et al. 1989 | |
| 1988.0 | 31010 | Riley et al. 1989 | |
| 1988.9 | 328 6 | Pearson et al. 1992 | |
| 4C34.47 | 1982.27 | 9010 | Barthel et al. 1989 |
| 1983.27 | 905 | Barthel et al. 1989 | |
| 1986.44 | 1105 | Barthel et al. 1989 | |
| 1986.17 | ∗1156 | Hooimeyer et al. 1992 | |
| 1986.40 | ∗1095 | Hooimeyer et al. 1992 | |
| 1988.73 | ∗1413 | Hooimeyer et al. 1992 |
∗ 10 GHz measurments; # 8 GHz measurments; other values are at 5 GHz.

4.2 Core variability
The clear tendency for the quasar cores to be more prominent than those in galaxies, even for the giant sources, suggests that the giant quasars are also at small angles to the line of sight, consistent with the ideas of the unified scheme. The detection of a one-sided radio jet in the giant quasar 4C74.26 (Riley & Warner 1990), and superluminal motion in the quasar 4C34.47 (Barthel et al. 1989; Hooimeyer et al. 1992) also support the unified scheme. The inferred angle to the line-of-sight for 4C34.47 from the observed superluminal motion is 2244∘ (Barthel et al. 1989), implying that the intrinsic size is between 1.5 and 2.7 Mpc. In the quasar 4C74.26, the inferred orientation angle of 49∘ (Pearson et al. 1992) implies an intrinsic size 2 Mpc.
Variability of the core flux density could provide additional test of this scenario (Blandford & Königl 1979; Saikia, Singal & Wiita 1991). We have compiled the core flux density of all the giant sources where the epochs of measurement are also listed, but find that only four of them have core flux density measurements at more than one epoch with similar as well as high angular resolution. Three of these, NGC315, NGC6251 and 4C74.26, have been observed with the VLA with resolutions of about an arcsec, while for 4C34.47 the core flux density values are from VLBI observations with mas resolution. The values for these 4 sources are listed in Table 4 and plotted against epoch in Figure 10. These are at 5 GHz unless indicated otherwise in the Table. For the obsrervations made by Saikia et al. (in preparation), Bridle et al. (1979), Venturi et al. (1993) and Cotton et al. (1999) we have assumed an error of 3 per cent in the core flux density. Both the quasars 4C74.26 and 4C34.47 exhibit evidence of variability of the core flux density, with 4C34.47 varying by about 50 per cent over a 4-yr time scale while 4C74.26 has varied by a similar amount over a 2-yr time scale. Jägers et al. (1982) also found the core of 4C34.47 to be variable from WSRT observations at 5 GHz. Both these quasars have prominent cores with fc about 0.60 and 0.51 respectively. Variability information is available for two of the galaxies, namely NGC315 and NGC6251, both of which have prominent cores with fc of about 0.32 and 0.75 respectively. NGC315 exhibits no evidence of significant variability over a time scale of about 12 yr between 1978 and 1990. The core flux density of NGC315 monitored by Ekers, Fanti & Miley (1983) also showed no evidence of variability although their values of core flux density are slightly higher due to the poorer resolution of the observations which would have been included a part of the extended radio jet. However, Cotton et al. (1999) have reported evidence of a flare from observations around 1995 at both 5 and 8 GHz. NGC6251 exhibits no evidence of variability over a time scale of about 2 yr. Although the present data are rather limited, this could potentially be an important test and at present provides marginal evidence in favour of the unified scheme.
4.3 Misalignment angle
A beam of plasma advancing outwards at the same position angle will travel farther in a given time scale compared to one whose position angle changes with time. If the formation of the giant sources is due to such a steady ejection axis one might find a statistical difference in the degree of misalignment between the giants and the smaller sources. However, the misalignment angle, defined to be the supplement of the angle formed at the core by the outer hotspots, shows no significant difference between the giants and the smaller sources (Figure 11), the median values being 5 and 6∘ respectively for the radio galaxies, excluding those with a clear FRI structure. The median value of for our Molonglo sample (IC98) is again about 5∘. The values are similar when we confine ourselves to objects of similar luminosity in the range of 1025 to 1027 W Hz-1. The 3CR quasars exhibit a flatter distribution which is possibly due to projection effects in sources inclined at smaller angles to the line-of-sight. The distributions of the misalignment angle also suggest that the giant sources are basically similar to the smaller ones except for being bigger and perhaps older. The hotspot advance speed could depend on more rapid changes in jet direction than would be revealed by the overall misalignment angle. This might be reflected in the detailed structure of the hotspots including multiple hotspots. However, to reliably study this aspect one needs high-resolution observations with a similar number of resolution elements along the source axes for both the giant and smaller sources.

4.4 Separation ratio
Although traditionally, the ratio of the separations of the hotspots from the nucleus for a randomly oriented sample of sources has been used to estimate the hotspot advancement speed (cf. Longair & Riley 1979), it has become clear over the years that an asymmetric environment is also responsible for the observed separation ratios (Saikia 1981; McCarthy, van Breugel & Kapahi 1991; Scheuer 1995). There has been some evidence that the compact steep spectrum sources, which are of subgalactic dimensions have larger separation ratios, suggesting that they are evolving in an asymmetric environment (Saikia et al. 1995). As the sources advance outwards into a more symmetric environment on opposite sides and with the jets maintaining a constant opening angle, the sources tend to become more symmetric (Saikia et al. 1996). The sample of 3CR sources considered by Saikia et al. showed some evidence in support of such a scenario.
Here we attempt to probe the environment on Mpc scales by examining the separation ratio of the giant radio sources (Figure 12). Considering all the sources in the luminosity range of 1025 to 1027 W Hz-1 so that the objects are of similar luminosity, the median value of the GRGs is about 1.39, which is marginally higher than for the smaller-sized 3CR radio galaxies with projected sizes between 50 kpc and 1 Mpc, which has a median value of 1.19. The corresponding values for the entire sample are 1.36 and 1.23 respectively. The median value for our Molonglo sample (IC98) is 1.26, which is similar to the 3CR sources. We have excluded all sources with a clear FRI structure. Although the difference is only marginally significant, the giant sources do not appear to be more symmetric and their observed asymmetry could be due to either the beams encountering density gradients on the scale of Mpcs associated with groups and clusters of galaxies after they traverse out of the halo of the parent galaxy, or the jets traversing outwards with constant jet widths after they emerge from an asymmetric environment. The jet widths could remain constant if they are confined by toroidal magnetic fields (Appl 1996, Appl & Camenzind 1993a, b). One can probe the asymmetry in the environment by examining the relationship between jet-sidedness and the separation ratio. There are only 4 galaxies, namely NGC315, 0319454, 4C74.17 and NGC6251, and 2 quasars, 4C74.26 and 4C34.47, with well-defined radio jets satisfying the criteria suggested by Bridle & Perley (1984). The jet side is closer in 3 of the 4 galaxies, but farther in both the quasars consistent with the environment playing a stronger role for galaxies while in quasars the effects of orientation seem more significant. The basic trends expected in the unified scheme are also seen in the giant radio sources. The flatter distribution of rθ for the 3CR quasars is possibly due to their smaller angles of inclination to the line-of-sight.

5 Concluding remarks
We have presented VLA observations of the giant quasars 0437244 and 1025229 from the Molonglo Complete Sample. These sources have well-defined FRII radio structure, possible one-sided jets, no significant depolarization between 1365 and 4935 MHz and low rotation measure ( RM 20 rad m-2). We have compiled a sample of 53 known giant radio sources from the literature, and have compared some of their properties with a complete sample of 3CR radio sources with sizes between 50 kpc and 1 Mpc to investigate the evolution of giant sources, and test their consistency with the unified scheme for radio galaxies and quasars. The conclusions are summarized briefly here.
-
1.
The power-linear size or P-D diagram for the 3CR and giant sources show a deficit of sources with radio luminosity greater than about 2 W Hz-1 at 1.4 GHz and sizes over a Mpc. A similar trend was noted earlier by Kaiser et al. (1997), and appears to be true for this much larger sample of giant sources selected from samples covering a wide flux density range. The location of the giants in the P-D diagram suggests that they have evolved from the smaller sources. Suggestions that they might be of similar age to the smaller sources from spectral index studies should be treated with caution because of the large number of uncertainties and assumptions in these estimates.
-
2.
The equipartition magnetic field, Beq, is smaller than the equivalent magnetic field of the microwave background radiation, Bic, for the giant sources, while the reverse is true for the smaller sources. Thus inverse-Compton losses dominate for the giant radio sources, while synchrotron radiation losses are more important for the smaller sources. This is likely to severely limit the number of giant radio sources at large redshifts.
-
3.
We find an inverse correlation between the degree of core prominence and total radio luminosity, and show that the giant radio sources have similar core strengths to the smaller sources when sources of similar total luminosity are considered. Although many of the giants have stronger cores than the high-luminosity FRII radio sources (cf. Saikia & Kulkarni 1994), this is largely due to the inverse correlation between the degree of core prominence and total radio luminosity, and does not necessarily indicate a higher nuclear activity or more powerful central engine. The more prominent cores in the lower luminosity sources is possibly due to greater dissipation of energy by the radio jet close to the nucleus.
-
4.
The degree of collinearity for the giant radio sources is similar to that of the smaller sources, suggesting that the steadiness of the axis is not the determining factor for the formation of giant radio sources.
-
5.
The ratio of separation of the outer hotspots for the giant sources appears marginally larger than the smaller-sized sources. This is somewhat surprising and could be possibly due to interaction of the energy-carrying beams with cluster-sized density gradients far from the parent galaxy. For 6 sources with radio jets, the hotspot on the jet side is closer for 3 of the 4 galaxies and none of the two quasars. This suggests that the environment plays a stronger role for galaxies while in quasars the effects of orientation seem more significant.
-
6.
The giant quasars have more prominent cores, one of which 4C34.47 exhibits superluminal motion and the cores of both quasars with adequate data exhibit evidence of variability. Unlike the quasars, the radio cores of one of the galaxies, NGC6251, exhibits no evidence of significant variability, while the other NGC315 exhibits evidence of a flare around 1995 after maintaining a nearly constant flux density for about 20 yr including the observations of Ekers et al. (1981). Although the available data are very limited, these are consistent with the unified schemes for radio galaxies and quasars.
Acknowledgments
We thank Sivakumar Manickam and Divya Oberoi for computational help, an anonymous referee for meticulously reading the manuscript and making several helpful suggestions and comments, Jayaram Chengalur and Kandaswamy Subramanian for their comments on the manuscript and many of our colleagues for useful discussions. The National Radio Astronomy Observatory is a facility of the National Science Foundation operated under co-operative agreement by Associated Universities Inc. We thank the staff of the Very Large Array for the observations. This research has made use of the NASA/IPAC extragalactic database (NED) which is operated by the Jet Propulsion Laboratory, Caltech, under contract with the National Aeronautics and Space Administration.
References
- [] Alexander P., Leahy J. P., 1987, MNRAS, 225, 1
- [] Antonucci R., 1993, ARA&A, 31, 473
- [] Appl, S., 1996, in Hardee P.E., Bridle A.H., Zensus J.A. eds., Energy Transport in Radio Galaxies and Quasars ASP Conference Series Vol 100, p. 129
- [] Appl S., Camenzind M., 1993a, A&A, 270, 71
- [] Appl S., Camenzind M., 1993b, A&A, 274, 699
- [] Baldwin J. E., 1982, in Heeschen D. S., Wade C. M., eds, Proc. IAU Symp. 97, Extragalactic Radio Sources, Reidel, Dordrecht, p21
- [] Barthel P. D., 1987 in Zensus J. A., Pearson T. J., eds., Superluminal Radio Sources ,Cambridge University Press, Cambridge, p. 148
- [] Barthel P. D., Schilizzi R. T., Miley G. K., Jägers W. J., Strom R. G., 1985, A&A, 148, 243
- [] Barthel P. D., Hooimeyer J. R., Schilizzi R. T., Miley G. K., Preuss E., 1989, ApJ, 336, 601
- [] Barthel P. D., 1989, ApJ, 336, 606
- [] Bhatnagar S., Gopal-Krishna, Wisotzki L., 1998, MNRAS, 299, L25
- [] Blandford R. D., Königl A., 1979, ApJ, 232, 34
- [] Blundell K. M., Rawlings S., Willott C. J., 1999, AJ, in press (astro-ph/9810197)
- [] Bridle A. H., Perley R. A., 1984, ARA&A, 22, 319.
- [] Bridle A. H., Davis M. M., Meloy D. A., Fomalont E. B., Strom R. G., Willis A. G., 1976, Nature, 262, 179
- [] Bridle A. H., Davis M. M., Fomalont E. B., Willis A. G., Strom R. G., 1979, ApJ, 228, L9
- [] Cotter G., Rawlings S., Saunders R., 1996, MNRAS, 281, 1081
- [] Cotton W. D., Feretti L., Giovannini G., Lara L., Venturi T., 1999, ApJ, in press (astro-ph/9902053)
- [] Danziger I. J., Goss W. M., Frater R. H., 1978, 184, 341
- [] de Bruyn A. G., 1989, A&A, 226, L13
- [] de Bruyn A. G., Schoenmakers A. P., Röttgering H., van der Laan H., 1998, NFRA Newsletter No. 15, p. 21
- [] de Ruiter H. R., Parma P., Fanti C., Fanti R., 1990, A&A, 227, 351
- [] Eilek J. A., Melrose D. B., Walker M. A., 1997, ApJ, 483, 282
- [] Ekers R. D., Fanti R., Lari C., Parma P., 1981, A&A, 101, 194
- [] Ekers R. D., Fanti R., Miley G. K., 1983, A&A, 120, 297
- [] Fanaroff B. L., Riley J. M., 1974, MNRAS, 167, L31
- [] Feretti L., Giovannini G., Gregorini L., Parma P., Zamorani G., 1984, A&A, 139, 55
- [] Fernini I., Burns J. O., Bridle A. H., Perley R. A., 1993, AJ, 105, 1690
- [] Fernini I., Burns J. O., Perley R. A., 1997, AJ, 114, 2292
- [] Giovannini G., Feretti L., Gregorini L., Parma P., 1988, A&A, 199, 73
- [] Gopal-Krishna, Wiita P.J., Saripalli L., 1989, MNRAS, 239, 173
- [] Gregorini L., Padrielli L., Parma P., Gilmore G., 1988, A&AS, 74, 107
- [] Hardcastle M. J., Alexander P., Pooley G. G., Riley J. M., 1997, MNRAS, 288, 859
- [] Hine R. G., 1979, MNRAS, 189, 527
- [] Hooimeyer J. R. A., Barthel P. D., Schilizzi R. T., Miley G. K., 1992, A&A, 261, 1
- [] Ishwara-Chandra C. H., Saikia D. J., Kapahi, V. K., McCarthy, P. J., 1998, MNRAS 300, 269 (IC98)
- [] Jägers W. J., 1986, PhD Thesis, University of Leiden
- [] Jägers W. J., van Breugel W. J. M., Miley G. K., Schilizzi R. T., Conway R. G., 1982, A&A, 105, 278
- [] Johnson R. A., Leahy J. P., Garrington S. T., 1995, MNRAS, 273, 877
- [] Jones P. A., McAdam W. B., 1992, ApJS, 80, 137
- [] Kaiser C. R., Alexander P., 1997, MNRAS, 286, 215
- [] Kaiser C. R., Dennett-Thorpe J., Alexander P., 1997, MNRAS, 292, 723
- [] Kapahi V. K., Athreya R. M., Subrahmanya C. R., Baker J. C., Hunstead R. W., McCarthy P. J., van Breugel W., 1998a, ApJS, 118, 327
- [] Kapahi V. K., Athreya R. M., van Breugel W., McCarthy P. J., Subrahmanya C. R., 1998b, ApJS, 118, 275
- [] Kronberg P. P., Wielebinski R., Graham D. A., 1986, A&A, 169, 63
- [] Lacy M., Rawlings, S., Saunders R., Warner P. J., 1993, MNRAS, 264, 721
- [] Laing R., Riley J. M., Longair M., 1983, MNRAS, 204, 151
- [] Large M. I., Mills B. Y., Little A. G., Crawford D. F., Sutton J. M., 1981, MNRAS, 194, 693
- [] Leahy J. P., Perley R. A., 1991, AJ, 102, 537
- [] Leahy J. P., Williams A. G., 1984, MNRAS, 210, 929
- [] Leahy J. P., Muxlow T. W. B., Stephens, P. W., 1989, MNRAS, 239, 401
- [] Longair M. S., Riley J. M., 1979, MNRAS, 188, 625
- [] Longair, M. S., 1994, High Energy Astrophysics, Cambridge University Press, Cambridge.
- [] Machalski J., Condon J. J., 1985, AJ, 90, 5
- [] Mack K.-H., Klein U., O’Dea C. P., Willis A. G., Saripalli L., 1998, A&A, 329, 431
- [] Masson C. R., 1979, MNRAS, 187, 253
- [] McCarthy P. J., van Breugel W., Kapahi V. K., 1991, ApJ, 371, 478
- [] Miley G. K., 1980, ARA&A, 18, 165
- [] Myers S. T., Spangler S. R., 1985, ApJ, 291, 52
- [] Neeser M. J., Eales S. A., Law-Green J. D., Leahy, J. P., Rawlings S., 1995, ApJ, 451, 76
- [] Pacholczyk A. G., 1977, Radio Galaxies, Pregamon Press
- [] Parma P., de Ruiter H. R., Mack K.-H., van Breugel W., Dey A., Fanti R., Klein U., 1996, A&A, 311, 49
- [] Pearson T. J., Blundell K. M., Riley J. M., Warner P. J., 1992, MNRAS, 259, L13
- [] Perley R. A., 1982, AJ, 87, 859
- [] Rengelink R., Tang Y., de Bruyn A. G., Miley G. K., Bremer M. N., Röttgering H. J. A., Bremer, M. A. R., 1997, A&AS, 124, 259
- [] Riley J. M., Warner P. J., 1990, MNRAS, 246, L1
- [] Riley J. M., Warner P. J., Rawlings S., Saunders R., Pooley G. G., Eales S. A., 1989, MNRAS, 236, L13
- [] Röttgering H. J. A., Tang T., Bremer M. A. R., de Bruyn A. G., Miley G. K., Rengelink R. B., Bremer M. N. 1996, MNRAS, 282, 1033
- [] Rudnick L., Jones T. W., Fiedler R., 1986, AJ, 91, 1011
- [] Saikia D. J., 1981, MNRAS, 197, L11
- [] Saikia D. J., Kulkarni V. K., 1994, MNRAS, 270, 897
- [] Saikia D. J., Singal A. K., Wiita P. J., 1991, in Miller H. R., Wiita P. J., eds, Variability of Active Galactic Nuclei, Cambridge University Press, Cambridge, p. 160
- [] Saikia D. J., Jeyakumar S., Wiita P. J., Sanghera H. S., Spencer R. E., 1995, MNRAS, 276, 1215
- [] Saikia D. J., Jeyakumar S., Wiita P. J., Hooda J. S., 1996, in Fanti C., Fanti R., O’Dea C. P., Schilizzi R. T., eds, Proc. of the Dwingeloo Workshop on Compact Steep Spectrum and GHz Peaked Spectrum Radio Sources, Istituto di Radioastronomia, Bologna, p. 252
- [] Saripalli L., 1988, PhD Thesis, Indian Institute of Science, Bangalore, India
- [] Saripalli L., Gopal-Krishna, Reich W., Kühr H., 1986, A&A, 170, 20
- [] Saripalli L., Subrahmanyan R., Hunstead R. W., 1994, MNRAS, 269, 37
- [] Saripalli L., Mack K.-H., Klein U., Strom R., Singal A. K., 1996, A&A, 306, 708
- [] Saunders R., Baldwin J. E., Warner P. J., 1987, MNRAS, 225, 713
- [] Scheuer P. A. G., 1974, MNRAS, 166, 513
- [] Scheuer P. A. G., 1987 in Zensus J. A., Pearson T. J., eds., Superluminal Radio Sources ,Cambridge University Press, p. 104
- [] Scheuer P. A. G., 1995, MNRAS, 277, 331
- [] Schoenmakers A. P., Mack K.-H., Lara L., Röttgering H. J. A., de Bruyn A. G., van der Laan H., Giovannini G., 1998a, A&A, 336, 455
- [] Schoenmakers A. P., de Bruyn A. G., Röttgering H. J. A., van der Laan H.,1998b, A&A, in press
- [] Shklovskii I., 1963, SvA, 6, 465
- [] Strom R. G., Baker J. R., Willis A. G., 1981, A&A, 100, 220
- [] Strom R. G., Willis A. G., 1980, A&A, 85, 36
- [] Subrahmanya C. R., Hunstead R. W., 1986, A&A, 170, 27
- [] Subrahmanyan R., Saripalli L., 1993, MNRAS, 260, 908
- [] Subrahmanyan R., Saripalli L., Hunstead R. W., 1996, MNRAS, 279, 257
- [] Urry C. M., Padovani P., 1995, PASP, 107, 803
- [] van Breugel W. J. M., Willis A. G., 1981, A&A, 96, 332
- [] Venturi T., Giovannini G., Feretti L., Comoretto G., Wehrle A. E., 1993, ApJ, 408, 81
- [] Vigotti M., Grueff G., Perley R.A., Clark B. G., Bridle A. H., 1989, AJ, 98, 419
- [] Waggett P. C., Warner P. J., Baldwin J. E., 1977, MNRAS, 181, 465
- [] Willis A. G., Strom R. G., 1978, A&A, 62, 375
- [] Willis A. G., Strom R. G., Wilson A. S., 1974, Nature, 250, 625
- [] Willis A. G., Strom R. G., Bridle A. H., Fomalont E. B., 1981, A&A, 95, 250
- [] Willis A. G., Strom R. G., Perley R. A., Bridle A. H., 1982, in Heeschen D. S., Wade C. M., eds, IAU Symp 97: Extragalactic Radio Sources, Reidel, Dordrecht, p. 141