Dynamics of the Galaxy
Abstract
Our Galaxy is a barred spiral. Recent work based on the COBE NIR data implies a small bulge–bar and a disk with a short scale-length. The corotation radius of the bar is in the range 3–4.5 kpc. The stellar density distribution beyond the end of the bar appears to be perturbed strongly by the Galaxy’s spiral arms.
Gas flow calculations in corresponding potentials provide a qualitative explanation of many features observed in HI and CO -diagrams. These include the 3-kpc-arm and the apparent four–armed spiral structure between corotation and the solar radius.
The mass of NIR–luminous matter is constrained by the terminal velocity curve, the Oort limit, and the bulge microlensing observations, and this implies that the Milky Way has a near-maximum disk and a dark halo with a large core radius of .
However, we are still some way from a detailed quantitative model for the large–scale dynamics of the Galaxy. I summarize a number of uncertainties as well as how future work might resolve them.
Astronomisches Institut der Universität Basel, Switzerland, gerhard@astro.unibas.ch
1. Introduction: The Barred Milky Way
It is now well–established that the Milky Way is barred. This is an important development: some long-standing questions about Galactic dynamics are beginning to be answered in the new framework, as discussed in later sections, and, not least, it is changing the way in which we have to think about the Galaxy’s evolutionary history.
The strongest evidence for a rotating bar in the inner Galaxy comes from the NIR light distribution, source count observations, the atomic and molecular gas morphology and kinematics, and the large optical depth to microlensing. This section gives a brief summary of this evidence; other recent reviews concerning observations and dynamical implications of the Galactic bar are in Gerhard (1996), Kuijken (1996), and Morris & Serabyn (1996).
Observations of cold gas in the inner Galaxy reveal large non–circular motions (e.g., Burton & Liszt 1978 [HI], Dame et al. 1987 [12CO], Bally et al. 1988 [13CO]). Some of the more prominent features include the 3–kpc–arm, the 135–km/s–arm, the molecular parallelogram or 180–pc–ring, and the high central peak in the terminal velocity curve at . Many papers in the past have suggested that the observed kinematics are best explained by gas motions in a barred potential (Peters 1975, Cohen & Few 1976, Liszt & Burton 1980, Gerhard & Vietri 1986, Mulder & Liem 1986, Binney et al. 1991, Wada et al. 1994). In §5 I discuss new hydrodynamical studies of the gas flow in the barred Milky Way.
The COBE-DIRBE photometry clearly show (Weiland et al. 1994, Freudenreich 1998, see Fig. 1) that the Galactic bulge is both brighter and more extended in latitude at given positive longitude than at the same negative longitude, except for a region close to the Galactic Centre where the first effect is reversed. These signatures are just as expected for a triaxial bulge with its long axis in the first quadrant (Blitz & Spergel 1991). Detailed modelling results are discussed in §2.
The flux distribution for IRAS bulge sources is systematically brighter on the side (Nakada et al. 1991), arguing for a non-axisymmetric bulge. A similar signature is also found in the much larger OGLE clump giant sample (Stanek et al. 1997). The small intrinsic luminosity spread ( mag) makes these stars good distance indicators and allows to constrain the parameters of the bar. Nikolaev & Weinberg (1997) reanalyzed the IRAS variable population, for which distance information is available from the known range of AGB star luminosities, and again find a barred source distribution.
The inferred optical depth in microlensing experiments towards the bulge (Udalski et al. 1994, Alcock et al. 1997) exceeds the values predicted by axisymmetric mass models by a factor of (Kiraga & Paczynski 1994, Evans 1994). This has widely been taken as further evidence for the Galactic bar. As discussed in §3, this is probably correct, but the precise interpretation of the measured event rates needs to be clarified and the predictions from models incorporating the bar need to be improved before quantitative conclusions can be drawn.
This article is not a comprehensive review of the ‘Dynamics of the Galaxy’, but is restricted to a number of topics related directly or indirectly to the existence of the bar. In the following I will discuss recent work on the structure of the bulge and disk (§2), bulge microlensing (§3), the stellar dynamics of the bulge §4), the gas flow in the Galactic disk interior to the Sun (§5), and the mass of the bulge and disk including consequences for the distribution of dark matter in the Galaxy (§6), and end with some concluding remarks in §7.
2. Photometric structure of the Galactic bulge and disk


The currently best models for the distribution of old stars in the inner Galaxy are based on the COBE/DIRBE NIR data. The COBE data have complete sky coverage, and provide broad-band emission maps from J,K,L,M in the NIR to and in the FIR. However, their analysis is complicated by the relatively low spatial resolution, the residual effects of dust absorption, and the fact that they contain no distance information; the best results will ultimately be obtained by combining them with other complementary data sets. Because extinction is important towards the Galactic nuclear bulge even at m, the first task is to correct (or ‘clean’) the DIRBE data for the effects of extinction. Arendt et al. (1994) did this by assuming that the dust lies in a foreground screen, while Spergel, Malhotra & Blitz (1996) and Freudenreich (1998) used fully three-dimensional models of the dust distribution.
The cleaned DIRBE data confirm that the Galactic bulge is both brighter and more extended in latitude () at positive longitudes than at corresponding negative longitudes (), except for a region close to the Galactic Centre where the bulge is brighter at negative (Dwek et al. 1995, Bissantz et al. 1997). These signatures are just as expected for a triaxial bulge with its long axis in the first quadrant (Blitz & Spergel 1991). They can be quantified by an ‘asymmetry map’ – flux at divided by flux at in logarithmic units – cf. Fig. 1 (from Bissantz et al. 1997). The region of negative asymmetry at small argues for a bar rather than a lopsided distribution as the cause of the positive asymmetry at larger ; see also Sevenster (1997). Most of the asymmetry signal is in the range mag.
Binney & Gerhard (1996) developed a Lucy–Richardson deprojection algorithm to interpret these data, based on the assumption that the Galaxy’s NIR emissivity distribution is eight–fold (triaxially) symmetric . They showed that in this case the ambiguity inherent in the deprojection of 2d data is reduced to essentially that involved in choosing the orientation of the bulge’s symmetry planes. This algorithm was used by Binney, Gerhard & Spergel (1997, hereafter BGS97) to fit non–parametric models for the 3d emissivity to the cleaned L–band data of Spergel et al. (1996). When the orientation of the symmetry planes is fixed, the recovered emissivity appears to be essentially unique, but physical models for the COBE bar can be found for a range of bar orientations: , where measures the angle in the Galactic plane between the bar’s major axis at and the Sun–centre line. Zhao (1999) has given an illustration of the non–uniqueness of the bar orientation in terms of the even part of the bulge density distribution.


Fig. 2 shows the deprojected luminosity distribution resulting for . This shows an elongated bulge with axis ratios 10:6:4 and semi–major axis , surrounded by an elliptical disk that extends to on the major axis and on the minor axis. There is a maximum in the projected NIR emissivity down the minor axis in the Galactic plane, which is caused by emission near the plane and is probably due to incorrectly deprojected strong spiral arms (see below). This feature corresponds to the ring–like structure discussed by Kent, Dame & Fazio (1991). An exponential fit at larger radii gives a radial disk scale length of . Fig. 1 shows the asymmetry map of a similar model to compare with the data.
Dwek et al. (1995) and Freudenreich (1998) have constructed parametric models to match their dust–cleaned DIRBE data. In Freudenreich’s (1998) recent work the region near the Galactic plane is excluded in the fit (owing to uncertainties in the dust extinction) and the disk is modelled with a central hole. His analysis based on several NIR wavebands gives a bulge with axial ratios 10:4:3, length , at a preferred orientation of around . The disk scale-length outside the central hole is .
The differences between these models perhaps give a fair measure of the remaining uncertainties. It is likely that the dominant source of error is still buried in the details of the dust absorption model, but also systematic errors in constructing 3d models from 2d data have to be explored further. One major difference is in the structure of the inner disk and, hence, the amount of luminosity in the inner disk compared to the bulge. To resolve this clearly requires fitting the data at small and and hence a reliable dust model. Absorption will be a lesser problem at higher latitudes where the bulge structure is mainly determined, but the observed asymmetry signal of a few tenths of a magnitude is not greatly larger than the estimated errors in the extinction (, Spergel et al. 1996). Thus it appears worthwhile to reanalyze the DIRBE data based on more sophisticated dust extinction models (e.g., Sodroski et al. 1997).
A different and very promising approach is based on analysing large point-source catalogues. Stanek et al. (1997) fitted bulge–bar models to the apparent magnitude distributions of clump giant stars in 12 OGLE fields. The small intrinsic luminosity spread ( mag) makes these stars good distance indicators. Stanek et al. ’s best bulge model fitted to the reddening–corrected data is one with an exponential density distribution, axial ratios 10:4:3, and a bar angle of . These parameters stem from a parametric fit of the bulge only and some contamination from the foreground disk seen in the NIR is likely. With potentially many more fields to come from the OGLE II and MACHO projects this method has future potential.
Nikolaev & Weinberg (1997) reanalyzed the IRAS variable population, for which distance information is available from the known range of AGB star luminosities. This sample has a large spatial coverage near the plane; taking into account selection effects and incompleteness, Nikolaev & Weinberg (1997) find a barred distribution (dominated by the disk population) with length , axial ratio in the plane 10:4, and orientation .
NIR starcounts have confirmed the longitudinal asymmetry due to the bar (Unavane & Gilmore 1998), at a level more in accord with the BGS97 model. López-Corredoira et al. (1997) have modelled the Two Micron Survey Starcounts in three strips across the bulge. Their best model is a nearly end–on () triaxial bar with axis ratios 10:5-6:3. Earlier starcount models (Robin et al. 1992, Ortiz & Lépine 1993) also favour a short disk scale (), but the uncertainties due to inbuilt model assumptions are not easily quantified. Earlier claims that the Milky Way disk could have a central hole have not been confirmed (Kiraga, Paczynski & Stanek 1997).
In summary, this combined work has confirmed and elucidated the barred structure of the Galactic bulge and inner disk. While the length of the bar is near 3–3.5 kpc and the bar angle with respect to the Sun–Center line is probably around , there is still some debate about the axis ratios (within a range 10:[4-6]:[3-4]) and the detailed density structure. A further important conclusion with considerable consequences for Galactic mass models (see §8) is that the radial scale–length of the Galactic disk in the NIR is short, . Further progress will in my view come from (i) improved models for the dust extinction, (ii) combining the area coverage of the COBE data with the distance information in the clump giant and other stellar samples, and (iii) a better understanding of possible population differences between bulge and disk.
3. Microlensing towards the Galactic bulge
Microlensing observations provide new constraints on the structure of the Galactic bulge and disk. The most robust observable is the total optical depth averaged over the observed fields. Defining , the measured values are: for OGLE main-sequence stars, () from 9 events (Udalski et al. 1994); for MACHO main-sequence stars, () from 41 events (Alcock et al. 1997), when a correction for disk contribution is removed; and () for MACHO’s 13 clump giant stars, averaged over square degrees centered at (Alcock et al. 1997).
The interpretation of these numbers is complicated. It has recently become clear that blending or amplification bias (Alard 1997; blended sources below the survey magnitude limit become bright enough to be included when lensed) is important for the bulge microlensing events. About half of all OGLE events show strong centroid shifts (Goldberg & Woźniak 1998), hence are affected by blending. The required correction to the optical depth has yet to be determined. The effect is likely to be similarly important for the MACHO main sequence stars, whereas the bright clump giant stars should be unaffected. A proper analysis of the larger MACHO 4 yr dataset is eagerly awaited. Another complication are the steep gradients in the bulge expected from the NIR models; spatially resolved data would of course be ideal for structural information.
It has long been known that axisymmetric models predict , insufficient to explain the quoted optical depths (Kiraga & Paczynski 1994, Evans 1994). Models with a nearly end–on bar as described in §2 enhance because of the longer average LOS from lens to source. The maximum effect occurs for when for (Zhao & Mao 1996). In addition, increases with the mass and the length of the bar/bulge.
Optical depths in Baade’s window in some recent bar models for the Milky Way are for based on a model of the COBE data (Zhao, Spergel & Rich 1995), for based on a revised COBE model (Han & Gould 1995), for based on a model for the distribution of clump giants (Stanek et al. 1997), for based on AGB stars (Nikolaev & Weinberg 1997), and for based on the deprojection of the COBE L–band data described in §2 (Bissantz et al. 1997). The latter paper calibrates the mass of the disk and bulge by matching the predicted gas velocities to the Galactic terminal velocity curve, whereas most others normalize their models to the velocity dispersion in Baade’s window (less secure because of foreground disk contamination). Part of the differences between the model predictions is due to differences in the bulge mass.
Thus even in bar models it has proven difficult to obtain the measured optical depths. One interesting result was noted by Fux (1997): in his N–body simulations a strong spiral arm in front of the Galactic center could add as much as . The resolution of the large optical depth problem is clearly important.
4. Stellar dynamics of the Galactic bulge–bar
Do measurements of stellar kinematics in low–extinction bulge fields support the triaxial nature of the bulge? How can they help to elucidate its structure and to constrain the pattern speed or aspect angle? To answer these questions requires dynamical models which link the stellar density distribution and gravitational potential to the kinematics of the stars observed.
Before discussing existing dynamical models, it is worthwhile to note that Galactic kinematic observations in principle contain a very large amount of information. (i) We can measure radial velocities as well as proper motions. (ii) With enough stars, velocity histograms can be obtained rather than just first and second moments. (iii) Distance information is available through the known luminosity distribution of the tracers. For the clump giant stars already discussed, the absolute magnitude width corresponds to a distance uncertainty of . The drawback of Inner Galaxy kinematic observations is, as always, the heavy extinction. However, if the samples are well–understood, and if it is possible only in a number of bulge fields to obtain an approximate measurement of the distribution of stars as a function of three velocities and LOS distance, such data will be highly constraining for the models, and thus worthwhile to get!
An influential dynamical model has been that of Kent (1992). He constructed an oblate–isotropic rotator model which successfully reproduced essentially all the then available velocity dispersion data in the bulge. This in itself is interesting because it suggests that the signatures of triaxiality in these bulge fields are not strong. Proper motion measurements in Baade’s window (BW, Spaenhauer, Jones & Whitford 1992) confirmed that the velocity ellipsoid in BW is nearly isotropic.
One clear signature of triaxiality is rotation on the bulge minor axis. Sofar the observational situation in the bulge is suggestive but not yet clear (Tyson & Rich 1991, Blum et al. 1994, Izumiura et al. 1995). Another signature is a tilt of the velocity ellipsoid out of the –plane. Zhao, Spergel & Rich (1994) analyzed a subsample of the proper motions stars in BW with measured radial velocities and found preliminary evidence for such a vertex deviation, perhaps evidence for the bar.
New triaxial models for the Galactic bulge are broadly consistent with a range of stellar kinematic data in the bulge region. Zhao (1996) constructed a dynamical model for one of the Dwek et al. (1995) COBE bar models augmented by a central cusp. Fux (1997) analyzed N–body models whose surface density is consistent with the COBE K-band data after dereddening with a foreground screen model. Finally, Häfner et al. (1999) constructed a dynamical model by an extended Schwarzschild method that reproduces the deprojected luminosity density of BGS97 and simultaneously fits a number of kinematic constraints. The latter work emphasises the importance of understanding the ‘selection function’, which describes the relative fraction of stars contributing to a given kinematic sample, as a function of distance along the LOS. By a careful choice of sample, kinematic information can be obtained for a fairly narrow range of distances along the LOS. Such data will be the most helpful for discriminating between models.
While the presently available stellar kinematics are thus compatible with the COBE bar models, finding unambiguous evidence for triaxiality or even constraining the bar parameters will require more and more specific data.
5. Gas dynamics in the Milky Way

It has long been suggested that the non–circular and forbidden velocities in the HI and CO () diagrams are the signature of a rotating bar in the inner Galaxy (see §1 for references). Considerable understanding can be reached with simple orbit–based models, because away from resonances the gas flow is expected to approximately follow closed ballistic orbits (e.g., Athanassoula 1992). Within such a model, we suggested (Binney et al. 1991) that (i) the peak at and rapid fall-off towards larger longitudes of the Galactic terminal velocity curve can be explained in terms of the properties of –orbits in a barred bulge viewed nearly end–on, (ii) the dense Galactic center clouds seen in CS are moving on –orbits further in, at , (iii) the transition between these two flow regimes occurs through a cusped orbit (dust lane) shock whose trace is the parallelogram seen in the molecular gas observations of Bally et al. (1988), and (iv) the molecular ring at is associated with the bar’s OLR.
Closed orbit models cannot take into account the effects of the strong shocks that form in barred galaxy gas flows (e.g., Athanassoula 1992, Englmaier & Gerhard 1997). Where these shocks occur, hydrodynamic forces become important and so the flow may deviate strongly from ballistic orbits. Also, the Binney et al. analysis was based on a simple mass model for the inner Galaxy; now that quantitative models can be obtained from the NIR emission of old stars, the gas flow in the inner Galaxy can be investigated with much more confidence. Several recent studies have thus made a fresh attack on understanding the Galactic () diagrams, trying to model the non–circular motions in the central degrees, the dust lane shocks, the nature of the 3-kpc-arm, the molecular ring, and the Galactic spiral arms. These studies have followed complementary approaches: Englmaier & Gerhard (1999, EG99) have modelled SPH gas flows in the deprojected COBE bulge and disk, Fux (1999) has constructed ab initio N–body/SPH self–consistent barred galaxy models adapted to the Milky Way, and Weiner & Sellwood (1999) have studied 2D fluids in a family of barred potentials.
A primary question concerns the pattern speed , or corotation radius , of the Galactic bar. We can estimate this as follows: (i) The 3-kpc-arm is associated with non–circular velocities at . From the results of EG99, only arms inside corotation and driven by the bar have such large . (ii) If the rotating potential is approximately time–independent, the inner edge of the molecular ring should be a lower limit to , both if this is indeed a ring near the outer Lindblad resonance (OLR; Schwarz 1981), and also if in reality it consists of tightly wound spiral arms (Dame 1993, EG99). The inner edge of the molecular ring can be estimated from the distribution of hot cloud cores (, Solomon et al. 1985) and from the model of Kent et al. (1991) for the IRT ring (). Combining both arguments we obtain .
An independent argument from the length of the NIR bar agrees with this estimate. In N–body models (Sellwood & Wilkinson 1993), and from both direct pattern speed measurements (Merrifield & Kuijken 1995) and gas–dynamical modelling (Athanassoula 1992), it is found that . With (§2, Freudenreich 1998) this results in (not including possible systematic errors in locating the end of the bar).
However, in self–consistent N–body/SPH models Fux (1999) has observed time–dependent gas flows that never approach a quasi–stationary configuration. The time–dependence appears to be driven partly by a central sloshing of the bulge with amplitude of several , which is not well understood, and partly by the interaction of the bar with the outer stellar and gaseous spiral arms. If the Milky Way is a similarly time–dependent system (see Morris & Serabyn 1996), argument (ii) above does not necessarily hold because then the spiral arms in the molecular ring may penetrate into corotation. Fitting his models to the observed () diagrams, Fux (1999) finds a larger .
Fig. 3 shows the radii of the major resonances for the combined range of corotation radii and a bulge, disk and nucleus mass distribution based on the model of BGS97 with constant L-band mass–to–light ratio. The absolute scaling of the ordinate is approximate, depending on the detailed model fit to the terminal velocity curve. The position of the OLR is predicted to be at , so is well inside the solar radius even for the slowest pattern speed. The circular velocity at these radii from the luminous matter only is still close to , so adding a dark halo near and beyond the solar radius does not change the position of the OLR significantly. Thus the influence of the bar on the dynamics of the disk near the Sun should be small.
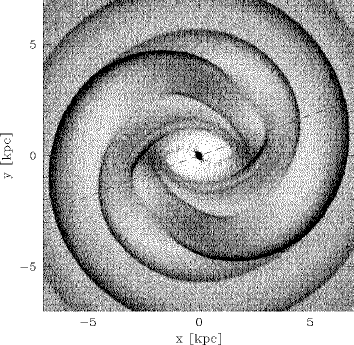
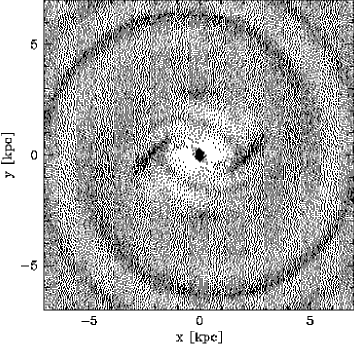
Is this confirmed by more detailed simulations? Fig. 4 compares model gas flows in the full COBE potential and in the same model modified by axisymmetrizing the disk for radii . The two gas flows are dramatically different; the bar alone is unable to drive significant spiral arm structure in the gas beyond – the structures seen in the right panel of Fig. 4 are merely gas concentrations but no real shocks; this is not a resolution effect. Also, the two arms beginning above and below the bar in the left panel of Fig. 4 are absent in the right panel. The bar–only model would be in conflict with the tangent point observations indicating the presence of strong spiral arms at , and the abundance of warm CO clouds found near (Solomon, Sanders & Rivolo 1985) indicating a spiral arm shock in this region. In the full COBE model, the spiral arms beyond are driven by the mass corresponding to the NIR luminosity concentrations at down the bar minor axis (see §2). The conclusion is therefore that these concentrations cannot just be caused by luminous supergiant stars, but must contain significant mass. Most likely, they are due to incorrectly (because of the employed symmetry assumption) deprojected spiral arms. If this interpretation is correct, the dynamics between the bar’s corotation radius and the Sun is dominated by the Galaxy’s spiral arms. These might well have a pattern speed of their own (Sellwood & Wilkinson 1993), and then they and not the bar would dominate resonances near the Sun.
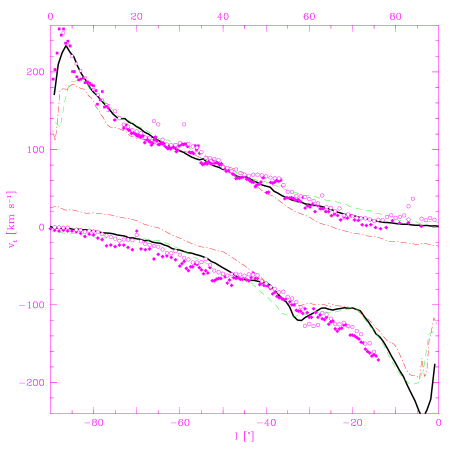
Outside the induced non–circular motions are fairly small. Fig. 5 shows predicted terminal velocity curves from several gas flow models in the gravitational potential of the COBE bar and disk, to which in some cases a dark halo potential has been added. In these models the bar rotates with a pattern speed corresponding to (see EG99). Overall, the models match the observed HI and CO terminal velocities rather well. The two main discrepancies are in the central peak, where there are both resolution problems and uncertainties in the potential, and in a region around , where the disk potential from the deprojected NIR data may be seriously in error (see §2). Out to , where the dark halo begins to contribute, the observed terminal velocity curve is consistent with the radial distribution of old stellar mass inferred from the COBE data.
These gas flow models give rise to () diagrams which qualitatively reproduce a number of features seen in the observed () diagrams (see EG99 and the paper by Englmaier & Gerhard in these proceedings). The four–armed spiral structure outside corotation (see Fig. 4) is quantitatively consistent with the observed directions to the five main spiral arm tangents at . The 3-kpc-arm is identified with one of the model arms emanating from the ends of the bar and extending into the corotation region (below the bar in Fig. 4). The cusped–orbit shock transition channels the gas onto an inner disk on –orbits which in the simulations of EG99 has radius and rotation velocities , approximately as inferred from CS observations (Bally et al. 1988, Binney 1994). The models fail, however, in accounting for the magnitude and extent in longitude of the forbidden velocities seen in low–intensity HI observations. Weiner & Sellwood (1999) have specifically modelled these HI data, and find that this problem can be resolved if the Galactic bar is inclined by a larger angle, , as seen from the Sun. The models of Fux (1999) show, however, that extended forbidden velocity regions can occur also for smaller bar angles if the model is asymmetric and no longer quasi–stationary. Thus there may not be a conflict with the smaller favoured by the clump giant distribution and the large microlensing optical depth.
The non–stationary gas flow models in the N–body and SPH simulations of Fux (1999; see also his paper in these proceedings) give the best match sofar to several features in the observed () diagrams: the 3–kpc arm, the connecting arm, the –arm, and the molecular ring. They fail in that there is no spiral arm corresponding to the tangent, and they assert that the inner disk on –orbits rotating at extends to , distinct from the dense clouds seen in CS which extend to and appear to rotate with on presumably -orbits (Binney 1994). The issue of a large -disk is also relevant for interpreting the kinematics of the bar–driven inner arms. The interpretation of the 3–kpc arm as one of the lateral arms emanating from the end of the bar is similar in the models of EG99 and Fux (1999), although the morphology of the transition from this arm into the dust lane shock is somewhat different, probably due to differences in the gravitational potential and differences between quasi–stationary and time–dependent flows.
Sevenster (1997) argues that in reality the 3–kpc arm is part of an inner ring surrounding the bar, such as observed in some other galaxies. Her strongest observational result supporting this interpretation is (in my view) the alignment of a small group of 100–300 Myr old OH/IR stars coincident with the 3–kpc arm in the HI () diagram. The rotation period at 3 kpc is , so these stars appear to have remained near their birth sites for 1–3 rotation periods. Much depends on the precise ages of these stars, and on the pattern speed of the 3–kpc arm. From the above this will be similar to the bar’s pattern speed. Stars at 3 kpc radius then leave the arm on a time–scale (for flat rotation curve). With ] is the orbital period, and for these stars would not leave the pattern at all.
The now existing models for the Galactic gas flow certainly do not yet provide a quantitative fit to all the major features in the observed () diagrams. However, with their help many of these features are beginning to make sense in the framework of a barred Milky Way. It is encouraging that two approaches, one starting from the COBE observations, the other from the evolution of self–consistent N–body systems, seem to converge to a similar picture when constrained by the HI and and CO () diagrams: a corotation radius about half way between the Sun and the Galactic Center, a strong, probably 4–armed spiral pattern between and the solar radius, and non–circular gas motions inside which take the gas along the inner arms near the ends of the bar through the dust–lane shocks to the nuclear disk on –orbits.
6. The mass of the bulge and disk, the Oort limit, and the
distribution of dark matter in the Galaxy
The observed terminal velocity curve (Fig. 5) is consistent with a maximum NIR disk (and bulge) model out to or , for an exponential scale length of the disk of (see §2). This maximum disk model predicts a surface mass density of near the Sun at for a local circular velocity of . The local surface density of ‘identified matter’ is , while a combined constraint from the total surface density within and the rotation curve is (Kuijken & Gilmore 1991). Both are consistent also with the K–giant analysis of Flynn & Fuchs (1994). That these numbers approximately agree lends support to the conclusion that the Galaxy indeed has a near–maximal disk. Similarly, the high microlensing optical depth to the bulge argues for a high bulge and disk mass, but a quantitative argument is presently difficult to make (see §3). Compared to earlier analyses, the main difference is the short disk scale–length (see also Sackett 1997) and the extra light around 3 kpc (see BGS97) – the Sun is well beyond the maximum in the rotation curve from the NIR luminous matter only.
The mass of the NIR disk inferred from the terminal velocities must include some but may not include all of the mass in the Milky Way’s gas disk (local surface density ; see Dame 1993) and thick disk (local surface density and scale length , Beers & Sommer–Larsen 1995, Ojha et al. 1996), because the radial density distributions of these components are different from the old NIR disk. For the following I have assumed that the total visible mass in the Galaxy is given by the mass of the COBE NIR bulge and disk and the thick disk only, assuming that the gas disk is already accounted for by the fitted mass in the NIR disk. Since the HI distribution has a larger scale–length than the stars, this approximation might slightly overestimate the final halo contribution.
Computing the gravitational forces from these two components, and fitting a cored spherical halo so as to make the Galaxy’s rotation curve approximately flat at with , results in a halo core radius . Integrating the surface density of this halo between gives . Adding this to the surface density of the old NIR disk and the thick disk, the total is , whereas the measured total (Kuijken & Gilmore 1991).
This very good agreement is clearly better than one expects, given the various uncertainties in both numbers, but it shows that a maximum NIR disk model and a near–spherical halo with a large core radius provide a natural explanation for both the observed terminal velocity curve and the measured surface density near the Sun. Note that for smaller values of the Galaxy’s asymptotic rotation velocity, the required amount of halo would be reduced; for the terminal velocity curve can be fit within the errors without any added halo (at the cost of a falling rotation curve). A more detailed analysis is clearly worthwhile.
7. Concluding remarks
The work reviewed here confirms that the Galaxy contains a central bar, seen most clearly in the NIR, the source counts and the gas kinematic observations. The corotation radius of the bar is about half-way between the Sun and the Galactic Center. There is still some uncertainty about the orientation (most likely , but possibly ) and axial ratios (roughly 3:2:1) of the bar, and about the relative importance of the disk in the central few kpc. The short disk scale–length in the NIR is important; combined with the Galactic terminal velocity curve and the Oort limit it implies a near–maximal disk and a fairly large halo core radius.
Is there a Galactic bulge besides the bar? This has not been conclusively answered. While the clump giant stars appear to belong to a strongly barred component, the NIR–luminosity could be less strongly barred, and the RR Lyrae stars, presumably part of the stellar halo, appear to be unbarred (Alcock et al. 1998). In external galaxies, kpc–scale central bars and nuclear bulges may coincide (Möllenhoff, private communication; see also Seigar & James 1998). In M94, the vertical velocity dispersion in the nuclear region is higher than that in the bar (Möllenhoff et al. 1995); this suggests that in the Milky Way the question might be answered by studying proper motions as a function of age and metallicity in low latitude bulge fields.
Acknowledgments.
This work was supported by the Swiss NSF grant 20-50676.97.
References
Alard C., 1997, A&A, 321, 424
Alcock C., et al. , 1997, ApJ, 479, 119
Alcock C., et al. , 1998, ApJ, 492, 190
Arendt R.G., et al. 1994, ApJ, 425, L85
Athanassoula E., 1992, MNRAS, 259, 345
Bally J., Stark A.A., Wilson R.W., Henkel C., 1988, ApJ, 324, 223
Beers T.C., Sommer-Larsen J., 1995, ApJS, 96, 175
Binney J.J., 1994, in The Nuclei of Normal Galaxies, NATO ASI Ser. C, Vol. 445, Genzel R., Harris A.I., eds, Kluwer, Dordrecht, 75
Binney J.J., Gerhard O.E., 1996, MNRAS, 279, 1005
Binney J.J., Gerhard O.E., Spergel D.N., 1997, MNRAS, 288, 365(BGS97)
Binney J.J., Gerhard O.E., Stark A.A., Bally J., Uchida K.I., 1991, MNRAS, 252, 210
Bissantz N., Englmaier P., Binney J.J., Gerhard O.E., 1997, MNRAS, 289, 651
Blitz L., Spergel, D., 1991, ApJ, 379, 631
Blum R.D., Carr J.S., Depoy D.L., Sellgren K., Terndrup, D.M., 1994, ApJ, 422, 111
Burton W.B., Liszt H.S., 1978, ApJ 225, 815
Cohen R.J., Few R.W., 1976, MNRAS, 176, 495
Dame T.M., 1993, in: Back to the Galaxy, eds. Holt S.S., Verter F., AIP 278, American Institute of Physics, 267
Dame T.M., et al. , 1987, ApJ, 322, 706
Dwek E., et al. , 1995, ApJ, 445, 716
Englmaier P., Gerhard O.E., 1997, MNRAS, 287, 57
Englmaier P., Gerhard O.E., 1999, MNRAS, in press
Evans N.W., 1994, ApJL, 437, L31
Flynn C., Fuchs B., 1994, MNRAS, 270, 471
Freudenreich H.T., 1998, ApJ, 492, 495
Fux R., 1997, A&A, 327, 983
Fux R., 1999, A&A, , submitted
Gerhard O.E., 1996, in: Unsolved Problems of the Milky Way, IAU Symp. 169, eds. L. Blitz, P. Teuben, Kluwer, Dordrecht, 79
Gerhard O.E., Vietri M., 1986, MNRAS, 223, 377
Goldberg D.M., Woźniak P.R., 1998, Acta Astron., 48, 19
Häfner R., Evans N.W., Dehnen W., Binney J., 1999, MNRAS, , in preparation
Han C., Gould A., 1995, ApJ, 449, 521
Izumiura H., et al. , 1995, ApJ, 453, 837
Kent S.M., 1992, ApJ, 387, 181
Kent S.M., Dame T.M., Fazio G., 1991, ApJ, 378, 131
Kiraga M., Paczyński B., 1994, ApJ, 430, L101
Kiraga M., Paczyński B., Stanek K.Z., 1997, ApJ, 485, 611
Kuijken K., 1996, in: Barred Galaxies, IAU Coll. 157, eds. R. Buta, D.A. Crocker, B. G. Elmegreen, ASP, San Francisco, 504
Kuijken K., Gilmore G., 1991, ApJ, 367, L9
Liszt H.S., Burton W.B., 1980, ApJ, 236, 779
López-Corredoira M., Garzón F., Hammersley P., Mahoney T., Calbet X., 1997, MNRAS, 292, L15
Merrifield M.R., Kuijken K., 1995, MNRAS 274, 933
Möllenhoff C., Matthias M., Gerhard O.E., 1995, A&A, 301, 359
Morris M., Serabyn G., 1996, ARAA, 34, 645
Mulder W.A., Liem B.T., 1986, A&A, 157, 148
Nakada Y., Deguchi S., Hashimoto O., Izumiura H., Onaka T., Sekiguchi K., Yamamura I., 1991, Nat, 353, 140
Nikolaev S., Weinberg M.D., 1997, ApJ, 487, 885
Ojha D.K., Bienaymé O., Robin A.C., Crézé M., Mohan V., 1996, A&A, 311, 456
Ortiz R., Lépine J.R.D., 1993, A&A, 279, 90
Peters W.L., 1975, ApJ, 195, 617
Robin A.C., Crézé M., Mohan V., 1992, A&A, 265, 32
Sackett P.D., 1997, ApJ, 483, 103
Schwarz M.P., 1981, ApJ, 247, 77
Seigar M.S., James P.A., 1998, MNRAS, 299, 672
Sellwood J.A., Wilkinson A., 1993, RepProgPhys 56, 173
Sevenster M., 1997, PhD thesis, Univ. of Leiden
Sodroski T.J., Odegard N., Arendt R.G., Dwek E., Weiland J.L., Hauser M.G., Kelsall T., 1997, ApJ, 480, 173
Solomon P.M., Sanders D.B., Rivolo A.R., 1985, ApJ, 292, 19
Spaenhauer A., Jones B.F., Whitford A.E., 1992, AJ, 103, 297
Spergel D.N., Malhotra S., Blitz L., 1996, in: Spiral Galaxies in the Near-IR, eds. D. Minniti, H.-W. Rix, Springer, Berlin, 128
Stanek K.Z., et al. 1997, ApJ, 477, 163
Tyson N.D., Rich R.M., 1991, ApJ, 367, 547
Udalski A. et al. , 1994, Acta Astron., 44, 165
Unavane M., Gilmore G., 1998, MNRAS, 295, 145
Wada K., Taniguchi Y., Habe A., Hasegawa T., 1994, ApJ, 437, L123
Weiland J.L., et al. , 1994, ApJL, 425, L81
Weiner B., Sellwood J.A., 1999, ApJ, , submitted
Zhao H.S., 1996, MNRAS, 283, 149
Zhao H.S., 1999, MNRAS, submitted
Zhao H.S., Mao S., 1996, MNRAS, 283, 1197
Zhao H.S., Spergel D.N., Rich R.M., 1994, AJ, 108, 2154
Zhao H.S., Spergel D.N., Rich R.M., 1995, ApJ, 440, L13