BOK GLOBULES IN THE LMC11affiliation: Based on observations with the NASA/ESA Hubble Space Telescope obtained at Space Telescope Science Institute, which is operated by the Association of Universities for Research in Astronomy, under NASA contract NAS5-26555.
Abstract
We report the discovery of small, isolated dust clouds in the Large Magellanic Cloud, which are excellent candidates for counterparts to the Bok globules observed in the Galaxy. We detect these small clouds silhouetted against diffuse H emission, based on parallel imaging with the WFPC-2 on HST. The clouds we identify as Bok globule candidates have typical sizes of approximately 1, corresponding to about 0.25 pc linear diameter at the distance of the LMC. We derive lower limits to the optical depth within the dark clouds, and masses assuming that the clouds have density distributions similar to Galactic Bok globules. The sizes and estimated masses for LMC globules are comparable to those estimated for Galactic globules. An extended sample of such objects would be excellent targets for high-resolution infrared and millimeter observations to study low-mass star formation in such clouds in low-metallicity environments, where the distance is well known.
1 Introduction
Fifty years ago, Bok & Reilly (1947) described the dark clouds now known as Bok globules, and proposed that these clouds were likely undergoing gravitational collapse to form new stars. It was many years until that speculation was confirmed, however. Since then, a number of recent infrared and radio studies have demonstrated that Bok globules show a variety of evidence for new stars: embedded warm IR sources, often showing evidence for local dust heating, nebulosity, or the signatures of protostars (Keene et al. 1983; Yun & Clemens 1990, 1995), Herbig-Haro objects (Reipurth, Heathcote, & Vrba 1992), and molecular gas outflows (Yun & Clemens 1992). At the same time, detailed millimeter-wave emission line studies of some of these objects have provided some of the best direct evidence yet for infall of material onto an accreting protostar (e.g., Zhou et al. 1993).
Isolated Bok globules have thus turned out to be important laboratories for the study of protostellar collapse. Nevertheless, a few important uncertainties remain regarding the properties of the Galactic globules, mainly because distances to individual Bok globules are difficult to determine, although new developments promise to improve this situation in the near future (Peterson & Clemens 1998).
In this short article, we present evidence for small, isolated dark clouds in the Large Magellanic Cloud, discovered serendipitously through Hubble Space Telescope imaging, which are likely counterparts to the Galactic Bok globules. Although the amount of information we have is limited, we describe some derived properties of the LMC globules. Because these objects are all at a well-constrained distance, Bok globules in the Magellanic Clouds provide an opportunity to determine the ensemble properties of globules and their embedded protostars, as well as the connection between the globules and the local environment.
2 Observations
The images discussed here were obtained as part of a parallel imaging program of diffuse ionized gas in the Magellanic Clouds; a complete description of the program goals and the data obtained is given in Walsh et al. (1998, in preparation). All of the images were obtained with the WFPC-2 camera on HST. Of the four fields in which globules were found, all four were imaged with the F656N filter (H), three were imaged in F675W (R band equivalent), three were observed in F547M (emission-free V band), and two in F502N ([O III]). For this paper we discuss only the F656N images, which have the highest signal/noise. The broad-band images are short exposures intended only to identify continuum sources in the F656N band, while the [O III] images are generally less well-exposed than the H images. Total exposure times for the H images ranged from 1800 to 5000 seconds. Table 1 gives a journal of the H images and the positions of the fields. For a distance of 50 kpc to the LMC (Panagia et al. 1991), we can resolve structures as small as 0.05 pc (0.2).
All of the images were pipeline-processed with the most appropriate calibration files. We mosaiced and registered the individual exposures for each separate field when necessary, then combined them by averaging with the gcombine task in STSDAS, using the ‘crreject’ option to remove radiation hits. We generally had only two or three H exposures per field, so CR rejection was not perfect with the long exposure times involved. We did not apply a correction for charge transfer efficiency effects; the dust globules are very small-scale objects, and in general H emission was present at an average signal level of at least a few DN all across the images, so CTE effects are not expected to exceed a few percent across each chip.
3 Identification and Properties of Globules
3.1 Criteria for Identification
Clemens & Barvainis (1988; hereafter CB88) presented a set of relatively specific criteria for identifying a dark cloud as a Bok globule: (1) small size ( 10′ for Milky Way globules); (2) relative isolation, that is, not part of larger dust complexes; (3) no constraint on ellipticity. In compiling their catalog of small molecular clouds, they rejected dense cores of larger clouds, as well as stringy, filamentary dust clouds (which were considered unlikely to be hosts for collapsing protostars).
We employ the CB88 identification criteria to determine what dust clouds in our images qualify as candidates for Bok globules. Some comments on the identification process are required, however. First, there is an obvious scale difference between the Galactic objects and LMC candidates. CB88 presented two arguments favoring an average distance of about 600 pc for the Galactic Bok globules. At a distance of 50 kpc, LMC objects could be expected to be smaller by about a factor of 80. The globules in the CB88 catalog range in angular size from 1′ to 10′, with a mean size of 4′, but with a strong peak at 1-2′. Direct scaling to the LMC distance thus implies angular sizes less than 7-10, with most of the objects around 1 in size. Second is that ‘isolation’ is not always obvious in our LMC images: it becomes clear from examination that we are looking at multiple overlapping structures, and more than one dust structure may be found along a given line of sight. Related to this is the possibility that the LMC H emission may have components both foreground and background to a dust globule, and in many cases a globule may be largely washed out by foreground emission line gas. Thus, although we see many structures that may in fact be globules, for this paper we point out only the most obvious structures. Deep continuum imaging and future millimeter-wave interferometer studies may find many more Magellanic Cloud globules.
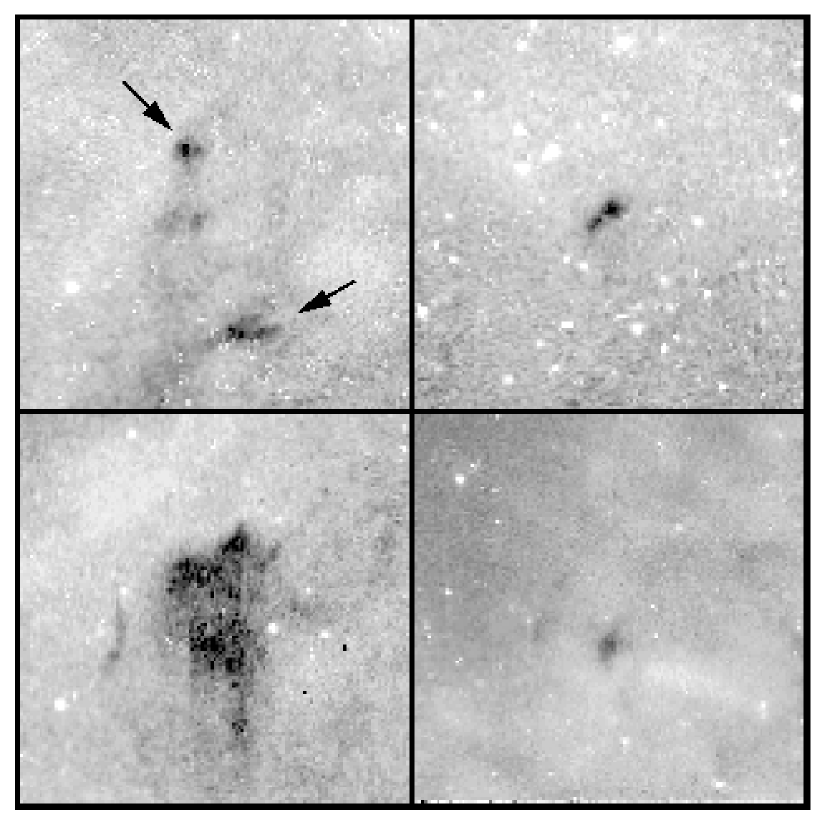
Within these guidelines, we identify five small dust clouds which appear to be excellent candidates to be Bok globules. We list these candidates in Table 2 and show an atlas of them in Figure 1. The coordinates for the rough center of each globule listed in the table were obtained using the ’metric’ task in STSDAS. The sizes that we list are approximately the FWHM along the major and minor axes; these are only approximate because the globules do not always show symmetric profiles and can be affected by foreground H emission.
3.2 Optical Depths and Extinction Estimates
For these five globules, we provide estimates in Table 2 for the peak absorption optical depth in the F656N band, determined from the relation
| (1) |
This estimate is affected by a number of sources of contamination. Our H images in general show emission at some level all across each field, and we are unable to identify blank regions to subtract the background, which arises from several sources. First, there is the contribution from the foreground Galactic and zodiacal light, as well as possible contamination from geocoronal H. To estimate the contribution from these sources, we examined deep FOS spectra of a blank sky field at 2h 59m 47s, 20∘ 13′ 06, taken with the G570H grating (program GO-5968; PI Freedman). The total 8800 second exposure yielded a surface brightness within the F656N bandpass of about 710-17 ergs cm-2 s-1 arcsec-2. This converts to a count rate of about 1.110-3 counts per second per pixel in the WFPC-2 images. In comparison, the WFPC-2 Exposure Time Calculator predicts a background count rate of 910-4 counts per second per pixel at the blank sky position, and 710-4 at our LMC positions. For our purposes, we use a background count rate of 10-3 counts per second per pixel, with an uncertainty of 50%. This contributed less than 10% to the observed H signal. We scaled the countrates by the effective exposure times of our averaged images and subtracted the background before computing the optical depth. A second source of contamination is foreground H within the LMC. It is apparent in some cases that there is H emission in front of the dust globules, which will cause us to underestimate the optical depth. We make no correction for such emission but note that it is likely to be present, and we treat the optical depths as lower limits only.
Our lower limits for (6563) correspond to lower limits on the visual extinction of 1.5-3 magnitudes, based on the Galactic extinction curve for = 3.1 (Cardelli, Clayton, & Mathis 1989); at the wavelengths considered, the Galactic extinction curve is sufficiently similar to the LMC curve, especially for small values of extinction. On the other hand, the nature of dust grains in metal-poor environments such as the LMC is not well known. This is an area greatly needing future investigation.
As expected, our derived values for are significantly lower than those obtained for Galactic globules from star counts. It is likely that diffuse foreground H emission, which is seen all across our F656N images, contributes significant emission in the cores of the globules. A deep broad-band continuum study would be better suited for estimating accurate extinctions within these clouds.
3.3 Estimates of Globule Masses
We can estimate roughly the masses of the LMC globules by extrapolating the properties of Galactic globules. Clemens, Yun, & Heyer (1991) inferred an average H2 number density N(H2) 103 cm-3 from millimeter studies of CO in Galactic Bok globules. If we approximate the LMC clouds as spheres with a radius = , (where and are the semi-major and semi-minor axes as obtained from the sizes listed in Table 2), and if we assume the LMC clouds have the same average H2 density as Galactic globules, we obtain the cloud masses listed in Table 2. The masses range between 0.3 and 80 solar masses, with four of the five clouds under one solar mass. In comparison, Clemens et al. (1991) found a range of 0.6 to 200 solar masses for the Galactic sample, with an average mass of about 11 M☉. It is possible we may underestimate the LMC globule masses somewhat if foreground H emission causes us to underestimate the angular sizes of the clouds. For example, underestimating the sizes of the smallest globules by only 25% (abut 2 WFC pixels) would lead us to underestimate their masses by a factor of two. Again, deep broad-band imaging could reduce the uncertainty.
The discrepancy between the typical masses for our LMC globules and the Milky Way globules is curious, and may bring the assumed density into question. If we use our estimated extinctions and the diffuse gas N(H)/E(BV) ratio for the LMC (Fitzpatrick 1985, Koorneef 1982), we obtain densities and masses about an order of magnitude larger than those listed in Table 1. On the other hand, it is likely that our estimated extinctions are severe underestimates, and it is not clear that the diffuse gas dust/gas ratio should be applicable to dark clouds. Note that the four small clouds in our LMC sample would be among the smallest objects in the CB88 sample and thus might be expected to have small masses as well. We also note that the recent distance estimate for the Milky Way globule CB24 (Peterson & Clemens 1998) results in a mass estimate only one-fifth of that based on the estimated average distance of 600 pc. It may be that many galactic globules have quite low masses as well. The mass function of LMC globules will become better defined as more globules are detected in high resolution images.
3.4 Space Density of LMC Globules
We can estimate crudely the number of small globules that might exist in the LMC from the surface density of detected globules. We detected five small globules in four WFPC2 fields, which cover an angular area of 23 square arcminutes. At a distance of 50 kpc, this translates to a globule surface density of approximately 1000 per kpc2 (not corrected for the LMC’s inclination). If we assume that the small globules are distributed over the full 50 square degrees of the main body of the LMC, we would predict a total of 4104 LMC globules. For comparison, Clemens et al. (1991) estimated a total of 3.2105 small globules in the Milky Way, corresponding to a surface density of about 400 globules per kpc2 within 15 kpc of the galactic center. Thus, the simplest calculation leads us to estimate that the LMC is forming globules at about twice the rate per unit area as the Galaxy. By coincidence, this is also the ratio of the estimated star formation rates per unit area for the two galaxies (R. C. Kennicutt, private communication).
One could easily question some of the assumptions behind this simple estimate. First, we have already noted that our sample is biased toward the most obvious globules. We could be missing many objects because of low contrast due to the strong foreground emission in this area. On the other hand, there is no evidence that globules should be distributed homogeneously across the LMC main body. It may be that such structures are largely located in the region of dark clouds/molecular gas and strong star formation in the vicinity of 30 Doradus, where our fields are located. Hodge (1988) cataloged 146 dark clouds in the LMC based on CTIO 4m prime focus photographic plates. However, 115 of these clouds were located in two fields at the east end of the LMC bar, near 30 Dor. If we assume that small globules are preferentially located in these fields (covering a little over one square degree), we would predict about 1000 globules would be found in the LMC. Therefore, although the coincidence between the ratios of globule surface densities and star formation rates is intriguing, the numbers are too uncertain at present to interpret reliably. As more fields are imaged, the estimated number of globules in the LMC will improve greatly.
4 Other Dust Structures
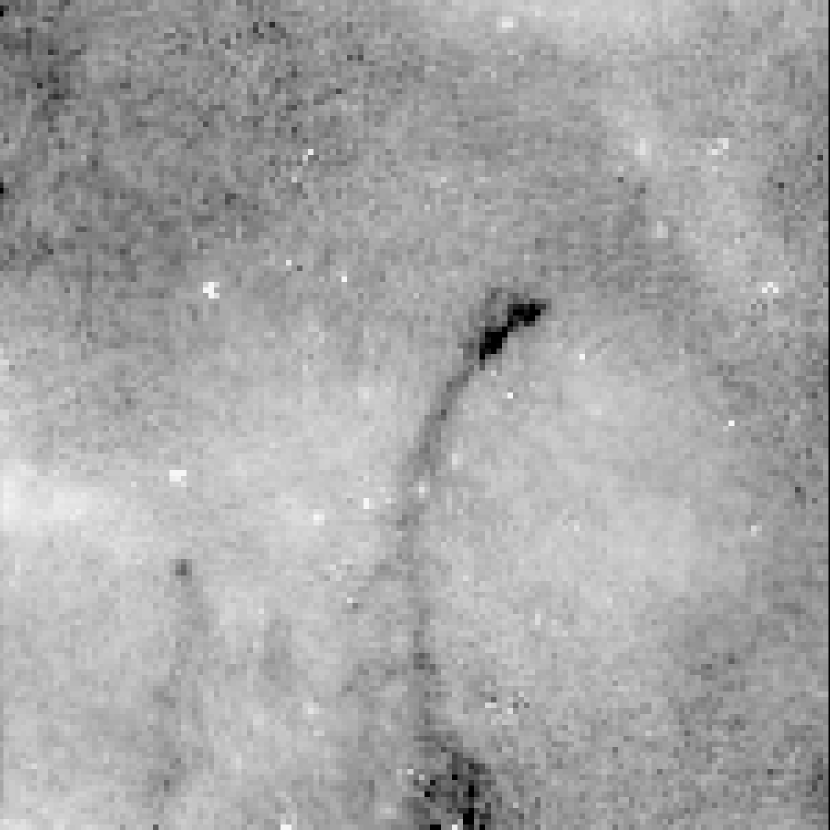
Figures 2 and 3 show a number of other structures which are analogous to structures observed in Galactic dust clouds. Figure 2 shows an “elephant trunk” structure in the same field as globule BGJ053933-691338. This feature is about 12 (about 3 pc) long, but only about 0.1 pc wide in its narrowest parts. Such coherent dust structures are thought to be clouds stretched out by the interaction between the dark clouds and a less dense flow of neutral or ionized gas past the cloud (e.g., Schneps, Ho, & Barrett 1980), although magnetic fields may play an important role as well (Carlqvist, Kristen, & Gahm 1998).
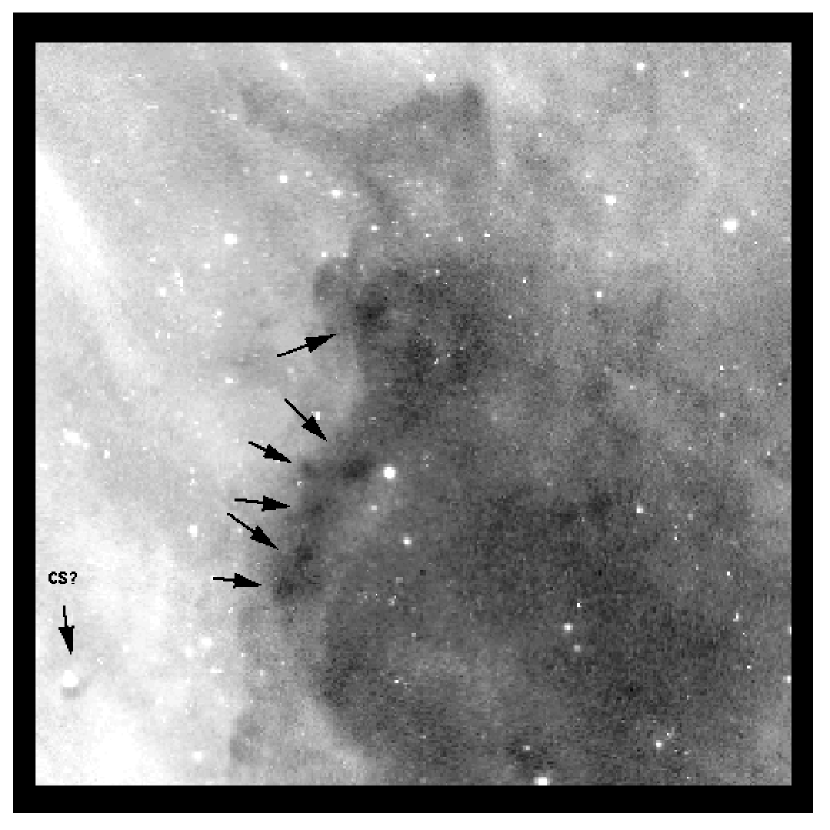
Figure 3 shows a larger dust cloud, in the same field as BGJ053615-691822, which shows evidence for several dense clumps, similar in size to the isolated globules. This may be a molecular cloud with multiple cores that will eventually become a cluster of stars. It is interesting that the densest clumps appear to be on a side of the dark cloud that is sharply defined by a photoionized edge. This may be a case in which gravitational collapse is organized and possibly triggered by the mechanical and radiation energy from the hot massive stars that are responsible for the ionized gas. A survey for IR and millimeter sources in this region could prove interesting. It is also interesting to note that to the lower left of this cloud in Figure 3 is a star which is immediately adjacent to a small, arc-shaped dust cloud. This star could be a very young star that has just broken out of its dusty cocoon.
5 Discussion
It is very likely that the small globules described in this paper are the smallest dust structures ever detected in any galaxy other than the Milky Way. The smallest dust structures detected by Hodge (1988) in the LMC were about 2 pc across, about 10 at the distance of the LMC. The high-resolution imaging capability of has allowed us to push this scale down another factor of ten. At this spatial scale the complexity of the structure for both emission and dust absorption in the LMC becomes very evident. Hodge (1988) noted the difficulty of detecting dark clouds against a faint and variable background. This is also true of our WFPC images, to which we add the confusion caused by overlapping structures and the low contrast due to foreground emission. Hodge also noted a curious lack of correspondence between CO emission (Cohen et al. 1988) and dark clouds in some parts of the LMC. This may reflect partly the low resolution of the CO surveys, but it also suggests that both visual surveys for dark clouds and CO emission studies are necessary to characterize the population of dark clouds in galaxies.
In many ways the parallel imaging shows that the structure of the ISM and dust clouds in the LMC is very similar to that observed in the Galaxy. We see in our LMC fields many of the same dust structures that have been identified in the Galaxy, and the tentative inferred properties of those structures appear to be similar to those of their Galactic counterparts, although the estimated masses appear to be a bit low.
Future studies of globules in the Magellanic Clouds are of importance for understanding star formation in very different environments from the Milky Way. The Clouds are at comparatively well-determined distances, and so the ensemble properties of LMC and SMC globules in principle could be well constrained with high-resolution infrared and millimeter studies. Potentially interesting future observations include high resolution K-band imaging surveys for protostars within the globules. The near-IR sources discovered by Yun & Clemens (1994) in Galactic Bok globules have K-band magnitudes between 6 and 13. Assuming an average distance of 600 pc for the Galactic objects, the same near-IR sources would have K = 16-23 in the Magellanic Clouds. Deep IR imaging of LMC and SMC globules, especially with future 8-m class telescopes or HST, will likely detect embedded protostellar sources if they exist. Such observations will begin to constrain the properties of low-mass protostars in the Magellanic Clouds.
High resolution ( 1 or better) molecular line observations would also be of great interest for density and mass determinations, from which the mass function of globules could be derived. This would help provide a refined estimate of the star formation efficiency in globules, and may facilitate comparisons between isolated globules and the embedded dark cores in larger clouds. Also of interest is whether the lower dust-to-gas ratios in the Magellanic Clouds systematically affects the properties of globules compared to their Galactic counterparts. The lower dust-to-gas ratio leads to greater penetration of UV radiation into the dark clouds, affecting the cloud structure. This is one suggested cause for the lower I(CO)/N(H2) ratios observed in the Magellanic Clouds and other dwarf irregulars (Poglitsch et al. 1995; Israel et al. 1996; Madden et al. 1997), and may lead to evaporation of small dark clouds. Measurements of velocity widths should show whether the LMC globules are virialized and stable or expanding and evaporating. Finally, the largely unobscured view of the structure of the Magellanic Clouds allows one to examine the isolated globules in the context of large-scale star formation and the relation to other dark cloud structures.
References
- (1)
- (2) Bok, B. J, & Reilly, E. F., 1947, ApJ, 105, 255
- (3)
- (4) Cardelli, J. A., Clayton, G. C., & Mathis, J. S., 1989, ApJ, 345, 245
- (5)
- (6) Carlqvist, P., Kristen, H., & Gahm, G. F., 1998, A&A, 322, L5
- (7)
- (8) Clemens, D. P., & Barvainis, R. E., 1988, ApJS, 68, 257
- (9)
- (10) Clemens, D. P., Yun, J. L., & Heyer, M. H., 1991, ApJS, 75, 877
- (11)
- (12) Cohen, R. S., Dame, T. M., Garay, G., Montani, J., Rubio, M., & Thaddeus, P., 1988, ApJ, 331, L95
- (13)
- (14) Fitzpatrick, E. L., 1985, ApJ, 299, 219
- (15)
- (16) Hodge, P., 1988, PASP, 100, 346
- (17)
- (18) Israel, F. P., Maloney, P. R., Geis, N., Herrmann, F., Madden, S. C., Poglitsch, A., & Stacey, G. J., 1996, ApJ, 465, 738
- (19)
- (20) Keene, J., Davidson, J. A., Harper, D. A., Hildebrand, R. H., Jaffe, D. T., Loewenstein, R. F., Low, F. J., & Pernic, R., 1993, ApJ, 274, L43
- (21)
- (22) Koorneef, J., 1982, A&A, 107, 247
- (23)
- (24) Madden, S. C., Poglitsch, A., Geis, N., Stacey, G. J., & Townes, C. H., 1997, ApJ 483, 200
- (25)
- (26) Panagia, N., Gilmozzi, R., Macchetto, F., Adorf, H.-M., & Kirshner, R. P., 1995, ApJ 380, L23
- (27)
- (28) Peterson, D. E., & Clemens, D. P., 1998, AJ, 116, 881
- (29)
- (30) Poglitsch, A., Krabbe, A., Madden, S. C., Nikola, T., Geis, N., Johansson, L. E. B., Stacey, G. J., & Sternberg, A., 1995, ApJ 454, 293
- (31)
- (32) Reipurth, B., Heathcote, S., & Vrba, F., 1992, A&A, 256, 225
- (33)
- (34) Schneps, M. H., Ho, P. T. P., & Barrett, A. H., 1980, ApJ, 240, 84
- (35)
- (36) Yun, J. L., & Clemens, D. P., 1990, ApJ, 365, L73
- (37)
- (38) Yun, J. L., & Clemens, D. P., 1992, ApJ, 385, L21
- (39)
- (40) Yun, J. L., & Clemens, D. P., 1994, AJ, 108, 612
- (41)
- (42) Yun, J. L., & Clemens, D. P., 1995, AJ, 109, 742
- (43)
- (44) Zhou, S., Evan, N. J. II, Koempe, C., & Walmsley, C. M., 1993, ApJ, 404, 232
- (45)
| Observation ID | RA (J2000) | Dec (J2000) | Exposure Time |
|---|---|---|---|
| field 1: | |||
| U29J1W01T | 5:37:00.02 | 69:07:21.28 | 900s |
| U29J1X01T | 5:37:00.02 | 69:07:21.28 | 900s |
| field 2: | |||
| U2OR1V01T | 5:37:55.79 | 69:17:18.35 | 2200s |
| U2OR1Z01T | 5:37:55.92 | 69:17:19.97 | 1600s |
| field 3: | |||
| U3820Q01T | 5:39:35.88 | 69:12:40.56 | 1700s |
| U3820R01T | 5:39:35.53 | 69:12:39.97 | 1400s |
| U3820S01T | 5:39:35.53 | 69:12:34.56 | 1100s |
| field 4: | |||
| U3820Z01R | 5:36:12.02 | 69:19:36.86 | 2200s |
| U3821101R | 5:36:12.02 | 69:19:36.86 | 1400s |
| U3821102R | 5:36:12.02 | 69:19:36.86 | 1400s |
| Object | Coordinates | Ang. Size | Linear Size | Peak | Est. Mass |
|---|---|---|---|---|---|
| (J2000) | (arcsec) | (parsecs) | (6563) | (M☉) | |
| BGJ053703-690616 | 5:37:02.66 69:06:16.2 | 0.7x0.9 | 0.2x0.2 | 1.2 | 0.3 |
| BGJ053702-690610 | 5:37:02.38 69:06:10.3 | 0.8x1.6 | 0.2x0.4 | 1.1 | 0.8 |
| BGJ053805-691813 | 5:38:05.13 69:18:13.0 | 0.7x0.9 | 0.2x0.2 | 1.5 | 0.3 |
| BGJ053933-691338 | 5:39:32.76 69:13:37.7 | 4.2x7.1 | 1.0x1.8 | 2.4 | 80 |
| BGJ053615-691822 | 5:36:14.94 69:18:22.3 | 0.6x1.2 | 0.2x0.3 | 2.0 | 0.5 |