FIRBACK FAR INFRARED SURVEY WITH ISO:
DATA REDUCTION, ANALYSIS AND FIRST RESULTS
H. Dole1, G. Lagache1,
J-L. Puget1, R. Gispert1,
H. Aussel,
F.R. Bouchet3,
C. Ciliegi4,
D.L. Clements5, C.J. Cesarsky2,
F.-X. Désert6, D. Elbaz2,
A. Franceschini7,
B. Guiderdoni3, M. Harwit8,
R. Laureijs9, D. Lemke10,
R. McMahon11, A.F.M. Moorwood12,
S. Oliver13, W.T. Reach14,
M. Rowan-Robinson13, M. Stickel10
1Institut d’Astrophysique Spatiale, Orsay, France
2Service d’Astrophysique, CEA/DSM/DAPNIA Saclay, France
3Institut d’Astrophysique de Paris, France
4Osservatorio Astronomico di Bologna, Italy
5Cardiff University, UK
6Laboratoire d’Astrophysique, Observatoire de Grenoble, France
7Osservatorio Astronomico di Padova, Italy
8511 H.Street S.W., Washington, DC 20024-2725
9ISOC ESA, VILSPA, Madrid, Spain
10MPIA, Heidelberg, Germany
11Institute for Astronomy, University of Cambridge, UK
12ESO, Garching, Germany
13Imperial College, London, UK
14IPAC, Pasadena, CA, USA
Abstract
FIRBACK is one of the deepest cosmological surveys performed in the far infrared, using ISOPHOT. We describe this survey, its data reduction and analysis. We present the maps of fields at 175 . We point out some first results: source identifications with radio and mid infrared, and source counts at 175 . These two results suggest that half of the FIRBACK sources are probably at redshifts greater than 1. We also present briefly the large follow-up program.
Key words: ISO; ISOPHOT; far infrared survey; cosmology; galaxy evolution
1. INTRODUCTION
The discovery of the Cosmic Far Infrared Background Radiation (CFIBR) (??,
??, ??, ??) using COBE data and constraints
on its spectrum, demonstrates that about two thirds of the light emitted by galaxies
integrated over all redshifts has been processed by dust and released at FIR and
submm wavelengths. This background is in line with models using strong evolution of galaxies.
Studying the population of galaxies radiating mostly at long wavelengths as a function
of redshift is thus one of the important but difficult observational tasks of today
in the field of galaxy formation and evolution (see Puget & Lagache, this volume).
In this context, FIRBACK, which is a cosmological survey dedicated to a study
of the Cosmic Far Infrared Background and galaxies contributing to it,
is one important step.
2. DATA SET
FIRBACK is a survey of 3 main fields (described in Table 1) covering
4 square degrees using ISOPHOT.
All fields have been observed in raster mode (AOT P22) with the C200
detector and C_160 filter centered at . We
have also additional ISO observations with ISOPHOT and ISOCAM (see below).
| Field Name | l | b | area | ||
|---|---|---|---|---|---|
| h min | deg min | deg | deg | sq deg | |
| Marano | 03 11 | -54 45 | 270 | -52 | 1 |
| ELAIS N1 | 16 11 | +54 25 | 84 | +45 | 2 |
| ELAIS N2 | 16 36 | +41 05 | 65 | +42 | 1 |
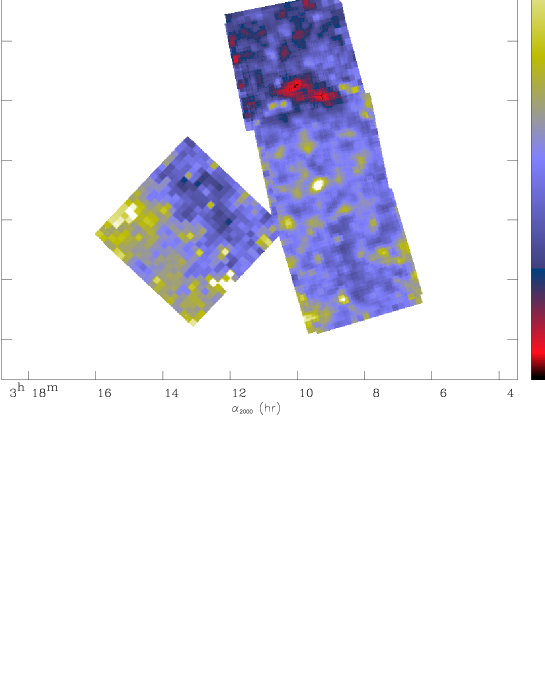
FIRBACK Marano
This area (map Figure 1) is composed of four individual fields, called Marano 1, 2, 3 and 4, which have been observed four times. The redundancy goes from 32 (in overlaping regions) to 1 (on the edges) with an average of 16, and the oversampling is optimal in both Y and Z directions in Marano 2, 3 and 4 (half pixel offset between rasters). Marano 1 covers , and Marano 2, 3 and 4 about . Integration time per sky pixel is 256 s on average. Additional observations: in Marano 1 we have one P25 absolute measurement, five small rasters at 90 (not yet reduced); in the complete Marano field, we have a 15 ISOCAM survey.
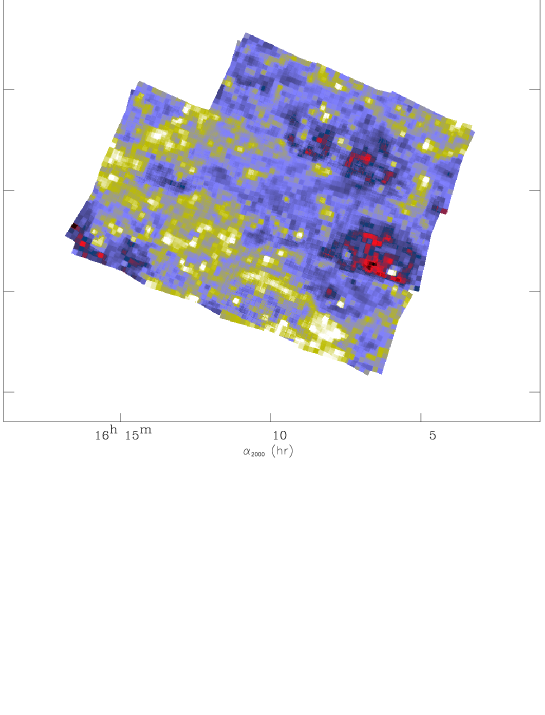
FIRBACK ELAIS N1
This area (map Figure 2) is composed of eleven individual fields, observed 2 times with an offset of less than a pixel, and the redundancy goes from 16 (in overlaping regions) to 1 (on the edges) with an average of 8. ELAIS N1 covers about 2 square degrees. Integration time per sky pixel is 128 s on average. Note that the northern FIRBACK fields have been choosen to cover some corresponding ELAIS fields at other wavelengths (see Rowan-Robinson et al., this volume).
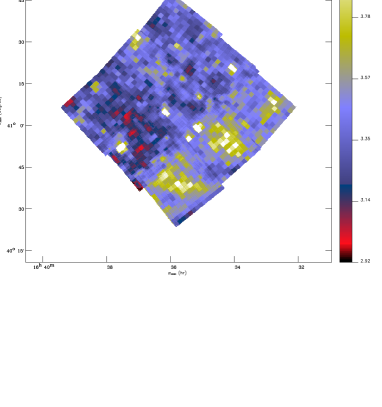
FIRBACK ELAIS N2
This area (map Figure 3) is composed of nine individual fields, observed 2 times with an offset of one pixel, so the redundancy is 8 on average, without oversampling. ELAIS N2 covers about .
3. DATA REDUCTION
3.1. From Raw Data to AAP
We used PIA111PIA is a joint development by the ESA Astrophysics Division
and the ISOPHOT Consortium version 7.2.2 (Phot Interactive Analysis,
?? ) to reduce data from ERD (Edited Raw Data, the lowest level)
to AAP (Auto Analysis Product Data, level where flux density and positions
are available):
- ERD to SRD (Signal per Ramp Data): linearisation, deglitching, fit ramps to first order
- SRD to SCP (Signal per Chopper Plateau Data): deglitching, no drift correction
- SCP to AAP: no reset interval correction (reset times are identical), subtraction of
dark current, power calibration using interpolation between 2 FCS.
We then used our own IDL routines to correct for transients induced by strong glitches,
and to perform a flat correction using observational redundancies.
3.2. Map Projection
Our basic data projection is performed in two steps: (1) geometrical grid computation and
(2) projection of
the signal.
- The first step is the most time consuming. We read all AAP
data of one complete field, and create a large grid in with tunable
pixel sizes (usually 10 arcsec); this
step has to be performed just one time.
- The second step just acts to restore the grid, to coadd individual raster data onto
the grid by distributing the pixel signal in the area of one pixel, and by updating a
weighting map.
This method is well-suited to large amounts of data, in terms of sky surface or
number of co-added rasters with different roll angles.
Figures 1, 2 and 3 show such maps.
4. RESULTS
4.1. Source Detection
Source detection is directly performed on final co-added maps, using eye recognition to discriminate point sources from cirrus structure. We then computed the flux by aperture photometry with radii choosen to minimize noise in source detection and (??).
4.2. Catalogs and Identifications
Sources in our catalog have a S/N ratio greater than 3, and photometric accuracy is about 30 %.
Fluxes are in the range 75 mJy to 1.6 Jy, with an average of 252 mJy and a median of 175 mJy.
In order to constrain both Spectral Energy Distribution (SED) and position of these sources,
we looked for identifications:
Table 2 gives a summary of detected sources and identifications with
ISO or ground-based radio telescopes.
In the Marano Field, we performed a smaller 15 survey using ISOCAM
(??), which covers about 50 % of the 175 survey surface.
Radio identifications are performed using Australia Telescope Compact Array
available data (??) or preliminary data of our program being reduced,
that is why 8 identifications is a lower limit.
The situation is different in northern fields ELAIS N1 & N2 because
the ELAIS consortium performed observations using ISO at 15 ,
90 (Rowan-Robinson et al., this volume), using the VLA at 20
(??), and at other wavelengths.
Most of the 31 sources with 90 counterpart have a color ratio
, which has to be
compared to local sources () where
(??),
suggesting that a significant proportion of FIRBACK sources are large-redshift
sources (see discussion below).
Most of NED222The NASA/IPAC Extragalactic Database (NED)
is operated by the Jet Propulsion Laboratory, California Institute
of Technology, under contract with the National Aeronautics and
Space Administration identifications are FIRST (??)
or IRAS sources.
| Field Name | 175 | 15 m | 90 m | 20 cm |
|---|---|---|---|---|
| 75 | 1 | 60 | 0.2 | |
| Marano | 78 | 29 | no data | |
| ELAIS N1 | 113 | 19 | 18 | 20 |
| ELAIS N2 | 85 | no data | 13 | 22 |
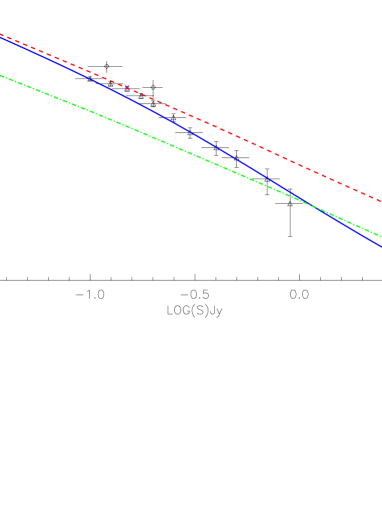
4.3. Source Counts
We present raw source counts in Figure 4, using sources coming
from FIRBACK ELAIS N1, N2 and Marano 2 3 4 fields (208 sources brighter
than 100 mJy in less than 3 square degrees). Raw counts means here that
counts are not corrected for incompleteness.
For , counts are not expected to change a lot
due to incompleteness correction, so the steep slope of 2.20 is a minimum.
We also plotted Marano 1 raw counts (??) which are higher
by a factor 2 but compatible within uncertainties, probably because based
on 22 sources in a smaller area (0.25 square degree), Kawara et al. (1998)
data in the Lockman Hole (difficult to see in the plot because their count
at 150 mJy gives the same number as ours), models with and without
evolution from Franceschini et al. (1998), and model E from Guiderdoni et al. (1998).
Compared to extrapolated IRAS counts, FIRBACK counts are about
20 times higher at 200 mJy. Our counts are not compatible with
non-evolution models and need strong evolution. Model with
evolution from Franceschini et al. (1998) predicts smoother slopes than
observed, whereas model E from Guiderdoni et al. (1998) fits roughly
the slope even if lower than observed.
5. FOLLOW-UP 333extended FIRBACK collaboration for follow-up also includes: D. Benford, P. Cox, M. Dennefeld, G. Helou, R. Mac Mahon, A. Omont, F. Pajot, T. Phillips, D. Scott, F. Viallefond
An intensive multiwavelength follow-up program is being performed.
In the Marano field, we are following-up at = 20 cm
using the Australia Telescope Compact Array in compact configurations
(data being reduced) and extended configuration (program to submit)(Dole).
In the optical range, one source has been observed with the NTT (Dennefeld).
In the ELAIS N1 & N2 fields at millimetre wavelengths,
we are following-up using the IRAM 30 m antenna and Plateau de
Bure Interferometer (Omont & Guiderdoni). Submillimetre observations
in N1 are scheduled at JCMT (Scott) and in April at CSO (Lagache),
and optical follow-up of sources is performed at Palomar (Reach).
6. DISCUSSION ON COSMOLOGICAL IMPLICATIONS
6.1. Population
The steep slope of the number counts ( 2.2) cannot be accounted
for by the effect of the K-correction (ratio, at a given wavelength,
of the emitted flux and the observed flux with a spectral redshift)
if no cosmological evolution is present as can be seen in Figure 4.
The Guiderdoni et al. (1998) model which gives rather a good fit to our
counts presents a strong evolution for the star burst component
() and an ULIRG (Ultra Luminous Infrared Galaxies)
component. In this model, the far infrared background comoving
luminosity per unit volume increases by a factor of 20 from to .
This model also predicts a redshift distribution for sources
brighter than 100 mJy at 175 . The redshift distribution
peaks at with a median of , about half of
the sources lie at redshift between 1 and 2, and about 10% above .
Furthermore, this model is compatible with the far infrared
backgound detected in the COBE data. Sources detected in our
survey account for 3% of this background at 175 ,
and the model predicts that 90% of the background is made
of sources brighter than 2 mJy; this predicted value is probably
too low, because our slope is higher than the model, and our counts
are not yet corrected for incompleteness.
6.2. Identifications
If these galaxies are star burst galaxies with a SED peaking at 75 ,
a typical source observed close to our detection limit
( mJy) has a luminosity
(in a and cosmology).
The same source will have mJy and thus is
easily detectable with ISOCAM. One of the differences between
mid- and far-infrared observations is that the K-correction
allows observation of galaxies with redshifts in general below
1.4 (because of the PAH feature’s cutoff) in the mid infrared;
no such strong limit exists in the far infrared.
We have only 25% detections at 15 , implying that more
than half of the sources are at
(redshift at which 15 flux drops sharply).
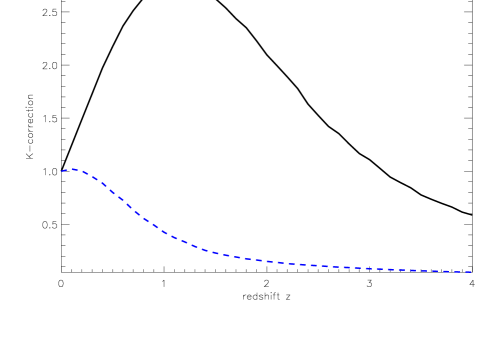
The expected 90 flux for this source is mJy,
and thus not easily detectable in the ELAIS survey. Futhermore,
the K-correction at 90 and 175 as function
of redshift (Figure 5) shows that between
redshifts and the ratio
grows from
6 to 14: at a similar galaxy has 14 times more flux
at than at .
The non-thermal emission is known to be strongly correlated
with the FIR emission for starburst galaxies (e.g ??),
even if Sanders & Mirabel (1996) show an important scatter in the correlation.
With ELAIS VLA identifications (42 sources), we compute
(we take for and not
a combination of and )
the FIR to 1.4 GHz log ratio. For 70 % of our sample
, and for 30 %; the dispersion
is significant and must be taken into account for deep radio observations.
7. CONCLUSION
We presented the FIRBACK 175 survey, data reduction and analysis.
Identifications of sources at various wavelengths, color ratios and
source counts suggest that half of the sources are at redshifts
greater than 1. Following-up these sources in order to have
better positional accuracies, and SED constraints is now the
key for understanding this population of dust enshrouded galaxies.
Additional information, images and papers are available online
at http://wwwfirback.ias.fr+
“psection–ACKNOWLEDGMENTS˝ We would like to thank M.A. Miville-Desch“^enes for his courtesy in permitting use of his image printing program, and C. Gabriel for fruitful discussions at ESA’s ISO Data Centre (IDC) at Vilspa, Spain.
“begin–thebibliography˝–˝
“bibitem[“protect“astroncite–Becker et al.˝–1995˝]–becker95˝ Becker, R.H., et al. 1995, ApJ, 450, 559
“bibitem[“protect“astroncite–Ciliegi et al.˝–1998˝]–ciliegi98˝ Ciliegi, C. et al. 1998, astro-ph/9805353
“bibitem[“protect“astroncite–Condon,˝–1992˝]–condon92˝ Condon, J.J., 1992, Annu. Rev. A. A. 30, 575
“bibitem[“protect“astroncite–D“’esert et al.˝–1998˝]–desert˝ D“’esert, F-X. et al. 1998 A“&A, astro-ph/9809004
“bibitem[“protect“astroncite–Elbaz et al.˝–1998˝]–elbaz98˝ Elbaz, D. et al. 1998, astro-ph/9807209
“bibitem[“protect“astroncite–Fixsen et al.˝–1998˝]–fixsen98˝ Fixsen, D.J., et al. 1998, ApJ, 508, 123
“bibitem[“protect“astroncite–Franceschini et al.˝–1998˝]–franc98˝ Franceschini, A., et al. 1998, MNRAS 296, 709
“bibitem[“protect“astroncite–Gabriel et al.˝–1997˝]–gabriel97˝ Gabriel, C. et al. 1997, Proc. of the ADASS VI conf., ASP Conf. Ser., Vol.125, p108
“bibitem[“protect“astroncite–Gruppioni et al.˝–1997˝]–grup97˝ Gruppioni, C. et al. 1997, MNRAS, 286, 470
“bibitem[“protect“astroncite–Guiderdoni et al.˝–1998˝]–guider98˝ Guiderdoni, B. et al., 1998, MNRAS 295, 877
“bibitem[“protect“astroncite–Hauser et al.˝–1998˝]–hauser98˝ Hauser, M.G., et al. 1998 ApJ, 508, 25
“bibitem[“protect“astroncite–Helou et al.˝–1985˝]–helou85˝ Helou, G., et al. 1985, ApJ, 298, L7
“bibitem[“protect“astroncite–Kawara et al.˝–1998˝]–kawara98˝ Kawara, K., et al. 1998, A“&A 336, L9
“bibitem[“protect“astroncite–Lagache et al.˝–1999˝]–lagache99a˝ Lagache, G., et al. 1999, A“&A, in press, astro-ph/9901059
“bibitem[“protect“astroncite–Puget et al.˝–1996˝]–puget96˝ Puget, J.L., et al. 1996, A“&A 308, L5
“bibitem[“protect“astroncite–Puget et al.˝–1999˝]–puget99˝ Puget, J.L., et al. 1999, A“&A, in press, astro-ph/9812039
%% “bibitem[“protect“astroncite–Puget,˝–1999b˝]–puget99b˝ %% Puget, J-L., 1999b, in “The Universe as seen by ISO”, 20-23 Oct 98, Paris
%% “bibitem[“protect“astroncite–Rowan-Robinson “textit–et al˝,˝–1999˝]–MRR99˝ %% Rowan-Robinson M. et al. 1999, in “The Universe as seen by ISO”, 20-23 Oct 98, Paris
“bibitem[“protect“astroncite–Sanders “& Mirabel˝–1996˝]–sanders96˝ Sanders, D.B., Mirabel, I.F., 1996, Annu. Rev. Astron. Astrophys. 34, 749
“bibitem[“protect“astroncite–Stickel et al.˝–1998˝]–stickel98˝ Stickel M., et al. 1998, A“&A, 336, 116
“end–thebibliography˝
“onecolumn