Measuring Galactic Extinction: A Test
Abstract
We test the recently published all-sky reddening map of Schlegel, Finkbeiner & Davis (1998 [SFD]) using the extinction study of a region in the Taurus dark cloud complex by Arce & Goodman (1999 [AG]). In their study, AG use four different techniques to measure the amount and structure of the extinction toward Taurus, and all four techniques agree very well. Thus we believe that the AG results are a truthful representation of the extinction in the region and can be used to test the reliability of the SFD reddening map. The results of our test show that the SFD all-sky reddening map, which is based on data from COBE/DIRBE and IRAS/ISSA, overestimates the reddening by a factor of 1.3 to 1.5 in regions of smooth extinction with mag. In some regions of steep extinction gradients the SFD map underestimates the reddening value, probably due to its low spatial resolution. We expect that the astronomical community will be using the SFD reddening map extensively. We offer this Letter as a cautionary note about using the SFD map in regions of high extinction ( mag), as it might not be giving accurate reddening values there.
Accepted by The Astrophysical Journal (Letters)
1 Introduction
Extinction and reddening caused by interstellar dust effects the detected emission from most astronomical sources in the sky. In most galactic and extragalactic studies, especially when studying so called “standard candles,” the effects of dust on the source’s detected brightness and color need to be taken into account. Hence it is very desirable to know the extinction (and reddening) anywhere on the sky.
Recently Schlegel, Finkbeiner and Davis (1998; hereafter SFD) published an all-sky reddening map, based on satellite observations of far-infrared emission (at 100 and 240 µm) from dust. This new reddening map will surely be used by many researchers seeking to apply reddening “corrections” for their work, so it is very important to verify its accuracy and reliability. The SFD map uses data obtained by the DIRBE (Diffuse InfraRed Background Experiment) on board COBE combined with ISSA (IRAS Sky Survey Atlas) images. The COBE/DIRBE experiment had better control of absolute calibration than did IRAS, but a larger beam (0.7°; as compared with 5′ for IRAS). SFD use the DIRBE data to calibrate the IRAS/ISSA images, and, after sophisticated processing, they obtain a full sky map of the 100 µm emission from dust, with point sources and the zodiacal light foreground removed.333See SFD for a full description of their elaborate foreground zodiacal light subtraction technique, point source extraction and overall data reduction. Their resulting reddening map is more accurate and has better resolution ( 6.1′) than the previous existing all sky reddening map of Burstein and Heiles (1978, 1982).
In order to test the extinction map derived from the SFD analysis, we compare it with Arce & Goodman’s (1999; hereafter AG) recent extinction study of a region of the Taurus dark cloud complex. The AG study uses four different techniques to measure extinction along two constant-Right Ascension “cuts” of several degrees in length. The four techniques in AG utilize: 1) the color excess of background stars for which spectral types are known; 2) the ISSA 60 and 100 µm images; 3) star counts; and 4) an optical ( and ) version of the average color excess method used by Lada et al. (1994). The study finds that all four methods give generally similar results, and concludes that all four techniques are reliable ways to measure extinction in regions where mag. In this Letter we compare the extinction map derived from SFD to the AG extinction map which is based on ISSA 60 and 100 µm images in the Taurus region. This comparison provides a test of the reliability of the SFD reddening map for regions of extinction () higher than 0.5 mag.
2 Comparing the two results
In this section we compare the extinction derived from the SFD reddening map (hereafter ) to the extinction AG obtained using the ISSA 60 and 100 µm maps (hereafter ). In order to be consistent, we must compare both methods with the same spatial resolution. As part of their image reduction procedure, SFD convolve the ISSA images with a FWHM=3.2′ Gaussian, which results in ISSA images with 6.1′ resolution. For the purpose of comparing the two extinction maps, we also convolve the AG ISSA images with a FWHM=3.2′ Gaussian, so that both extinction determinations have the same resolution.
When AG compare with the extinction measured with star counting techniques and the average color excess method (techniques 3 and 4 above), they do so by plotting extinction versus declination. The extinction values shown in Figures 3 and 5 of AG are actually traces of the extinction averaged over the 10′ span (in the R.A. direction) of their CCD fields. For consistency we consider the same kind of average, and we obtain the SFD reddening () for the two 10′ wide constant–R.A. cuts of AG and average over Right Ascension. In order to convert from the color excess value given by the SFD maps to visual extinction, we use the equation , where , the ratio of total-to-selective extinction, is equal to 3.1 (SFD; Kenyon et al. 1994; Vrba & Rydgren 1985).
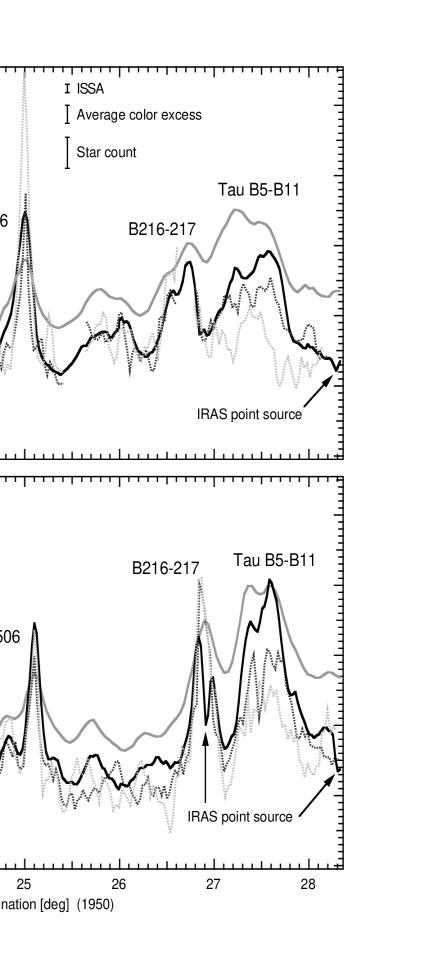
In Figure 1 we plot extinction versus declination for the two constant R.A. cuts in the Taurus dark cloud complex region. In addition to and , we show the extinction traces of the extinction obtained from the average color excess and star count methods of AG, for reference. We will concetrate our discussion on the ISSA (AG) and SFD methods. It can be seen that these two methods trace similar structure in both cuts. The extinction peaks associated with the IRAS core Tau M1 (Wood et al. 1994), the dark cloud L1506, the dark cloud B216-217, and the IRAS cores Tau B5 and Tau B11 (Wood et al. 1994) are easily detected. The 1 error (not including systematics) of is 0.12 mag (AG). SFD quote an uncertainty of 16% in their reddening estimates. For the most part, in regions unassociated with a pronounced peak in extinction, is about a factor of 1.3 to 1.5 larger than . It is also important to note that in regions where there is a peak in the extinction, the value of is closer to that of than in the rest of the trace, and in some of the peaks exceeds .
There are two places where the two traces appear to show very different extinction structures. In both of these places shows a steep dip: one is near the peak associated with B216-217 in cut 2 (around declination 26.9°); and the other is near the end of the cut, around declination 28.3° (see Figure 1). These two regions coincide with the position of IRAS point sources, and will be discussed in more detail further on.
3 Comparison between the two methods
SFD use data from the IRAS and DIRBE experiments to construct a full-sky map of the Galactic dust based on its far-infrared emission. The IRAS data are used as a source of 100 µm flux images, and the DIRBE data are used for absolute calibration and as a source of 240 µm data. SFD derive the dust color temperature using the ratio of 100 to 240 µm emission from DIRBE444Note that deriving dust temperature from a long wavelength color ratio, such as 100/240 µm is superior to using the 60/100 µm ratio, because the effects of both point sources and transient heating of small grains are minimized., and then use this dust color temperature to convert their ISSA-based maps of 100 µm emission to maps of dust column density. As a result of this procedure, the SFD ISSA-based 100 µm emission map has a spatial resolution of 6.1′, but their dust color temperature map has a resolution of 1.4° (Schlegel 1998).
To transform from the map proportional to dust column (hereafter ) to a reddening () map, SFD use the correlation between the intrinsic B V color of elliptical galaxies and the Mg2 line strength. The Mg2 line strength of an elliptical galaxy correlates well with its intrinsic B V color so that the Mg2 line index can be used along with photometric measurements of the galaxy in order to obtain a reasonably accurate measurement of its reddening (Faber et al. 1989). SFD use a procedure where the residual of the B V color versus the Mg2 line index for 389 elliptical galaxies is correlated with the estimated reddening from their maps, using a Spearman Rank method. The resultant fit is then used by SFD to convert from to reddening () at each pixel. We then convert reddening to extinction, using the relation , with (SFD).
In order to obtain their ISSA-based extinction, , AG begin by using ISSA 60 and 100 µm images to obtain a dust color temperature map from the flux ratio at each pixel. This color temperature is then used to convert the observed 100 µm flux to 100 µm optical depth, . As in SFD, the next conversion, from dust opacity to extinction, is tied to a separate technique of obtaining extinction. AG chose to use a method similar to that described in Wood et al. (1994), which itself is ultimately based on work by Jarrett et al. (1989). Jarrett et al. (1989) correlate 60 µm optical depth () with extinction () obtained from star counts, and Wood et al. (1994) multiply the Jarrett et al. values by 100/60 to derive a conversion from to , assuming low optical depth. Thus, using Wood et al.’s technique, AG’s conversion of to ultimately rests on Jarrett et al.’s correlation of 60 µm optical depth with star counts. As described in AG, this correlation is very tight for mag, so we ascribe very little of the uncertainty in to this conversion.
4 The cause of the discrepancy
Arce & Goodman (1999) obtain the extinction toward the Taurus region using four different techniques. All four give similar results in terms of the absolute value and overall structure of the extinction. Most importantly, AG find that agrees well with extinction values obtained by measuring the color excess of background stars for which spectral types are known, which is the the most direct and accurate way to measure reddening (see Figure 2 in AG). So, the question now is why does the SFD method give extinctions which differ from the four determinations of extinction made by AG?
Absolute values. Although data reduction and zero point determination of the emission is very elaborate and accurate in the SFD method, the normalization of the reddening per unit flux density (conversion between and ) seems to overestimate the reddening in regions of high dust opacity. As explained above, SFD use the correlation between intrinsic B V color and the Mg2 line index in elliptical galaxies to convert from dust column density to reddening. It can be seen in Figure 6 of SFD that 90% of the 389 elliptical galaxies they use for the B V vs. Mg2 regression have values of less then 0.1 mag. Moreover it is clear from their Figure 6 that the fit is excellent for values of less than 0.15 mag, but for mag the fit starts to diverge for the few points that exist. Galaxies with mag ( mag) seem to follow a trend leading to reddening values in regions with high dust opacity being overestimated. SFD state that the slight trend in the residual is not statistically significant, but that may be due to the fact that there are so few points with mag.
Figure 6 in SFD shows only two points (galaxies) that have mag. We use the point with mag to asses the amount of overestimation by the SFD method in high reddening regions. Using Figure 6 in SFD and , with , for an extinction of around 1 mag, the SFD method would overestimate the extinction, at 1.31 magnitudes. In fact, by comparing to , we find the overestimation by SFD can be even more than that: when is 1, is typically 1.5. Thus we are convinced that SFD overestimates the reddening value to lines of sights where the extinction is more than 0.5 mag. Such overestimation is due to the fact that in the sample of 389 galaxies most of them have and very few have . This results in an accurate conversion between 100 µm emission and reddening for regions with very low extinction (), but a less accurate conversion where ( mag).
One could argue that the SFD method overestimates the extinction because we overestimate the value of , needed to convert to . We believe that is not so, since several independent studies indicate that the value of in the Taurus dark cloud complex is around 3.1 and that it stays constant through the region for lines of sight in which mag (Kenyon et al. 1994; Vrba & Rydgren 1985). Furthermore, gives very good agreement between and extinction obtained using the color excess of background stars for which spectral types are known (AG).
Structure. In Section 2, we noted that there are certain places where the traces of and differ not only in value but also in structure.
The most dramatic “structural” differences correspond to places where the cuts in Figure 1 intercept IRAS point sources. SFD remove point sources from the ISSA images before they use them, while AG do not. Both AG and SFD assume a single dust temperature for each line of sight. In AG’s determination of , the high 60 µm flux from IRAS point sources transforms into dust with high color temperature, which in turn causes an artificial dip in the extinction (see Wood et al. 1994 and references therein for more on this effect). We can see that SFD have done a good job at removing point sources by noticing that where has artificial dips, traces the real structure (also traced by the other methods in AG). Thus , unlike , is free of any unphysical extinction due to IRAS point sources.
Less dramatic, but more curious, structural discrepancies between the two methods are seen near the extinction peaks in Figure 1. Although is in general larger than by a factor of 1.3 to 1.5, it is important to realize that in some peaks is larger by a factor less than 1.3 and in others it is smaller than . In addition the gaussian-looking extinction peaks traced by are wider than those traced by . Gaussian fits to the peaks associated with Tau M1 and L1506 for both traces in cut 1 show that both peaks traced by have a FWHM wider than those of the peaks traced by by a factor of 1.3. This suggests that in regions of steep extinction gradients the reddening obtained from the SFD map has a lower resolution than the quoted 6.1′.
We believe that this “smearing” in the SFD maps is caused by the difference in resolution between the ISSA flux maps (6.1′) and the COBE-limited color temperature maps (1.4°) employed by SFD. In Figure 2 we plot the 100 µm emission () versus declination for a section of cut 1, where the rise in associated with Tau M1 and L1506 are clearly seen. The plot shows the traces of obtained by SFD () and by AG () averaged over the 10′ width (in R.A.) of the cut. It can clearly be seen that both traces are essentially equal, and that the peaks have the same width and height. Thus it is after both the dust color temperature and have been used together to obtain the extinction, that the SFD method loses spatial resolution. Regions of steep extinction gradients are likely to have temperature gradients, but if the spatial resolution in the dust color temperature is then it is unlikely that these gradients would be detected. If the temperature gradients are not accounted for when calculating reddening, the result is areas with lower effective resolution. Therefore, the fact that SFD use a dust color temperature map with a spatial resolution a factor of 14 larger than the map results in a reddening map which does not have a constant spatial resolution of 6.1′. Unfortunately the DIRBE instrument has a limiting resolution of 1°, so it is not possible to do better with data taken with that instrument.
5 Conclusion
We test the COBE/IRAS all-sky reddening map of Schlegel, Finkbeiner & Davis (1998) using the extinction study of Arce & Goodman (1999). In their study, AG use four different techniques to study the extinction in a region of the Taurus dark cloud complex. All four techniques give very similar results in terms of the value of and the structure in the extinction. Thus the results of AG can be considered a truthful representation of the extinction in this region, and can be used to test the reliability of the SFD reddening map.
We compare the extinction obtained by AG using ISSA 60 and 100 µm images with the SFD reddening map. Our results show that in general the SFD method gives extinction values a factor of 1.3 to 1.5 larger than the extinction obtained by AG. We conclude that SFD overestimates the reddening value to lines of sights where mag. We expect this overestimation is caused by the fact that in the sample of 389 galaxies used to calculate a conversion from dust column density to , 90% of the galaxies have low reddening values () and very few (%) have high reddening () values. The lack of galaxies in high reddening regions results in inaccuracy in the conversion between dust column and reddening for lines of sight with . This bias should be studied in other regions of the sky in order to see how general this trend is. For now we advise that caution be taken when using the SFD all-sky reddening map to obtain reddening (and extinction) values for regions with ( mag), as the value given by SFD could be larger than the real value.
The behavior of near steep gradients in extinction seems to be different from the overall “smoother” extinction regions. The difference between and decreases near extinction peaks and in some peaks even becomes smaller than . In addition the peaks in are wider than the peaks. We attribute this behavior to the fact that SFD use a dust temperature map with a spatial resolution of a factor of 14 larger than the 100 µm intensity map used to obtain the reddening map. The poor resolution in the temperature maps results in a reddening map which shows less spatial resolution near extinction peaks.
References
- (1)
- (2) Arce, H. G., & Goodman, A. A. 1999, ApJ (in press) [AG]
- (3) Burstein, D., & Heiles, C. 1978, ApJ, 225, 40
- (4) Burstein, D., & Heiles, C. 1982, AJ, 87, 1165
- (5) Faber, S. M., Wegner, G., Burstein, D., Davies, R. L., Dressler, A., Lynden-Bell, D., Terlevich, R. J. 1989, ApJS, 69, 763
- (6) Jarrett, T. H., Dickman, R. L., & Herbst, W., 1989, ApJ, 345,881
- (7) Kenyon, S. J., Dobrzycka, D., & Hartman, L. 1994, AJ, 108, 1872
- (8) Savage, B. D, & Mathis, J. S. 1979, ARA&A, 17, 73
- (9) Schlegel, D. J. 1998, private communication
- (10) Schlegel, D. J., Finkbeiner, D. P., Davis, M. 1998, ApJ, 500, 525 [SFD]
- (11) Vrba, F. J., & Rydberg, A. E. 1985, AJ, 90, 1490
- (12) Wood, D., Myers, P. C., & Daugherty D. A. 1994, ApJS, 95, 457
- (13)