Radial Temperature Profiles of X-Ray–Emitting Gas Within Clusters of Galaxies
Abstract
Previous analyses of ASCA data of clusters of galaxies have found conflicting results regarding the slope of the temperature profile of the hot X-ray gas within clusters, mainly because of the large, energy-dependent point spread function (PSF) of the ASCA mirrors. We present a summary of all ASCA-determined cluster temperature profiles found in the literature, and find a discrepancy in the radial temperature trend of clusters based on which PSF-correction routine is used. This uncertainty in the cluster temperature profile in turn can lead to large uncertainties in the amount of dark matter in clusters.
In this study, we have used ROSAT PSPC data to obtain independent relative temperature profiles for 26 clusters, most of which have had their temperature profiles determined by ASCA. Our aim is not to measure the actual temperature values of the clusters, but to use X-ray color profiles to search for a hardening or softening of the spectra with radius for comparison to ASCA-derived profiles. The radial color profiles indicate that outside of the cooling flow region, the temperature profiles of clusters are in general constant. Within of the virial radius, we find a temperature drop of 20% at 10 keV and 12% at 5 keV can be ruled out at the 99% confidence level. A subsample of non-cooling flow clusters shows that the condition of isothermality applies at very small radii too, although cooling gas complicates this determination in the cooling flow cluster subsample. The colors predicted from the temperature profiles of a series of hydrodynamical cluster simulations match the data very well, although they cannot be used to discriminate among different cosmologies. An additional result is that the color profiles show evidence for a central peak in metallicity in low temperature clusters.
Accepted by Astrophysical Journal
1 Introduction
The presence of hot, X-ray–emitting gas in hydrostatic equilibrium within the gravitational potential well of a cluster of galaxies provides a powerful tool for measuring the amount and distribution of the total mass of the cluster (e.g., Sarazin 1988). Once the mass of the galaxies that compose the cluster and the mass of the hot gas is subtracted from the total mass, the amount of dark matter contained within the cluster can be determined. Knowledge of the amount and distribution of dark matter within clusters is crucial for distinguishing among competing cosmological models, that predict a high baryon fraction for a low density universe, and vice versa (e.g., White et al. 1993).
The total gravitational mass contained within radius is determined through the equation for hydrostatic equilibrium,
| (1) |
where the density gradient of the hot gas, , temperature of the gas , and temperature gradient of the gas, , need to be measured from X-ray observations. The largest uncertainty in the mass results from and . In most previous approaches, an integrated temperature with no radial gradient was assumed. Earlier X-ray telescopes such as Ginga and EXOSAT could determine a global temperature, but lacked the spatial resolution needed to determine the temperature gradient. The ROSAT PSPC possessed good (25′′) spatial resolution, but was not sensitive to photon energies above 2.4 keV, making good estimates of the temperatures of hot ( keV) clusters difficult to acquire. ASCA is sensitive to photon energies up to 10 keV, but the large energy-dependent point spread function (PSF) of ASCA makes it very difficult to obtain spectra within concentric annular bins that are not significantly contaminated by photons scattered into the bin from another bin. The average half-power diameter of the ASCA PSF is , and the width of the PSF increases with increasing energy (Serlemitsos et al. 1995). Thus, higher energy photons originating on-axis are more efficiently scattered to large off-axis angular distances than lower energy photons. This has the effect of introducing a spurious temperature increase to an isothermal profile. For example, an isothermal profile with a temperature of 7 keV will appear to increase to a temperature of 18 keV at an angular distance of (Takahashi et al. 1995) due to the widening of the PSF at higher energies. Still, in principle it is possible to account for the PSF and derive accurate temperature profiles for clusters.
Radial temperature profiles for many clusters observed with ASCA have been published in the literature that are reported to have been corrected for the energy-dependent PSF (Markevitch et al. 1998, hereafter M98; Markevitch 1996; Ikebe 1995) However, in some cases where the same data have been analyzed by different authors, significantly different results have been found. It is important to determine which PSF-correction method is correct, since a nearly complete flux-limited sample of nearby clusters has already been observed with ASCA, and it is unlikely that this will be repeated with AXAF in the near future. Even though AXAF has the required spatial resolution and wide energy bandpass to determine the radial temperature gradient within clusters, the rather small field of view of AXAF is insufficient to image nearby clusters out to large angular distances () without resorting to the time-consuming process of observing the cluster with several different pointings.
In this paper, we summarize all ASCA-derived cluster temperature profiles found in the literature, and use archival ROSAT PSPC data to attempt to determine whether temperature gradients exist in the hot gas contained within clusters of galaxies. Rather than perform detailed spectral fitting to the ROSAT PSPC data, we calculate three X-ray “colors” (ratios of counts in bands covering the ROSAT bandpass) in an effort to detect a hardening or softening of the spectra as a function of radius. This method has the advantage of being non-parametric, and is suitable for detecting changes in temperature, as opposed to the actual temperature values. A technique similar to this has been used to search for cooling gas and excess absorption in the centers of cooling flow clusters observed by ROSAT by Allen & Fabian (1997). These authors find that their color profiles suggest isothermality outside of the cooling flow region, although their profiles typically extend out to only . Our goal is to extend this result out to . In addition, this type of colors technique has also been used recently by Ettori, Fabian, & White (1998) to search for temperature and absorption variations in the Perseus cluster.
2 Previous Published Results With ASCA
All clusters we could find in the literature observed with ASCA with regular, symmetric X-ray emission for which PSF-corrected temperature profiles have been determined to date, and for which a description of the PSF-correction method has been outlined are listed in Table 1. We have excluded temperature profiles of clusters with asymmetric X-ray emission, for which a radial profile is not useful, and also clusters for which the PSF was not accounted for in the analysis (except for a few low temperature clusters and A2218; see below). For each cluster the trend in temperature with
| Published ASCA-derived Cluster Temperature Profiles | ||||
| Cluster | Radial Trend | % Prob.aafootnotemark: | Method | Ref. |
| A85 | Decreasing | 1 | M98 | |
| A119 | Decreasing | 73.6 | 1 | M98 |
| A399 | Constant | 2.6 | 3 | Fujita et al. 1996 |
| A399 | Decreasing | 86.8 | 1 | M98 |
| A401 | Constant | 27.5 | 3 | Fujita et al. 1996 |
| A401 | Decreasing | 99.98 | 1 | M98 |
| A478 | Decreasing | 94.5 | 1 | M98 |
| A644 | Decreasing | 87.1 | 1 | Bauer & Sarazin 1998 |
| A665 | Decreasing | 99.66 | 1 | M98 |
| A780 | Decreasing | 52.0 | 1 | Ikebe et al. 1997 |
| A780 | Decreasing | 80.5 | 1 | M98 |
| A1246 | Constant | … | 2 | Yamasaki et al. 1997 |
| A1650 | Decreasing | 30.1 | 1 | M98 |
| A1651 | Decreasing | 79.5 | 1 | M98 |
| A1795 | Constant | 14.8bbfootnotemark: | 2 | Ohashi et al. 1997 |
| A1795 | Decreasing | 49.2 | 1 | M98 |
| A2029 | Decreasing | 50.1 | 1 | Sarazin et al. 1997 |
| A2065 | Decreasing | 99.87 | 1 | M98 |
| A2142 | Decreasing | 74.9 | 1 | M98 |
| A2163 | Decreasing | 1 | M98 | |
| A2218 | Decreasing | 4 | Cannon et al. 1998 | |
| A2256 | Decreasing | 1 | Markevitch 1996 | |
| A2319 | Decreasing | 87.9 | 1 | Markevitch 1996 |
| A2657 | Decreasing | 97.6 | 1 | M98 |
| A3112 | Decreasing | 98.1 | 1 | M98 |
| A3266 | Decreasing | 99.3 | 1 | M98 |
| A3391 | Constant | 1.6 | 1 | M98 |
| A3558 | Decreasing | 91.7 | 1 | Markevitch & Vikhlinin 1997 |
| A3571 | Decreasing | 97.2 | 1 | M98 |
| A4059 | Decreasing | 99.75 | 1 | M98 |
| MKW3S | Constant | … | 2 | Kikuchi et al. 1996 |
| MKW3S | Decreasing | 99.25 | 1 | M98 |
| Triangulum Australis | Decreasing | 97.5 | 1 | M98 |
| Ophiuchus | Constant | … | 2 | Matsuzawa et al. 1996 |
| Centaurus | Increasing | 47.9 | 2 | Ikebe 1995 |
| AWM7 | Constant | 66.0 | 2 | Ezawa et al. 1997 |
| AWM7 | Constant | 34.1 | 1 | Markevitch & Vikhlinin 1997 |
| 2A0335+096 | Constant | 17.4 | 2 | Ohashi et al. 1997 |
a% Prob. is the percentage probability that the derived
temperature profile is inconsistent with a constant value (),
as derived from a test.
bAfter exclusion of the annulus
which may be contaminated by a hard point source
increasing radius is designated as increasing, constant, or decreasing. To determine the significance of the radial trends we fitted constant temperature profiles to the published data using the test. The percent probability that the profile is inconsistent with a constant temperature profile is shown in Table 1 (denoted by % Prob.), for those clusters for which actual temperature values were given in the original paper.
Various methods have been developed to account for the energy-dependent PSF of ASCA. Method 1 is described in Markevitch et al. 1996, Method 2 is described in Ikebe (1995), Method 3 is described in Fujita et al. (1996). Method 4 (Cannon, Ponman, & Hobbs 1998) did not correct for the PSF, but is mentioned because it still finds a negative temperature gradient for A2218. The method used is shown in Table 1.
In general those clusters analyzed using Method 1 show a decreasing temperature profile (up to a factor of two), except for A3391 and AWM7, leading to the claim of a “universal” temperature profile for non-merging clusters (M98). Of the 28 clusters analyzed in this manner, 22 (14) were inconsistent with a constant temperature profile at the 70% (90%) probability level. On the other hand, all but one of the clusters analyzed using Method 2 show constant profiles, and the lone exception (Centaurus) is consistent with a constant value at around the 50% probability level.
Particularly interesting are the clusters that have been analyzed using more than one technique. Two such clusters are the non-cooling flow cluster pair A399 and A401. When analyzed with Method 1 (M98), the temperature was found to decrease radially by a factor of 1.5 and 1.7 for A399 and A401, respectively. Such a decline, if real, would have a substantial effect on the total mass estimate of the cluster. These two clusters were also analyzed with Method 3 by Fujita et al. (1996), who found a flat temperature profile for both clusters. For their spectral fitting, Fujita et al. (1996) used ancillary response files that took the energy-dependent PSF into account, but which assumed a constant spectrum for the entire field when calculating the amount of contamination from other regions of the detector. Although this would have no effect on an isothermal profile, it will tend to flatten any existing temperature gradient. It is unlikely, though, that this effect can make a temperature profile that decreases by a factor of 1.5 to appear flat (Fujita 1998). A similar discrepancy also exists for MKW3S. When analyzed with Method 1 (M98), a decrease from 4 keV to 2.8 keV with small errors was found, whereas a constant profile was found using Method 2 (Kikuchi et al. 1996). A1795 was found to have a flat profile using Method 2 (Ohashi et al. 1997) and a decreasing (although not significant) profile using Method 1 (M98). The other cluster that has been analyzed by the two techniques shows agreement between the two techniques; AWM7 has a constant profile.
Temperature profiles of several low temperature ( keV) clusters that have not been corrected for the PSF of ASCA have also been presented in the literature. At these low temperatures the spurious temperature increase caused by the PSF is minimal (Takahashi et al. 1995). A1060 (Tamura et al. 1996), A262 and MKW4S (Fukazawa et al. 1996), and A496 (Hatsukade & Ishizaka 1996) all show a constant temperature profile outside of the cooling flow region.
Given the apparent discrepancy between various techniques, it is important to determine which technique gives a more accurate result. ROSAT PSPC data might shed some light on the matter. Although not sensitive to photon energies above 2.4 keV, large (factor of two) gradients in the temperature profile should be detectable with ROSAT.
3 Sample Selection
For our sample, we chose selection criteria similar to those used by M98, who analyzed 30 clusters observed with ASCA. This was done to ensure that a direct comparison could be made between most of the clusters in our ROSAT PSPC sample and clusters analyzed with ASCA. We chose Abell clusters that fell in the redshift interval of , and had ROSAT fluxes greater than ergs s-1 cm-2 (Ebeling et al. 1996), plus the clusters Cygnus A, MKW3S and Triangulum Australis. At this redshift range, most of the X-ray emission from the clusters fit comfortably within the rib support structure of the ROSAT PSPC at an angular distance of 18′. Of the 36 clusters that satisfied our selection criteria, 32 were the targets of pointed observations with the ROSAT PSPC. Of these 32 clusters, we discarded 6 clusters that exhibited very asymmetric X-ray emission, for which a symmetrical radial profile has no real meaning. The 26 clusters in our sample are listed in Table 2, along with a few relevant properties of each cluster. The temperatures given were taken from the literature and were mainly determined with ASCA data, although a few were measured with Einstein, ROSAT, Ginga, or EXOSAT.
| Sample of ROSAT Observed Clusters | |||
| Cluster | Redshift | Exposure (s) | Temperature (keV) |
| A85 | 0.052 | 13361 | 6.9 |
| A119 | 0.044 | 12900 | 5.6 |
| A133 | 0.060 | 15055 | 4.0 |
| A401 | 0.074 | 11772 | 8.0 |
| A478 | 0.088 | 21239 | 8.4 |
| A644 | 0.071 | 8817 | 7.9 |
| A780 | 0.057 | 16407 | 4.3 |
| A1651 | 0.085 | 7153 | 6.1 |
| A1795 (high gain) | 0.062 | 24874 | 7.8 |
| A1795 (low gain) | … | 33644 | … |
| A2029 | 0.077 | 12602 | 9.1 |
| A2142 (PSPC-B) | 0.089 | 14608 | 9.7 |
| A2142 (PSPC-C) | … | 7120 | … |
| A2256 | 0.058 | 16104 | 6.6 |
| A2319 | 0.056 | 4003 | 8.8 |
| A2589 | 0.042 | 6510 | 3.7 |
| A2597 | 0.085 | 6551 | 4.4 |
| A2657 | 0.040 | 17110 | 3.7 |
| A3112 | 0.070 | 6774 | 5.3 |
| A3158 | 0.059 | 2834 | 5.5 |
| A3266 | 0.055 | 19536 | 8.0 |
| A3391 | 0.054 | 6228 | 5.4 |
| A3532 | 0.056 | 6761 | 4.4 |
| A3562 | 0.050 | 17055 | 3.8 |
| A3571 | 0.040 | 4950 | 6.9 |
| A4059 | 0.048 | 5165 | 4.4 |
| MKW3S | 0.045 | 7801 | 3.7 |
| Triangulum Australis | 0.051 | 6517 | 9.6 |
Using this nearly complete sample, our aim was to select a sample that was large enough to search for trends in the hardness ratios of the X-ray emission in clusters, even if the statistics for a given cluster are not good enough to determine a trend on an individual basis.
4 Data Reduction
For each cluster, the data were processed in the following manner. First, we used the latest version of pcpicor within FTOOLS 4.0 to correct for temporal and spatial gain variations across the image plane of the PSPC that were incorrectly handled by SASS as part of the conversion from detected pulse height to pulse invariant channel (Snowden et al. 1995). The detector coordinates and arrival time of each event are used to correct the data for this effect. Next, the data were corrected for particle and solar X-ray background, exposure, and vignetting as described by Snowden (1995). Periods of high background due to charged particles were removed by filtering the data such that all time intervals with a Master Veto Rate above 170 counts s-1 were excluded. Since some of the clusters lie in directions of high Galactic hydrogen column densities, we excluded data in Snowden (1995) bands R1, R2, and R3 (approximately 0.11–0.51 keV) since these bands often have very low X-ray count rates due to absorption. We created three energy bands with the remaining four energy bands created by the Snowden (1995) routines: R4 + R5 (approximately 0.52–0.90 keV), R6 (approximately 0.91–1.31 keV), and R7 (approximately 1.32–2.01 keV). Nearly all the data were taken in the post-gain change mode (1991 October 11) with the PSPC-B, although a few clusters were observed before the gain change, and two with the PSPC-C.
For each of the three energy bands, counts were extracted from 3–4 concentric annuli centered on the centroid of the X-ray emission. The outer radius of the central bin was usually chosen to be to encompass all or nearly all emission from a cooling flow that might be present. When a cooling flow was not present, the innermost bin often was made larger. In many cases, the extraction regions were chosen to match those of previous studies that analyzed ASCA data. Unrelated X-ray sources in the field of view were removed from the data. For each band, background counts were obtained from an annulus in extent, and subtracted from the source counts. With a few exceptions, the annular rings covered the full azimuthal range. The exceptions are A85, A2256, and A2319, which show some asymmetry possibly due to a merger. The asymmetric portion of their X-ray emission was not analyzed.
From these three bands, we constructed three ratios or “colors” defined as
| (2) |
| (3) |
and
| (4) |
A1795 was observed in both high gain and low gain modes, so the data from each gain mode have been analyzed separately. Similarly, A2142 was observed with both PSPC-B and PSPC-C, so the data from each instrument were analyzed separately.
5 Color Models
As noted in § 1, the limited ( keV) bandpass of the ROSAT PSPC does not allow tight constraints to be placed on the temperature of hot clusters. There are conflicting views concerning the reliability of the ROSAT PSPC to determine accurate global values for hot clusters because of calibration uncertainties of the instrument. Markevitch & Vikhlinin (1997) found that ROSAT gave global temperatures for the clusters A3558 and AWM7 that were 1.2–1.75 times lower than the temperatures found by ASCA and other high-energy instruments. On the other hand, Henry (1998) has updated Table 1 of Henry & Briel (1996) and found that the ROSAT-derived temperatures of seven of nine clusters agreed with the temperatures found by ASCA or EXOSAT within the 1 errors. In six of the nine cases, the ROSAT temperature was less than the temperature derived by other instruments. We choose to avoid the issue of whether the PSPC can accurately determine the temperature of hot clusters, and employ the use of X-ray colors rather than detailed spectral fitting to search for temperature gradients. We are not concerned with the actual value of the temperature, just changes in the temperature, which should not be affected by calibration uncertainties, unless these uncertainties change as a function of position on the detector.

First, we address the issue as to whether a change in temperature with radius in the 2–10 keV range would be detectable with ROSAT. To do this, we have calculated the colors expected from a variety of Raymond-Smith (1977) models, once the spectral models have been folded through the spectral response of the PSPC using XSPEC. For these models, we have assumed metallicities of 20%, 40%, and 60% and an absorbing hydrogen column density of cm-2, although variations in absorption will be discussed below. The predicted colors C76, C745, and C645 are shown for temperatures ranging from 2 keV to 10 keV in Figure 1. These plots show the color values for low gain data. Model colors for PSPC-B high gain and PSPC-C data differed by several percent from colors derived from PSPC-B low gain data, but were qualitatively very similar as far as their dependence on temperature and metallicity. The colors C76 and C745 are sensitive to changes in temperature. For C76 the percentage decrease in going from 10 keV to 5 keV, from 6 keV to 3 keV, and from 4 keV to 2 keV is 7.0%, 10.7%, and 14.7%, respectively, for models with 40% metallicity. For C745 the percentage decreases were 7.9%, 10.2%, and 12.1%, respectively, for models with 40% metallicity. The effect of abundance variation on C76 and C745 is negligible above 6 keV and minimal even at 3 keV. Therefore, these two colors appear to be a good indicator of large (factor of 2) changes in the temperature. On the other hand, the color C645 is insensitive to changes in temperature. At 40% metallicity, C645 is completely independent of temperature above 3 keV, and is only minimally affected by temperature above 6 keV at 20% and 60% metallicities. The change in C645 in going from 6 keV to 3 keV is only 2.6% and 3.1% for 20% and 60% metallicities, respectively. Since C645 is not sensitive to temperature (above 3 keV), this color is a useful test of our contaminant removal and background subtraction procedures, as well as an indicator of absorption gradients, if present.
Figure 2 shows the effect a change in absorption has on the colors at three different temperatures. For all three colors, the percentage change between two temperature tracks is independent of the absorbing column density. Thus, a change in temperature from 10 keV to 5 keV (for example) will lead to the same percentage decrease in C76 for a cluster with an absorbing column density of cm-2 as a cluster with an absorbing column density of cm-2. This will be important when combining the color profiles from each individual cluster into one composite profile (see § 7 below).


![[Uncaptioned image]](/html/astro-ph/9901406/assets/x4.png)
Fig. 3 - continued


Variations in the Galactic column densities across the field of view of the PSPC should not have a significant effect on the colors. Arabadjis & Bregman (1998) found that for column densities below cm-2, the column density varies by no more than 5% on angular scales of 30′. At cm-2, a 10% change in the column density led to changes in C76, C745, and C645 of only 0.6%, 1.8%, and 1.2%, respectively.
6 Observed Radial Color Profiles
The color profiles for the 26 clusters in our sample are shown in Figure 3–6. The sample has been broken into four groups according to temperature and cooling rate: keV, yr-1 (Figure 3), keV, yr-1 (Figure 4), keV, yr-1 (Figure 5), and keV, yr-1 (Figure 6). A2589 had no published cooling rate, so it has been placed in the no cooling flow category (for display only). Below we discuss each cluster briefly. The cooling rates given are from Peres et al. (1998) unless otherwise noted.
6.1 keV, yr-1
A85: A clump in the X-ray emission to the south of the cluster that may or may not be physically associated with the cluster (Lima Neto et al. 1997) was excluded from the analysis here. The resulting C76 and C745 profiles are constant within the errors outside the cooling flow region ( yr-1) as is the C645 profile, indicating isothermality. This is consistent with the results of Pislar et al. (1997) and Kneer et al. (1995) who performed detailed spectral modeling of the same data. Conversely, M98 found a decrease in the temperature of a factor of two for this cluster with ASCA data.
A478: This cluster is the most heavily absorbed in our sample. All three color profiles show a considerable decreasing trend, indicative of a radial trend in the absorbing column density. This is consistent with the results of Allen et al. (1993), who analyzed the same ROSAT data and found the absorbing column density to decrease by a factor of 1.5 from the center to the outer part of the cluster. Such an absorption gradient apparently masks the effect of a cooling flow ( yr-1) on the color profiles.
A644: C76 and C745 are constant outside the cooling flow region ( yr-1), as is C645. Bauer & Sarazin (1999) found the temperature to decrease from 10 keV in the center to 5.1 keV with ASCA data.
A1651: All three color profiles are constant within the (large) errors, indicating no temperature, metallicity, or absorption gradients, although this cluster possesses a moderate cooling flow ( yr-1).
A1795: This cluster was observed in both high gain and low gain modes, so the data were analyzed separately. In both data sets, C76 and C745 show a drop in the center, indicative of a cooling flow ( yr-1). The outer two bins of C76 and C745 are consistent with small errors. The C645 profile is also constant with small errors. Given the excellent statistics of both observations, there is little doubt that this cluster is isothermal outside of the cooling flow region. Briel & Henry (1996) found a nearly constant temperature profile outside the cooling radius with the same ROSAT data.
A2029: This cooling flow cluster ( yr-1) shows an initial rise in C76 and C745 before decreasing at larger radii, indicating a drop in temperature. The C645 profile shows a slight, marginally significant rise. At a temperature of 9.1 keV, abundance effects on the colors are negligible, so a temperature drop is probably present in this cluster.
A2142: This cluster was observed with both PSPC-B and PSPC-C, so the data were analyzed separately. An initial rise in C76 and C745, indicating a cooling flow ( yr-1), levels out at large radii. The C645 profile is constant in the PSPB-B observation, although the second C645 bin of the PSPC-C observation is somewhat high. Henry & Briel (1996) found a constant temperature profile outside the cooling radius with the same ROSAT data, although the temperature of their bin is unconstrained.
A3112: All three color profiles are constant within the errors, despite the fact that this cluster harbors a strong cooling flow ( yr-1). This cluster’s temperature was found to decrease from 6 keV to 3 keV with ASCA data (M98).
A3571: This cluster possesses a modest cooling flow ( yr-1). All three color profiles are constant with small errors. M98 found this cluster’s temperature to decrease by a factor of 1.7 with ASCA data.
6.2 keV, yr-1
A119: A marginally significant decrease of about 10% in C76 and C745 is detected in this non-cooling flow cluster, indicating a temperature drop. The constant C645 profile argues against a significant change in abundance or absorption with radius. The innermost X-ray contours are somewhat irregular, suggesting that this cluster is not completely relaxed and may have undergone a recent merger (M98).
A401: C76 and C745 show a marginal increase with radius, while C645 is constant. This is significant considering that M98 found the temperature to decrease by a factor of 1.7 for this cluster, whereas Fujita et al. (1996) found a constant temperature profile with the same ASCA data. At 40% metallicity, a drop in temperature from 10 keV to 6 keV (as was found with the ASCA data) would lead to percentage drops in C76 and C745 of 4.6% and 5.4%, respectively. However, this is inconsistent with the PSPC data at the 99.8% and 99.98% confidence levels for C76 and C745, respectively. The cooling rate of this cluster is consistent with zero. Unfortunately, A399 lies too far off-center from the A401 ROSAT observation to analyze properly.
A2256: This cluster was the object of multiple pointings, but we choose to analyze only the one long observation in which the center of the cluster is in the center of the field of view. The other pointings were shorter and offset, resulting in much of the emission falling outside the rib support structure. In addition, the offset pointings were taken in the low gain mode of the PSPC-B, whereas the long centered pointing was acquired with the PSPC-C, preventing the combination of the data from the various pointings. All three color profiles are constant within the errors, indicating no temperature, metallicity, or absorption gradients in this non-cooling flow cluster. Henry, Briel, & Nulsen (1993) analyzed the same ROSAT data (using just the PSPC-C data), and found an isothermal profile out to 15′. Markevitch (1996) found the temperature of this cluster to decrease radially by a factor of two with ASCA data.
Briel & Henry (1994) analyzed all five ROSAT PSPC pointings, and found two hot spots ( keV) to the northeast and southwest of the center from . We determined the colors for the same regions described by Briel & Henry (1994), and the results are shown in Figure 7. Regions 1–8 represent 45∘ sectors starting north and running counterclockwise for the inner . Regions 9–16 represent the same sectors for an annular bin of .

Although the errors are large, there is a general agreement between the two studies. For the inner bin, the cool spot of Region 7 and warm spot of Region 8 are seen. For the outer bin, the hot spots of Region 9 and Region 14 are seen. The hot spot of region 10 is missed, however, and in fact appears as a cool spot in the color profile.
A2319: We have excluded data from a wedge between position angles 315∘ and 0∘ because of an asymmetry in the X-ray emission in that region. Despite not having a cooling flow, the C76 and C745 profiles show a marginal initial increase. However, this trend is also seen in C645, which is not sensitive to temperature. For all three colors, the outer two bins are constant within the errors.
A3158: C76 and C745 show an initial decrease with radius before leveling off, whereas C645 shows the opposite trend. It is not clear what would cause this odd behavior of the color profiles other than a very steep rise in temperature in the center of the cluster, since any radial trend in the absorption should effect all three profiles in the same manner. This cluster is not known to harbor an AGN. The temperature profile appears constant outside of . The cooling rate of this cluster is consistent with zero.
A3266: C76 is flat in this non-cooling flow cluster, although the C745 profile shows a marginally significant dip in the second spatial bin. This dip is also present in C645 profile, indicating that it is not a result of a change in temperature. A temperature drop from 10 keV to 5 keV was found with ASCA data (M98).
A3391: The C76 and C745 profiles show a dip from the center to the radial bin, while the C645 profile is constant. Poor statistics preclude any definitive conclusion from being drawn on this non-cooling flow cluster.
Triangulum Australis: This cluster also lies in a direction of high Galactic hydrogen column density. Although the C76 profile is constant with small error bars, C745 and C645 show a significant decrease at large radii. The cooling rate of this cluster is consistent with zero. The high (9.6 keV) temperature of this cluster precludes this trend from being the result of an abundance gradient, and the constant C76 profile argues against an absorption gradient. There appears to be no simple explanation for the behavior of the C745 and C645 profiles at large radii, other than some unknown source of excess band 4–5 emission. Since the X-ray emission in this cluster extends to a large angular distance, we also tried a larger background region. Extracting counts from an annular region of for the background did not change the results.
6.3 keV, yr-1
A133: This cool cluster shows a central drop in C76 and C745, indicative of a cooling flow ( yr-1; White, Jones, & Forman 1997). The outer two bins of C76 and C745 are consistent with a constant temperature. The C645 profile shows an initial decrease, possibly due to high metallicity in the center. This trend will be discussed further in § 7.
A780 (Hydra A): C76 and C745 are constant outside of the innermost radial bin, which contains a rather strong cooling flow ( yr-1). The C645 profile peaks in the center, but levels out at larger radii.
A2597: All three color profiles are constant within the errors, although the errors are quite large for the outermost bin. Sarazin & McNamara (1997) and Sarazin et al. (1995) found a large cooling flow ( yr-1) and excess absorption in this cluster with the ROSAT PSPC and HRI, but detect a temperature drop and excess absorption only in the inner . We see evidence for this in the colors when we divide our innermost () bin into segments. However, these features become diluted when the color profiles are averaged over a bin.
A4059: C76 and C745 show an initial increase indicative of a cooling flow ( yr-1), before leveling off at larger radii. The C645 profile shows an initial drop before leveling off, possibly due to metallicity gradients that might not be evident in the C76 and C745 profiles because of the cooling gas in this region. Huang & Sarazin (1998) found a constant temperature profile outside of the cooling radius with the same ROSAT data.
MKW3S: Outside the cooling flow region ( yr-1), all three color profiles are constant, albeit with rather large errors.
6.4 keV, yr-1
A2589: C76 and C745 show an initial increase indicative of a cooling flow (although there is no published cooling rate for this cluster), before leveling off at larger radii. The significant decrease in C645 coupled with a constant C76 and C745 profile would seem to rule out an absorption gradient, but could be due to a metallicity gradient for this low temperature (4 keV; David, Jones, & Forman 1996) cluster. Both results are consistent with the findings of David et al. (1996) who analyzed the same PSPC data and found a substantial metallicity gradient in this cluster.
A2657: C76 is constant with small errors, while C745 and C645 show an insignificant increase in this modest cooling flow cluster ( yr-1; White et al. 1997).
A3532: All three color profiles are constant within the errors for this non-cooling flow cluster.
A3562: The C645 profile shows a significant decrease with radius, indicative of an abundance or absorption gradient. The lack of a significant decrease in C76 or C745 with radius would seem to rule out an absorption gradient. In fact, an increasing C76 profile and a slightly decreasing C745 profile indicates a large decrease in metallicity with increasing radius (see Figure 1). The effect of metallicity on the colors is measurable in this case because of the cluster’s low temperature ( keV; Henry & Briel 1996). The nearly constant C745 profile indicates a constant temperature profile, apparently unaffected by the cluster’s small cooling flow ( yr-1).
7 Analysis and Discussion of Composite Color Profiles
7.1 Temperature Gradients
Individually, the lack of a simultaneous decrease in the C76 and C745 profiles (the colors sensitive to changes in temperature) suggests that the radial temperature profile is nearly constant for most clusters, at least outside the cooling region. However, in many cases the statistics are not good enough to definitively rule out a temperature gradient. In order to reduce the statistical uncertainty, we have calculated color profiles for our sample as a whole. For each cluster, counts were extracted from three concentric annular bins. The size of the bins were chosen to be the same fraction of the virial radius for each cluster, in order to compare physically similar regions of each cluster regardless of size or distance. The outer radii of each bin were chosen to be 7.9%, 15.8%, and 35.5% of the virial radius. This choice of bin size was selected so that the extraction region extended to at least (to contain all or nearly all cooling flow emission; only two clusters had innermost annuli of less than 2′ in extent) and the outermost bin to no larger than 18′ (to stay within the rib support structure) for all clusters. Note that this extraction method was not used to derive the individual profiles shown in Figure 3–6; for the individual profiles we attempted to match the extraction regions with those chosen by the authors of the respective ASCA clusters for a direct comparison. We assume the typical relation between cluster virial size (the radial scale encompassing a mean density contrast of 180 relative to the critical density) and temperature with normalization Mpc, assuming a Hubble constant of 50 km s-1 Mpc-1.
For each cluster, the color profiles were normalized by the global value for that color (i.e., C76/C76, C745/C745, C645/C645), so that the color profiles for each cluster varied around a value of one. The color profiles were averaged together, with each cluster given equal weights. The clusters were also averaged by weighting each cluster according to the number of counts that cluster contributed to the sum total of counts (calculated separately for each spatial bin). The two procedures yielded results that agreed to within 1% for each spatial and color bin, and was less than 0.5% for a majority of bins. Since the equal weighting average yielded somewhat higher errors (given by the uncertainty in the mean for the cluster sample), we adopt the equal weighting scheme to be conservative.
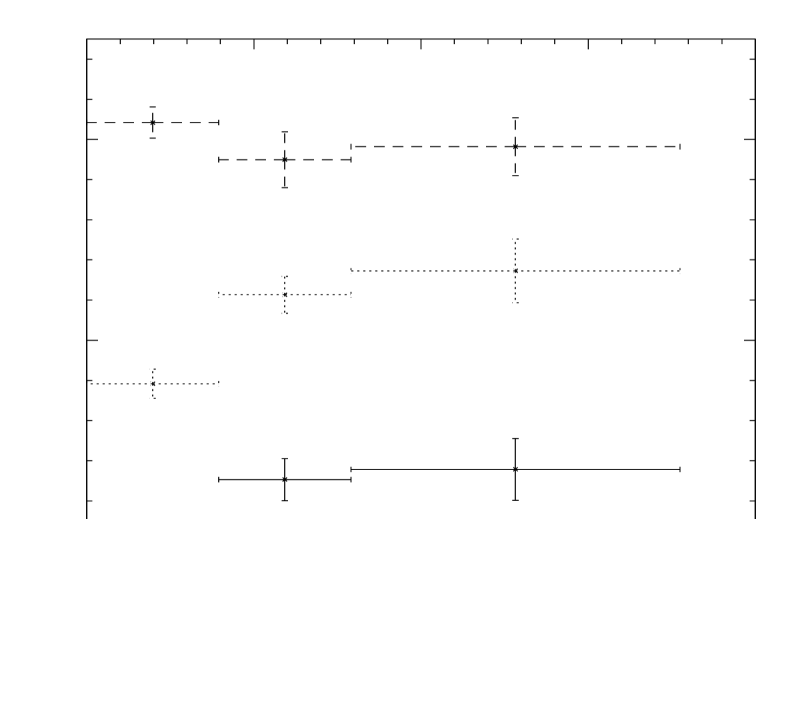
The composite color profiles for all clusters in the sample is shown in Figure 8. For display purposes, we have multiplied the C745 profile (dotted line) by a factor of 1.1 and the C645 profile (dashed line) by 1.2. The outer two bins for both C76 and C745 show remarkable agreement, and the errors are 1% or less (given by the uncertainty of the mean of the sample). Since these two colors are sensitive to changes in temperature, this strongly suggests isothermality in the outer regions of clusters, at least out to 35% of the virial radius. At 10 keV (5 keV), a drop in temperature from bin 2 to bin 3 of 20% (12%) is ruled out at the 99% confidence level. The innermost bin of these two profiles is noticeably lower than the other bins, suggesting a temperature drop in the center. This is to be expected considering that the innermost bin is similar in size to the cooling radius of clusters that possess cooling flows. This drop is not seen in the inner bin of the composite C645 profile, since C645 is insensitive to changes in temperature. However, this color is sensitive to absorption and metallicity gradients, both of which are expected (if present) to lead to a softening of the profile with increasing radius for physically realistic situations.

The main purpose for calculating the temperature-insensitive C645 profiles was to have an indicator as to whether some unknown systematic effect was biasing our results by introducing a spurious gradient to the color profiles. As shown above, this color profile should be flat (neglecting metallicity effects), so any radially-dependent systematic effect that might be biasing the temperature-sensitive C76 and C745 colors should be easily detectable in C645. To test this, we have calculated the significance of the deviations of the C645() values from the global C645 value for each cluster for each spatial bin in the sample, i.e., (C645C645)/(error in C645i()), for each cluster . If there is no unknown systematic effect, one would expect a Gaussian distribution with zero mean and unit dispersion. Figure 9 shows that the resulting histogram is approximately Gaussian in shape. The mean and standard deviation of the distribution are and , respectively. Thus, the distribution is only slightly wider than expected, indicating that there is no systematic effect biasing the radial color profiles.


The agreement in the outer two bins of the composite C76 and C745 profiles is not the result of averaging together rapidly increasing profiles with rapidly decreasing individual color profiles. The same statistical test used to determine the robustness of the constancy of C645 was used on the outer two spatial bins of C76 and C745 for each cluster (we have omitted the inner cooling flow spatial bin, and determined the global color using only the outer two spatial bins). The results are shown in Figure 9. Again, the histogram is Gaussian, with a mean of and a dispersion of . Obviously, if we were merging together strongly increasing and strongly decreasing individual color profiles, the width of the Gaussian would be much more than unity.
Next, we separated the sample into two groups according to whether the cluster possessed a substantial cooling flow ( yr-1) or not to verify that the drop in C76 and C745 in the innermost bin was due to cooling gas at lower temperatures. The color profiles for the cooling flow subsample are shown in Figure 10. The drop in C76 and C745 is very pronounced, yet the excellent agreement of the outer two radial bins remains. The C645 profile is constant within the errors. The sharp drop in the innermost bin of C76 and C745 disappears in the non-cooling flow subsample (Figure 11). Note that A2589 is not included in this subsample, since no cooling rate was available from the literature. Here, C76 is constant within the errors and C745 shows only a very small drop in the outermost bin, again indicating a lack of a temperature gradient. There is a curious 5% drop in the outermost bin of the C645 profile. This feature disappears, however, upon the removal of three clusters – A3532, A3562, and Triangulum Australis. Irregularities in the C645 profiles of the latter two clusters were discussed in § 6.
One complication that could lead to differences in the measured temperatures between ROSAT and ASCA is the presence of multi-temperature gas. In that event, ROSAT might measure a lower temperature than ASCA, because ROSAT would be more sensitive to the low temperature component of the multi-temperature gas than ASCA, which would be sensitive to higher temperature gas. However, such multi-temperature gas might only be expected to occur within the cooling flow region of clusters (the first spatial bin), and should not occur past the cooling radius. This would have no effect on the outer two spatial bins, where the case for isothermality is strongest.
Given the small uncertainties of the composite color profiles, changes in the temperature of a factor of two should have been detected, since changes of this magnitude would lead to changes in the C76 and C745 profiles of at least 7%. It therefore appears that outside the cooling radius, the gas in clusters of galaxies is largely isothermal.
7.2 Abundance Gradients
Inspection of Figures 5 and 6 reveals that many of the low temperature clusters show a higher central value of C645 than the rest of the cluster, most notably A133, A780, A2589, A3562, and A4059. Since this color is not sensitive to temperature, it cannot be due to a change in temperature. Nor can it be due to an absorption gradient, as this would also be evident in C76 and C745 as well. However, a high central metallicity can be responsible for this, since C645 is much more sensitive to metallicity than C76 and C745, especially at low temperatures (see Figure 1).


We have combined the color profiles of all clusters with keV in Figure 12. The C76 and C745 profiles rise in the central regions since there are cooling flow clusters in this subsample. The composite C645 profile shows a noticeable decreasing trend with radius, indicative of a possible negative radial abundance gradient. This trend remains upon the removal of A3562 and A3532, indicating that the trend is not the result of a couple of nonrepresentative clusters. The decrease in C645 from the innermost bin to the outermost bin is 4.6%. At 4 keV, a decrease of this magnitude could be caused by a decrease in metallicity from 60% solar to 20% solar, or equivalently from 40% solar to 6% solar. Given that there is also a temperature decrease in the center, the decrease in metallicity may be even greater to account for the observed decrease in C645. As a comparison, we show the composite profiles for clusters with keV in Figure 13. Here, the C645 profile is nearly flat, and in fact becomes flat if Triangulum Australis is removed from the subsample. Abundance gradients may be present in the high temperature clusters just like their low temperature counterparts, but as Figure 1 shows C645 is insensitive to metallicity above 5 keV. It should also be noticed that the central decrease in C76 and C745 is less pronounced in the high temperature subsample than the low temperature subsample, since these colors are less sensitive to changes in temperatures brought on by the presence of cooling flows at high temperatures.
Previous studies have yielded conflicting results concerning the presence of metallicity gradients in clusters. Whereas some clusters show no evidence for the presence of a metallicity gradient such as Ophiuchus (Matsuzawa et al. 1996), A1060 (Tamura et al. 1996), A399, and A401 (Fujita 1996), other clusters such as AWM7 (Ezawa et al. 1997), A496 (Hatsukade et al. 1996), and Centaurus (Ikebe 1995) exhibit significant metallicity gradients. Allen & Fabian (1998) found that the emission-weighted metallicities of cooling flow clusters were on average 1.8 times higher than those of non-cooling flow clusters, suggesting that metallicity gradients that were present in cooling flow clusters but absent in non-cooling flow clusters was responsible for the discrepancy. The strongest example in our sample of a cluster having a metallicity gradient is A3562, which has a low ( yr-1) cooling rate. From our sample it would appear that some, but not all clusters exhibit a central peak in metallicity.
8 Comparison to Cosmological Models
Next, we compare the observed colors to those predicted from a series of theoretical temperature profiles derived from hydrodynamic cluster simulations for various cosmological models. We have used the temperature profiles from six cosmological models presented in Evrard, Metzler, & Navarro (1996). The models are for cosmologies with with energy feedback and mass ejecta from galaxies within the cluster (EJ), and without feedback (2F) (Metzler 1995), using an independent code from Navarro, Frenk, & White (1995) (NFW), and three models from Evrard et al. (1993), with a standard CDM model with (EdS), an open universe with (Op2), and a low-density universe with a flat cosmology with and a cosmological constant (Fl2). Further details concerning the models can be found in Evrard et al. (1996), and references therein.

The models cover a range of temperatures and masses, and the colors of these models are presented in Figure 14. We have excluded all runs where the global temperature was less than 3.5 keV, since there are no such low temperature clusters in our sample of observed clusters. The colors were calculated for each spatial bin, and normalized to the colors for the global temperature for that run. Note that we have converted the notation used in Evrard et al. (1996) to . Once again the normalized C745 and C645 profiles were multiplied by 1.1 and 1.2, respectively, for clarity. The model colors have been plotted out to 35% of the virial radius to match the data. Within each panel, the colors from the normalized composite profile are shown for comparison. This time the innermost bin (which contains cooling gas) has been omitted from the normalization procedure. It is evident that the agreement of the colors in the outer two spatial bins of C76 and C745 is predicted by the models. The one exception is the Fl2 model, but this is possibly due to a misnormalization of the temperature profile in Evrard et al. (1996); the Fl2 panel of Figure 5 of that paper shows that the temperature profile peaks at a value of one, rather than fluctuating around a value of one as a normalized profile should. Still, the color profile is flat, even if the normalized color value is less than one. Unfortunately, the similarity of the models at radii less than 35% of the virial radius precludes the use of the data from distinguishing among the different cosmologies presented here.
The agreement between the models and the ROSAT data disagrees with the work of M98 who used ASCA data to derive normalized temperature profiles of a sample of clusters. M98 found that, on average, the temperature decreased from about 1.2 times the global temperature at 5% of the virial radius to 0.7 times the global temperature at 35% of the virial radius. M98 fit the temperature profiles with a polytropic equation of state, which leads to
| (5) |
where is the projected distance, is the core radius, has its usual meaning in the context of isothermal -models, and is the polytropic index. Using values of and (typical values for a 7 keV cluster; Jones & Forman 1997), M98 found a best fit polytropic index of (90% confidence levels). We have calculated the colors for a 7 keV cluster that follows this radial profile with and plotted them in Figure 14 (long dashed line). The resulting color profiles are incongruous with both the ROSAT data and the models.
M98 claim that two cosmological models predict a significant temperature decrease that matches their ASCA data: that of Bryan & Norman (1997) which employs a Eulerian simulation of an cluster without cooling, and that of Katz and White (1993), which employs a Lagrangian simulation of an cluster with cooling. The Bryan & Norman (1997) simulations show a steep drop in temperature in the inner regions, but were performed only on a single cluster. Other simulations by the same authors (Bryan & Norman 1998) performed on five clusters find flatter temperature profiles. For their cold dark matter model, the temperature profile falls very slowly out to 0.7. For their cold plus hot dark matter model, the temperature profile decreases 15% from 15% to 35% of the virial radius for their steepest profile, and only a few percent for their shallowest profile. All the hot plus dark matter profiles are consistent with the cold dark matter model profiles at radii of the virial radius, where the cold dark matter models begin. The drop in temperature out to 0.7 is significantly less steep than in Bryan & Norman (1997). The steep temperature gradient seen by Katz & White (1993) may have been caused by spurious ram pressure heating of the hot ICM by plunging galaxies in their model, and may not represent a physically plausible situation.
The reliability of such simulations has been empirically tested by Frenk et al. (1998). They compare the structural properties of a single cluster in a cold dark matter universe evolved by twelve different cosmological codes. In general, models using a Smoothed Particle Hydrodynamics (SPH) technique (used to generate all but the “NFW” panel in Figure 8) show a flat or slowly declining temperature profile within 35% of the virial radius (consistent with the ROSAT data), while models using a mesh grid method exhibit a significantly decreasing radial trend in the temperature. The steepest profile is from the Bryan & Norman simulation, which was taken from Bryan & Norman (1997) and not from the simulations of Bryan & Norman (1998). It shows a decrease of 60% in temperature from 0.05 to 0.35. The profile from the simulations of Cen show a similar drop in temperature. However, these are the only two simulations that extend to radii less than 0.2 that show such a significant temperature decrease. It should also be noted that these are 3-D temperature profiles and would appear less steep in projection.
It is debatable how wide a conclusion can be drawn from comparison of a single model realization, but the slight differences between the two codes in the very central regions may be real and perhaps reflect a generic condition between solutions obtained with Eulerian (grid) versus Lagrangian (SPH) methods. Not all Lagrangian SPH studies show completely flat central temperature profiles though. With a set of low density universe simulations, Eke, Navarro & Frenk (1998) show that the mean temperature profile derived from the ten most massive objects exhibits a drop between and . Still, this is a significantly shallower drop than is measured by M98.
Making interpretation more complicated is the fact that the current generation of simulations is not likely to be modeling the physics of the inner cluster correctly at the 5–10% level. Possible complications include a multi–phase central structure, magnetic fields, metallicity gradients (which affect cooling rates), galactic ram pressure and small scale turbulence. However, these potential complications are of less significance outside the cooling radius, where the case for isothermality is strongest.
In conclusion, although a few simulations exist that predict a steep temperature drop in the inner regions of clusters, most published models that have sufficient resolution to probe the inner 10% of the virial radius predict a nearly flat temperature profile, in agreement with the ROSAT data, but in conflict with M98.
9 Final Comments and Future Work
Both individually and cumulatively, our color profiles suggest that the temperature profiles of the hot gas within clusters of galaxies are constant with radius outside of the cooling radius. More conclusive evidence supporting this claim will be provided by AXAF, with its wide energy bandpass and excellent spatial resolution. Given the large discrepancy in the measured temperature profiles of A401 and A399 with ASCA using different methods by previous authors, these two clusters would be an ideal test case for AXAF. AXAF observations of clusters should also resolve the issue of abundance gradients in clusters, as has been indicated in this and other studies.
References
- (1)
- (2) Allen, S. W., & Fabian, A. C. 1997, MNRAS, 286, 583
- (3)
- (4) Allen, S. W., & Fabian, A. C. 1998, MNRAS, 297, L63
- (5)
- (6) Allen, S. W., Fabian, A. C., Johnstone, R. M., White, D. A., Daines, S. J., Edge, A. C., & Stewart 1993, MNRAS, 262, 901
- (7)
- (8) Arabadjis, J. S., & Bregman, J. N. 1998, ApJ, 510, in press
- (9)
- (10) Bauer, F., & Sarazin, C. L. 1999, in preparation
- (11)
- (12) Briel, U. G., & Henry, J. P. 1994, Nature, 372, 439
- (13)
- (14) Briel, U. G., & Henry, J. P. 1996, ApJ, 472, 131
- (15)
- (16) Bryan, G. L., & Norman, M. L. 1997, in Computational Astrophysics, Proc. 12th Kingston Conference, ed. D. Clarke and M. West (PASP), astro-ph/9710186
- (17)
- (18) Bryan, G. L., & Norman, M. L. 1998, ApJ, 495, 80
- (19)
- (20) Cannon, D. B., Ponman, T. J., & Hobbs, I. S. 1999, MNRAS, 302, 9
- (21)
- (22) David, L. P., Jones, C., & Forman, W. 1996, ApJ, 473, 692
- (23)
- (24) Ebeling, H., Voges, W., Böhringer, H., Edge, A. C., Huchra, J. P., & Briel, U. G. 1996, MNRAS, 281, 799
- (25)
- (26) Eke, V. R., Navarro, J. F., & Frenk, C. S. 1998, ApJ, 503, 569
- (27)
- (28) Ettori, S., Fabian, A. C., & White D. A. 1998, MNRAS, 300, 837
- (29)
- (30) Evrard, A. E., Metzler, C. A., & Navarro, J. F. 1996, ApJ, 469, 494
- (31)
- (32) Evrard, A. E., Mohr, J. J., Fabricant, D. G., & Geller, M. J. 1993, ApJ, 419, L9
- (33)
- (34) Ezawa, H., Fukazawa, Y., Makishima, K., Ohashi, T., Takahara, F., Xu, H., & Yamasaki, N. Y. 1997, ApJ, 490, L33
- (35)
- (36) Frenk, C. S., et al. 1998, preprint
- (37)
- (38) Fujita, Y., Koyama, K., Tsuru, T., & Matsumoto, H. 1996, PASJ, 48, 191
- (39)
- (40) Fujita, Y. 1998, private communication
- (41)
- (42) Hatsukade, I., & Ishizaka, J. 1997, in ASCA/ROSAT Workshop on Clusters of Galaxies, ed. I. Yamagishi and Y. Kawakami, 119
- (43)
- (44) Hatsukade, I., Kawarabata, K., Takenaka, K., & Ishizaka, J. 1996, in X-ray Imaging and Spectroscopy of Cosmic Hot Plasmas, ed. F. Makino & K. Mitsuda (Tokyo:Universal Academy), 105
- (45)
- (46) Henry, J. P., 1998, private communication
- (47)
- (48) Henry, J. P., & Briel, U. G. 1996, ApJ, 472, 137
- (49)
- (50) Henry, J. P., Briel, U. G., Nulsen, P. E. J. 1993, A&A, 271, 413
- (51)
- (52) Huang, Z., & Sarazin, C. L. 1998, ApJ, 496, 728
- (53)
- (54) Ikebe, Y. 1995, Ph.D. thesis, Tokyo Univ.
- (55)
- (56) Ikebe, Y., et al. 1997, ApJ, 481, 660
- (57)
- (58) Jones, C., & Forman, W. 1997, ApJS, submitted
- (59)
- (60) Katz, N., & White, S. D. M. 1993, ApJ, 412, 455
- (61)
- (62) Kikuchi, K., Ohashi, T., Yamasaki, N., Ikebe, Y., Ishisaki, Y., Fukazawa, Y., Takahashi, T., & Sarazin, C. 1996, in X-ray Imaging and Spectroscopy of Cosmic Hot Plasmas, ed. F. Makino & K. Mitsuda (Tokyo:Universal Academy), 391
- (63)
- (64) Kneer, R., Böhringer, H., Neumann, D., & Krautter, J. 1996, in Röntgenstrahlung From the Universe, ed. H. U. Zimmermann, J. Trümper, & H. Yorke (Garching: MPE), 593
- (65)
- (66) Lima Neto, G. B., Pislar, V., Durret, F., Gerbal, D., & Slezak, E. 1997, A&A, 327, 81
- (67)
- (68) Markevitch, M. 1996, ApJ, 465, L1
- (69)
- (70) Markevitch, M., Forman, W. R., Sarazin, C. L., & Vikhlinin, A. 1998, ApJ, 503, 77 (M98)
- (71)
- (72) Markevitch, M., Mushotzky, R., Inoue, H., Yamashita K., Furuzawa, A., & Tawara, Y. 1996, ApJ, 456, 437
- (73)
- (74) Markevitch, M., & Vikhlinin, A. 1997, ApJ, 474, 84
- (75)
- (76) Matsuzawa, H., Matsuoka, M., Ikebe, Y., Mihara, T., & Yamashita, K. 1996, PASJ, 48, 565
- (77)
- (78) Metzler, C. A. 1995, Ph.D. thesis, Univ. Michigan
- (79)
- (80) Navarro, J. F., Frenk, C. S., & White S. D. M. 1995, MNRAS, 275, 720
- (81)
- (82) Ohashi, T., Honda, H., Ezawa, H., & Kikuchi, K. 1997, in X-ray Imaging and Spectroscopy of Cosmic Hot Plasmas, ed. F. Makino & K. Mitsuda (Tokyo:Universal Academy), 49
- (83)
- (84) Raymond, J. C., & Smith, B. W. 1977, ApJS, 35, 419
- (85)
- (86) Peres, C. B., Fabian, A. C., Edge, A. C., Allen, S. W., Johnstone, R. M., & White, D. A. 1998, MNRAS, 298, 416
- (87)
- (88) Pislar, V., Durret, F., Gerbal, D., Lima Neto, G. B., & Slezak, E. 1997, A&A, 322, 53
- (89)
- (90) Sarazin, C. L. 1988, X-Ray Emission from Clusters of Galaxies (Cambridge: Cambridge Univ. Press)
- (91)
- (92) Sarazin, C. L., Burns, J. O., Roettiger, K., & McNamara, B. R. 1995, ApJ, 447, 559
- (93)
- (94) Sarazin, C. L., & McNamara, B. R. 1997, ApJ, 480, 203
- (95)
- (96) Sarazin, C. L., Wise, M. W., & Markevitch, M. L. 1998, ApJ, 498, 606
- (97)
- (98) Serlemitsos, P. J., et al. 1995, PASJ, 47,105
- (99)
- (100) Snowden, S. L. 1995, Cookbook for Analysis Procedures for ROSAT XRT/PSPC Observations of Extended Objects and the Diffuse Background (Greenbelt, MD: Goddard Space Flight Center)
- (101)
- (102) Snowden, S. L., Turner, T. J., George, I. M., & Yusaf, R. 1995, OGIP Calibration Memo CAL/ROS/95-003
- (103)
- (104) Takahashi, T., Markevitch, M., Fukazawa, Y., Ikebe, Y., Ishisaki, Y., Kikuchi, K., Makishima, K., & Tawara, Y. 1995, ASCA Newsletter, #3 (NASA/GSFC)
- (105)
- (106) Tamura, T., et al. 1996, PASJ, 48, 671
- (107)
- (108) White, D. A., Jones, C., & Forman, W. 1997, MNRAS, 292, 419
- (109)
- (110) White, S. D. M., Navarro, J. F., Evrard, A. E., & Frenk, C. S. 1993, Nature, 366, 429
- (111)
- (112) Yamasaki, N., Kikuchi, K., & Ohashi, T. 1997, in ASCA/ROSAT Workshop on Clusters of Galaxies, ed. I. Yamagishi and Y. Kawakami, 185
- (113)