1 Introduction
We discuss observations of the submm-selected galaxy, SMM J023990136, and what has been learnt about it during the year following its discovery. SMM J023990136 was the first distant galaxy detected in submm surveys with SCUBA. Its association with a massive, gas-rich starburst/AGN at has lead to suggestions that the prevalence of AGN in the early Universe may be high (Ivison et al. 1998) and that these AGN may account for a significant fraction of the far-IR background.
2 Discovery
The discovery of SMM J023990136 (Ivison et al. 1998) came as a surprise to all concerned, with the possible exception of Andrew Blain who had been a long-time proponent of submm imaging of the distant Universe using massive cluster lenses (Blain 1997). The discovery images were obtained with SCUBA during uncharacteristically good weather in the summer of 1997 by Smail, Ivison & Blain (1997). As often seems to happen, SMM J023990136 was seen in the first map, behind the massive cluster, Abell 370. The area covered during that first night has since increased by two orders of magnitude, with the completion of the SCUBA Lens Survey (Smail et al. 1998; Blain et al. 1999; Smail et al., these proceedings) and the commencement of several large, conventional blank-field surveys (e.g. Eales et al. 1999) but SMM J023990136 remains the brightest submm-selected galaxy, by virtue of its amplification by the foreground cluster (a factor ). This amplification aids us in the follow-up of SMM J023990136 at all wavelengths, and when combined with the lavish archival datasets available for this field, has allowed a detailed view of the nature of this source to be achieved relatively quickly.
3 New and archival data
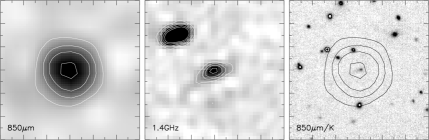
Fortuitously, a deep (10 Jy beam-1) 1.4-GHz map of A 370 obtained some years ago by Frazer Owen and K. S. Dwarakanath revealed a weak, extended radio counterpart within the error box of the submm position of SMM J023990136 (Fig. 1). A pair of optical counterparts, resolved in archival CFHT images (Kneib et al. 1994), are within of the radio source. L1, the compact component, is marginally resolved with an intrinsic FWHM of 0.3′′. L2 has a more complex morphology than L1, showing a ridge of emission to the north and a diffuse region extending south and west towards L1. L1 and L2 are separated by ( kpc after correcting for tangential amplification).
The swift provision of near- and mid-IR images from UKIRT and ISO by Tim Naylor and Leo Metcalfe showed that at least one of the two counterparts possessed a spectral energy distribution (SED) whose broad features were consistent with those expected for a submm-bright galaxy.

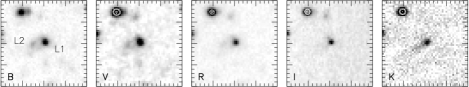
Since the optical counterparts were relatively bright (, ), we added a slit to a mask being using for multi-object spectroscopy of A 370 with the CFHT and obtained high-quality optical spectra (Fig. 2). These clearly show that both counterparts are at the same redshift, . Both have faint continua with narrow lines in emission: L1 shows strong, narrow Ly , N v and C iv, hints of weak Si ii, Si iv, He ii and possibly a broad C iii] line; L2 shows only weak, narrow Ly and Si ii/O i, with the Ly emission extending over at least 8′′.
The 1.4-GHz radio emission covers , with a position angle (PA) of 71∘, a maximum surface brightness of 221 Jy beam-1 and an integrated flux density of Jy. This is below the detection thresholds of most radio surveys, even after lens amplification. The rest-frame far-IR-to-5 GHz flux ratio is similar to that seen in nearby starbursts (Condon et al. 1991), which could be taken as evidence that a starburst is the dominant contributor to the far-IR luminosity; however, a recent 5-GHz map shows a PA closer to the optical/IR morphology, which suggests that the 1.4-GHz emission may be from the AGN.
Near-IR spectra of [O iii] and Balmer were also obtained. Observations of both lines were extremely challenging, as the atmosphere at 1.9 and 2.5 m is a better door than a window. Only modest detections were obtained, suggesting narrow cores to the lines; however, there is little hope of detecting broad components (if present).
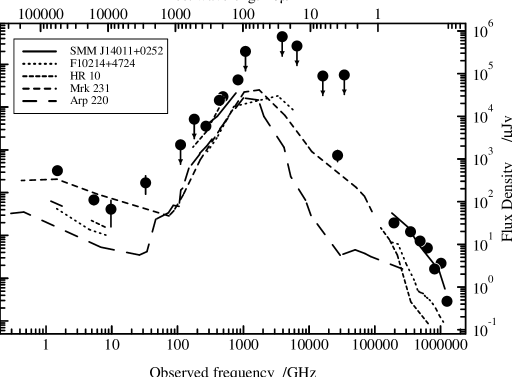
The overall SED of SMM J023990136 is shown in Fig. 3. L1 and L2 both have smooth, steep UV–optical–mid-IR continua. Between 120 and 350 m (rest frame), the SED has the characteristic spectral index of optically-thin emission from dust grains. The far-IR luminosity (20–1000 m), L⊙ (after correcting for lensing). The dust mass is M⊙ for k. If the dust is heated primarily by OB-type stars then corresponds to an SFR ( M⊙ stars) of M⊙ yr-1 ( M⊙ yr-1 if the IMF extends down to much lower masses). Similarly high estimates of the SFR are given by the H luminosity (2000–20000 M⊙ yr-1) and the radio luminosity, which predicts a supernova rate of 80–400 yr-1. By any standards this would be a spectacular starburst.

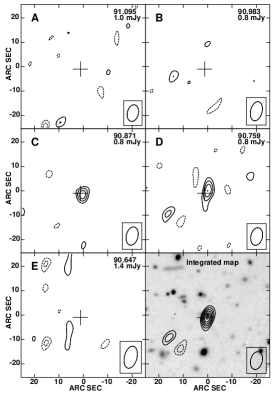
The most recent observational success was a search for molecular gas in the system (Frayer et al. 1998). The search began at the optical redshift, using the Owens Valley Millimeter Array. After 38 hr of integration time, a weak signal with coherent phases was found at the reddest velocities. A further 16 hr was spent at a lower frequency to obtain the complete line profile shown in Fig. 4. The CO emission is unresolved () and positionally coincident with L1. It is redshifted by 400 km s-1 with respect to the optical lines, with . The line is broad ( km s-1), with an apparent double-peaked profile.
The high molecular gas mass implied by the data ( M⊙) lends weight to arguments that a significant fraction of the immense far-IR luminosity is due to star formation. Such a mass is not unique for high-redshift systems but it is several times higher than the most luminous low-redshift IRAS galaxies, implying that SMM J023990136 will evolve into a massive galaxy. The large gas mass, compared to the dynamical mass, suggests that the gas is a dynamically important component of this galaxy and points to its relative youth. On the other hand, the gas-to-dust ratio (400 for k) is similar to that found for other high-redshift CO sources, suggesting that like many other high-redshift massive galaxies, SMM J023990136 is already chemically evolved.
SMM J023990136 is one of two galaxies from the SCUBA Lens Survey to be detected in CO to date, the other being SMM J14011+0252 at (Ivison et al. 1999; Frayer et al. 1999). These are the first two members of the submm field population to be investigated in detail. Their optical emission-line characteristics are radically different, with one showing strong AGN signatures, the other an apparently pure starburst spectrum; however, both are found to be associated with gas-rich, massive galaxies, which supports the idea that a significant proportion of the submm galaxy population is made up of proto-ellipticals.
In summary, SMM J023990136 shows clear signs of the presence of an AGN, both in its optical emission-line properties and its radio morphology. However, there are also indications of an on-going starburst: extended optical emission, narrow and strong H emission, a large mass of dust and a dynamically significant gas reservoir. If asked the question: “Is SMM J023990136 an AGN or a starburst?”, we’d probably have to answer: “Both”. Critical tests of the relative luminosity of the AGN and the starburst include the identification in polarized light of hidden broad-line components to the rest-frame UV/optical emission lines, a search with AXAF for hard X-ray emission (which should escape an obscured active nucleus), and high-resolution 1.4-GHz images to look at the radio emission characteristics in more detail.
We must wait and see whether a significant fraction of submm-selected galaxies resemble SMM J023990136. A large AGN contribution to the far-IR background would certainly resolve potential problems concerning over-production of metals, though there are other solutions — modifying the IMF, for example (Blain et al. 1999). A decisive test of the contribution of AGN-powered emission to the extragalactic background awaits the detailed study of a representative sample of the submm-selected galaxies that dominate the submm background emission. The faintness of these sources in the optical/near-IR and millimetre wavebands compared to the sensitivities of current instrumentation means that the advantages of using lens amplification will probably remain clear for these important studies.
Acknowledgements
We acknowledge support from PPARC and the Royal Society and thank Jacqueline Davidson, Tom Jones and Plaid Cymru for inspiration.
References
- [] Blain, A.W., 1997, MNRAS, 290, 553
- [] Blain, A.W. et al., 1999, MNRAS, 302, 632
- [] Condon, J.J., Frayer, D.T., Broderick, J.J., 1991, AJ, 101, 362
- [] Eales, S.A. et al., 1999, ApJ, in press (astro-ph/9808040)
- [] Frayer, D.T. et al., 1998, ApJ, 506, L7
- [] Frayer, D.T. et al., 1999, ApJ, in press (astro-ph/9901311)
- [] Ivison, R.J. et al., 1998, MNRAS, 298, 583
- [] Ivison, R.J. et al., 1999, MNRAS, submitted
- [] Kneib, J.-P. et al., 1994, A&A, 286, 701
- [] Smail, I., Ivison, R.J., Blain, A.W., 1997, ApJ, 490, L5
- [] Smail, I. et al., 1998, ApJ, 507, L21