VLT and NTT Observations of Two EIS Cluster Candidates.
Abstract
Optical data from the ESO VLT-UT1 Science Verification observations are combined with near-infrared data from SOFI at the NTT to obtain optical-infrared color-magnitude diagrams for the objects in the fields of two EIS cluster candidates. In both cases, evidence is found for a well-defined sequence of red galaxies that appear to be significantly more clustered than the background population. These results suggest that the two systems are real physical associations. The , and colors of the red sequences are used, in conjunction with similar data for spectroscopically confirmed clusters, to obtain redshift estimates of and for these two systems. These results make these EIS cluster candidates prime targets for follow-up spectroscopic observations to confirm their reality and to measure more accurately their redshift.
Key Words.:
Galaxies: clusters: general – large-scale structure of the Universe – Cosmology: observations1 Introduction
Growing evidence for the existence of clusters at and beyond makes the identification and study of these systems of great interest for probing galaxy evolution and cosmological models. However, the number of confirmed systems at these high redshifts is currently very small, precluding any robust statistical analysis. The largest sample of spectroscopically confirmed clusters has been selected from ROSAT deep X-ray observations (Rosati et al. 1998, Rosati 1998), while a few other clusters have been discovered in the surroundings of strong radio sources (e.g., Dickinson 1996; Deltorn et al. 1997), or using infrared observations (e.g., Stanford et al. 1997). Although X-ray and infrared searches are very effective in identifying real clusters, their ability to cover large areas of the sky is presently limited, and these methods are not likely to produce large samples of very distant clusters in the short-term. On the other hand, with the advent of panoramic CCD imagers, optical wide-angle surveys have become competitive in identifying cluster candidates up to . Examples of such surveys, suitable for cluster searches, include those of Postman et al. (1996), Postman et al. (1998) and the ESO Imaging Survey (EIS, Renzini & da Costa 1997), which cover 5, 16 and 17 square degrees, respectively, reaching . These surveys are currently being used for systematic searches of galaxy cluster candidates employing objective matched-filter algorithms (e.g., Postman et al. 1996). In the case of the EIS project, about 300 candidates have been identified, over the redshift interval , out of which 79 are estimated to have (Olsen et al. 1998a, b; Scodeggio et al. 1998). However, only with additional observations can these optically-selected high-redshift candidates be confirmed. Establishing the global success rate of this technique (and its possible redshift dependence) is extremely important for the design of future wide-field optical imaging surveys. Indeed, these surveys may play a major role in significantly increasing the number of known distant clusters, thus making them useful tools for probing the high- universe.
As a test case, two EIS cluster candidates identified in EIS patch B (EIS 0046-2930 and EIS 0046-2951; Olsen et al. 1998b), were observed with the VLT Test Camera (VLT-TC) as part of the ESO VLT-UT1 Science Verification (SV; see Leibundgut, De Marchi & Renzini 1998). After the public release of these Science Verification data, fields including the two candidate clusters have been observed at the ESO 3.5m New Technology Telescope (NTT), as part of an ongoing infrared (IR) survey of EIS patch B (Jørgensen et al. 1999). Therefore, we had the opportunity to combine the VLT optical data with the NTT IR data, and to use both optical and IR color-magnitude (CM) diagrams to search for evidence of a “red sequence” of luminous early-type galaxies, typical of populous clusters at low as well as at high redshift (e.g., Bower, Lucey & Ellis 1992; Stanford, Eisenhardt & Dickinson 1998; Kodama et al. 1998). A clear identification of this sequence would provide strong support to the reality of the clusters, while allowing an independent estimate of their redshift to be obtained.
In this Letter we briefly describe the various observations and the data reduction in Section 2; in Section 3 we present our results; and in Section 4 we summarize our conclusions.
2 Observations and Data Reduction
Originally, four EIS cluster candidates were selected for the VLT-UT1 SV program, after visual inspection of all candidates found in the EIS-wide Patch B. The four targets were selected to cover a range in redshift and richness among the EIS candidates. However, due to time and weather constraints only two fields were actually observed.
| Cluster | Filter | seeing | |
|---|---|---|---|
| (seconds) | arcsec | ||
| EIS 0046-2930 | 2700 | 0.9 | |
| 2700 | 0.8 | ||
| 1500 | 0.9 | ||
| 3000 | 0.8 | ||
| 2400 | 1.1 | ||
| EIS 0046-2951 | 2700 | 1.1 | |
| 1600 | 0.8 | ||
| 3000 | 1.3 | ||
| 3000 | 0.9 |
The optical observations were conducted on the nights of August 18 and 23, 1998 with the Test Camera of the VLT-UT1, as part of the ESO VLT-UT1 Science Verification (1998). The VLT-TC was equipped with an engineering grade Tektronix CCD, covering a field of view of about 93 93 arcsec with an effective pixel size of 0.09 arcsec (after a rebinning). One of the cluster candidates (EIS 0046-2930) was observed in , and the other (EIS 0046-2951) only in the and passbands. In Table 1 we summarize the available data, giving the passband, the corresponding total integration time and the median seeing of the combined images. During the exposure of EIS 0046-2930 the transparency was poor and variable, leading to fairly bright limiting magnitudes. Single exposures have been reduced by the ESO Science Verification Team using standard IRAF procedures, and then publicly released. These reduced images were then processed using the EIS pipeline which performed the astrometric and photometric calibration, and coaddition for each band (see Nonino et al. 1998). The VLT-TC optical data were calibrated against the EIS data, for which the uncertainty in the photometric zero-point was estimated to be 0.1 mag in V and 0.02 mag in I. The VLT-TC versus EIS comparison yields an additional uncertainty of about 0.1 mag. Therefore, we estimate that the overall uncertainty in the zero-points is mag in and 0.12 in .
| Cluster | ||||||||
|---|---|---|---|---|---|---|---|---|
| EIS 0046-2930 | 00:46:29.6 | -29:30:57 | 00:46:27.6 | -29:30:38 | 3.0 | 46 | 0.6 | 1.0 0.1 |
| EIS 0046-2951 | 00:46:07.4 | -29:51:44 | 00:46:06.7 | -29:51:26 | 3.2 | 2 | 0.9 | 0.9 0.15 |
The IR and band images were obtained on October 8 and 9, 1998 using the SOFI infrared spectrograph and imaging camera (Moorwood, Cuby & Lidman 1998) at the NTT. SOFI is equipped with a Rockwell 10242 detector that, when used together with the large field objective, provides images with a pixel scale of 0.29 arcsec, and a field of view of about arcmin. The full set of SOFI observations will be described elsewhere (Jørgensen et al. 1999); here we describe only those for the fields including the two cluster candidates. Total integration times and the seeing measured on the combined images are given in Table 1. The data were reduced using the Eclipse data analysis software package (Devillard 1998), developed to combine jittered images. The resulting combined images were then input to the EIS pipeline for astrometric and photometric calibrations using observations of standard stars given by Persson (1997). From the scatter of the photometric solution we estimate the zero-point uncertainty in the and bands to be mag.
In order to facilitate the analysis of the whole dataset, the images from the EIS-wide survey were resampled to a common reference frame, centered on the initial estimate of the two candidate cluster positions, using the Drizzle routine of the EIS pipeline. The resampled images have the same pixel size as the SOFI images. To improve the sensitivity to faint objects the resampled EIS-wide and SOFI images were combined to produce one very deep image for each field. This image has a sufficiently large field of view ( arcmin) to allow a reliable estimate of the background source density to be obtained (see Section 3). The source extraction software SExtractor (Bertin & Arnouts 1996) was subsequently used to detect sources in these deep images, while measuring the flux parameters for each individual passband in the separate images. Magnitudes and colors were measured using a 4 arcsec diameter aperture.
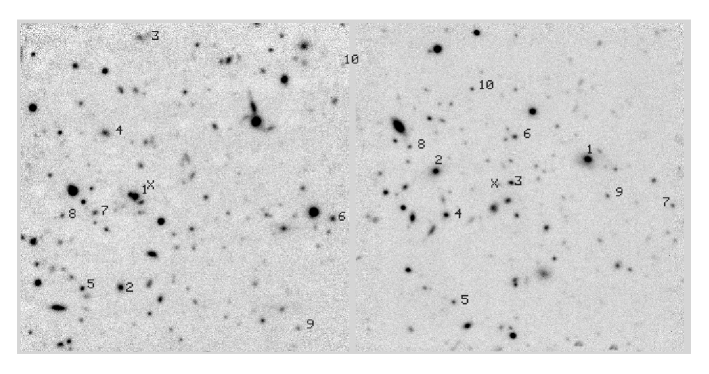
Also all available VLT images were coadded to produce the and images shown in Figure 2. The resulting images are considerably deeper than those from EIS, and also have much better resolution. This procedure has allowed us to reach approximately the same limiting magnitude in both fields ( at about ). Even though the transparency during the observations of the EIS 0046-2930 field was poor, this was compensated by the addition of the band exposure. We have also resampled and combined the VLT-TC images with those from SOFI, using the same method as above.
Using the available multicolor data from EIS-wide plus SOFI, we derived CM-diagrams for all galaxies within 1 arcmin of the nominal candidate cluster centers. From these diagrams, a tentative color-based selection was made, dividing galaxies into cluster candidate members and foreground/background objects. Based on this selection, we computed for each cluster candidate a new position, obtained as the flux-weighted center of mass of the candidate members. An identical procedure was carried out using the SOFI data only, leading to very similar results. In both cases the new positions were found to be within 0.4 arcmin of the position given in the EIS catalog (Olsen et al. 1998b). Note that this corresponds to the pixel size (0.45 arcmin) of the maximum-likelihood map used in the EIS cluster finding procedure.
3 Results
Table 2 gives the original cluster candidates coordinates, the new flux-weighted positions as described above, the significance of the detection, the Abell richness and the estimated redshift from the EIS catalog, as listed in Olsen et al. (1998b) and the new redshifts derived below using the CM-diagrams from the combined VLT-TC and SOFI data. All coordinates are in J2000. Note that the estimate of the Abell richness for distant clusters is quite uncertain, but it serves to indicate their relative richness.


3.1 EIS 0046-2930
In the EIS candidate clusters catalog this object was identified only in -band, and assigned a redshift of . However, visual inspection of the original survey images of this field showed the presence of foreground “blue” galaxies and of a fainter red population, not detected in the band. Using the deeper optical (reaching ) and the IR catalogs produced from the VLT-TC and from the SOFI images, we can study in greater detail this cluster candidate. The resulting four optical and IR CM-diagrams are shown in Figure 1, for all galaxies within the VLT-TC field of view. The upper panel shows the optical CM-diagram, where there is a suggestion for a concentration of galaxies at , just beyond the reach of the EIS color data. However, the scatter is large compared with that seen in clusters at intermediate redshifts (Olsen et al. 1998b), and cannot be explained by photometric errors in the color which at are 0.3 mag. This scatter prevents a secure identification of the red sequence. By contrast, the diagram shows a clear early-type sequence in the interval at . Using the above magnitude range, the CM-relation is well-fitted by a linear relation with an estimated scatter of (), comparable to the estimated error in the color and in agreement with the color dispersion of morphologically classified early-type galaxies in high- clusters (Stanford, Eisenhardt & Dickinson 1998). The infrared diagram shows an even tighter sequence at , with a scatter of 0.1 mag, again comparable with the estimated error in the color. The ten brightest galaxies (in the band) for which and are represented by filled circles in the CM-diagrams and are also numbered in Figure 2 according to their magnitude ranking. These objects are the most likely early-type galaxy members of EIS 0046-2930. The flux-weighted position of the “cluster” is also shown.
The projected radial distribution of objects brighter than and within the color range , is shown in Figure 3, in annuli 0.3 arcmin wide. The contrast of this bright red-sequence population relative to the background is clearly seen, while there appears to be no appreciable clustering for galaxies outside this color range. Even though the statistic is poor, the scale and amplitude of the overdensity associated to this population, a factor of 7 within the innermost 0.3 arcmin, are similar to those observed by Dickinson (1996) for the cluster surrounding 3C 324 at . To test the robustness of this results flanking fields with the same size of the VLT-TC field of view were extracted from the same SOFI image and used to obtain CM-diagrams and radial density profiles. None of these fields showed the presence of a concentration of galaxies both in color and in position. This suggests that the concentration of galaxies in both color and projected separation seen in the field of EIS 0046-2930 is significant and that this object is likely to be a real cluster. Further support to this conclusion comes from the matched-filter algorithm which applied to the band data detects a “cluster” at the level and at .
On the presumption that EIS 0046-2930 is a real cluster, the color of the red sequence can be used to estimate its redshift. This can be achieved either by using synthetic stellar population models, or purely empirically using the colors of the red sequence of clusters of known redshift. Even though the available data are sparse, we have adopted the latter approach because it is model independent. We have used the spectroscopic redshifts and the CM-diagrams given by Stanford, Eisenhardt & Dickinson (1998) for their clusters at and the cluster of Stanford et al. (1997) to estimate the location of the early-type galaxies sequence in different passbands for clusters at . Interpolating these relations to the colors of the red sequence of EIS 0046-2930 (, , and ) we consistently estimate its redshift to be (statistical uncertainty only).
3.2 EIS 0046-2951
In the EIS catalog this object was estimated to have a redshift of , being detected only in the -band (Table 2). However, visual inspection of the and band EIS images suggested that this system could be an overlap of two concentrations at different redshifts. Using the deeper band image obtained with the VLT-TC we are now able to investigate the optical CM-diagram shown in Figure 4. Indeed, we find two concentrations of galaxies: one seen at and another at . These colors correspond to redshifts and , respectively. However, in the and CM-diagrams only one sequence is seen, located at and . These values lead to redshift estimates of in both cases, in good agreement with the original estimate based on the matched-filter algorithm. In contrast to the previous cluster, the scatter of the red sequence in both colors is significantly larger (0.21 in and 0.19 in ) and cannot be fully accounted for by the photometric errors in our data ( 0.15 mag). The larger scatter may be due to a larger fraction of spiral galaxies in the “cluster”, or to a stronger contamination by foreground galaxies. As in the previous case, the most likely early-type cluster galaxies have been selected adopting a color-selection criterion similar to that described above. These galaxies, chosen to have and , are identified in Figure 4 and in the right panel of Figure 2.
Figure 5 shows the projected radial distribution of color-selected candidate cluster members. In this case we find that the overdensity of the red sequence galaxies is 5, over the same radial distance as for the previous cluster. The smaller overdensity of this candidate cluster (and perhaps the larger fraction of spirals) is consistent with the lower original estimate of its richness (Table 2). Note that a 3 detection at approximately the same redshift was obtained applying the matched-filter algorithm to the data. As for the previous object, the analysis of flanking fields from the SOFI image gives further support to the reality of the observed concentration in color and projected separation, suggesting the existence of a physical association.
4 Summary
We have used deep - and -band images of two EIS cluster candidates taken during the ESO VLT-UT1 Science Verification observations to investigate the reality of these clusters. The VLT data were complemented by infrared data taken with SOFI at the NTT. Optical, IR, and optical-IR CM-diagrams have been constructed to search for the presence of the red-sequence typical of bright early-type galaxies in clusters.
In the case of EIS 0046-2930 we find a well-defined sequence at and . These galaxies are also concentrated relative to the background suggesting the existence of a cluster at . The evidence for the other candidate, EIS 0046-2951, is less compelling even though we find a sequence at and , leading to an estimated redshift of , consistent with its original estimate. However, the scatter in the CM-diagrams is large and the density contrast of the “cluster” relative to the background smaller. In any case, a final conclusion on whether these systems are real physical associations at high-redshift must await spectroscopic observations.
These results demonstrate once again the importance of infrared data in locating high-redshift clusters. However, the small field of view of present IR detectors makes large solid angle IR surveys very expensive in terms of telescope time. On the other hand, wide angle optical surveys can efficiently produce a great number of high redshift candidates, but with a major fraction of them which may turn to be spurious after time-consuming spectroscopic follow up. The present experiment is an attempt at exploring a hybrid approach, in which the optically selected candidates are first imaged in the IR before being considered for spectroscopic follow up at a large telescope such as the VLT. Besides providing a first verification of the candidate clusters, the IR images can then be used to search for clusters at higher redshift. The overall efficiency of this strategy remains to be empirically determined, e.g. for the actual complement of ESO telescopes and instruments, and the present paper represents a first step in this direction.
Acknowledgements.
We acknowledge that this work has been made possible thanks to the Science Verification Team and EIS Team efforts in making the data publicly available in a timely fashion. Special thanks to R. Gilmozzi, B. Leibundgut and J. Spyromilio. Part of the data presented here were taken at the New Technology Telescope at the La Silla Observatory under the program ID 62.O-0514. We thank Hans Ulrik Nørgaard-Nielsen, Leif Hansen and Per Rex Christensen for allowing us to use the data prior to publication.References
- (1) Bertin, A. & Arnouts, S., 1996, A&AS, 117, 393
- (2) Bower, R., Lucey, J. & Ellis, R., 1992, MNRAS, 254, 601
- (3) Butcher, H. & Oemler, A. , 1984, ApJ, 285, 426
- (4) Deltorn, J.M., Le Févre, O., Crampton, D., Dickinson, M., 1997, ApJ, 483, L21
- (5) Devillard, N., 1998, Eclipse Data Analysis Software Package (ESO: Garching)
- (6) Dickinson, M., 1996, in “Science with the VLT”, ed. J. Bergeron, (Kluwer:Berlin), p. 274
- (7) Jørgensen et al. , 1999, in preparation
- (8) Kodama, T, Arimoto, N., Barger, A. J. & Aragon-Salamanca, A., 1998, astro-ph/9802245
- (9) Leibundgut, B., De Marchi, G., & Renzini, A. 1998, The Messenger, 92, 5
- (10) Moorwood, A., Cuby, J.G. & Lidman, C., 1998, The Messenger, 91, 9
- (11) Nonino, M., et al. 1998, A&A, in press (astro-ph/9803336)
- (12) Olsen, L.F., et al. 1998a, A&A, in press (astro-ph/9803338)
- (13) Olsen, L.F., et al. 1998b, A&A, submitted (astro-ph/9807156)
- (14) Persson, S.E., 1997, private communication
- (15) Postman, M., Lubin, L.M., Gunn, J.E., Oke, J.B., Hoessel, J.G., Schneider, D.P., Christensen, J.A. 1996, AJ, 111, 615
- (16) Postman, M., Lauer, T.R., Szapudi, I., Oegerle, W., 1998, ApJ, 506, 33
- (17) Renzini, A. & da Costa, L., 1997, The Messenger, 87, 23
- (18) Rosati, P., Della Ceca, R., Burg, R., Norman, C., & Giacconi, R. 1998, ApJ, 445, L11
- (19) Rosati, P., 1998, astro-ph/9810054
- (20) Scodeggio, M., et al. 1998, A&A, in press(astro-ph/9807336)
- (21) Stanford, A., Elston, R., Eisenhardt, P., Spinrad, H., Stern, D. & Dey, A., 1997, AJ, 114, 2232
- (22) Stanford, A., Eisenhardt, P. & Dickinson, M., 1998, ApJ, 492, 461