SGR 1806-20 Is a Set of Independent Relaxation Systems.
Abstract
The Soft Gamma Repeater 1806-20 produced patterns of bursts during its 1983 outburst that indicate multiple independent energy accumulation sites, each driven by a continuous power source, with sudden, incomplete releases of the accumulated energy. The strengths of the power sources and their durations of activity vary over several orders of magnitude.
1 Introduction
Soft Gamma Repeaters (SGRs) are very highly magnetized (), slowly rotating (), young () neutron stars that produce multiple bursts of soft gamma-rays, often at super-Eddington luminosities ( in a few tenths of a second). Two of these objects (SGR 0526-66 and SGR 1900+14) have also produced hard, extremely intense superbursts ( in a few tenths of a second). In the Thompson & Duncan (1995) model, the smaller bursts are produced by ‘crustquakes’ in the neutron star, while the larger bursts are produced by global reconfiguration of the magnetic field.
Four of these objects have been discovered so far, including SGR 1806-20 (Atteia et al. 1987; Laros et al. 1987), the subject of this Letter. Observations of SGR 1806-20 with the XTE PCA (1996 Nov) and ASCA (1993 Oct) find that its quiescent emission shows a 7.47 s periodicity with a spin-down rate of , implying a magnetic field of and a characteristic spin-down age of 1500 years (Kouveliotou et al. 1998). This source is associated with the SNR G10.0-0.3, which has an inferred age of 5000 years (Kulkarni & Frail, 1993). Corbel et al. (1997) measure the distance to this SNR as kpc.
The intervals between successive bursts are distributed lognormally (Hurley et al. 1994). Cheng et al. (1995) found that this distribution, the correlation between successive waiting intervals, and the distribution of intensities (a power law with a high-intensity cutoff) are similar to the behavior of earthquakes. Previous analyses have found no clear relationship between the timing of the bursts and their intensities (Laros et al. 1987; Ulmer et al. 1993).
This Letter demonstrates that SGR 1806-20 contains multiple systems that continuously accumulate energy and discontinuously release it as bursts. This is consistent with the crustquake model (with multiple seismic zones) but not with, e.g., impact event, continuous accretion, or disk instability models.
2 Observations and Analyses
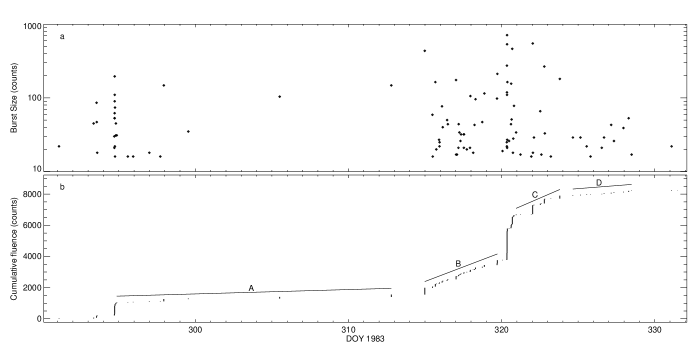
The data analyzed in this Letter are from the 134 bursts catalogued in Ulmer et al. (1993) from the University of California, Berkeley/Los Alamos National Laboratory instrument on the International Cometary Explorer (ICE) during the SGR’s 1979-1984 term of activity. This activity peaked in 1983 Oct-Nov with more than 100 detected bursts, including 20 on Nov 16 (Day Of Year 320). Figure 1a is the history of bursts during this period, showing the time and burst size as measured by counts in the 26-40 keV channel of ICE’s scintillating detector.
Figure 1b shows the cumulative fluence, the running sum of the burst sizes, as a function of time. If we assume that the burst catalog provides a good and complete measure of the energy emitted as bursts by this source, then we may use this to understand the energetics of the bursting mechanism. Section 2.1, below, examines and validates this assumption.
Figure 1b shows that the rate of energy release varies dramatically over this time period. However, intervals are apparent when the average power, averaged over many bursts, is approximately constant, giving a constant slope. The intervals marked , , and are selected for further study in this Letter.
A relaxation system is a system which continuously accumulates an input quantity (e.g., energy) in a reservoir, and discontinuously releases it. For a system that starts with a quantity in its reservoir, accumulates at a rate , and releases with events of size instantaneously at times , the contents of the reservoir as a function of time is given by
The simplest behavior from such a system occurs with a constant accumulation rate , a fixed ‘trip point’ which triggers a release when , and a constant release size , giving a periodic relaxation oscillator with . If the accumulation rate, trip point, or release strength are not constant, then more complicated behavior results. Stick-slip (including earthquake) and avalanche systems are other examples of relaxation systems. If the reservoir has a maximum capacity such that , and constant rate , the sum of releases approximates a linear function of time: . The linear sections of Figure 1b can be tested to see if they are consistent with such relaxation systems.
The interval , detailed in Figure 2a, demonstrates this behavior. The cumulative fluence is bounded above by a linear function of time, corresponding to a rate of 392 counts per day. The maximum deviation below the line is comparable to the size of the largest bursts. Assuming that energy flows into a reservoir at this constant rate and is released only as the catalogued bursts, we can model the energy in the reservoir by subtracting the emitted fluence from the integrated input energy, as shown in Figure 2b. The bursts have an apparent tendency to keep the reservoir at low levels—the cumulative fluence tends to stay near the linear function. A statistical analysis (see Section 2.2) shows that, if these same bursts were arranged randomly, the cumulative fluence would tend to deviate much more from the best linear rate than is observed here. This is very strong evidence that these bursts come from a relaxation system.
Interval may be a continuation of this relaxation system. Its average rate is consistent with that of and, if it is assumed that a few of the many bursts in the intervening time are from this system, the two intervals can be combined in a plot qualitatively similar to Figure 2. However, the interval between and is the most active period ever seen for this source, including a single hour which has approximately as much fluence as the entire 5-day interval . That this violent activity does not affect the parameters of the relaxation system suggests that it comes from a physically independent site, perhaps a different location on the neutron star.
The 9-burst interval , detailed in Figure 3, is also consistent with a relaxation system if you omit the single burst that occurs at 1983 DOY 297.940. The remaining bursts are consistent with a constant- relaxation system in which most of the bursts are total releases of the reservoir energy. The rate for is a factor of 20 below that of and , suggesting that it is a different system. The high statistical quality of the relaxation system fit to those eight bursts clearly identifies the remaining burst as an interloper (Section 2.2).
The interval (11 bursts), appears to have two different energy accumulation rates differing by 40% (57 counts/day for 5 bursts , then 96 counts/day for 6 bursts ). These rates are comparable to each other, and far from those of and , so may represent a single system that speeds up slightly between and , rather than two different systems.
2.1 Cumulative Fluence as an Integrating Bolometer
The sum of the catalogued burst intensities is a good measure of the integrated burst energy emitted by the object to the extent that a) the catalog contains all bursts above a certain threshold and is uncontaminated, b) the bursts below that threshold contain only a small fraction of the total energy, c) the detected counts are proportional to the energy released in the direction of the detector, and d) the fraction of energy released in the direction of the detector is constant and, specifically, independent of the neutron star spin phase. Violation of any of these conditions would cause ‘noise’ in our analysis, which could distort our understanding of the source’s burst energy output.
a) catalog completeness—ICE was an interplanetary spacecraft, and so its observations were not continually interrupted by occultations, as Earth satellite observations often are, nor hampered by rapidly varying background from orbiting within Earth’s magnetosphere. ICE thus provides a long, continuous, and stable set of measurements resulting in a uniform catalog with good completeness down to the instrument’s sensitivity limit of 16 counts. The false-trigger rate in the catalog is estimated to be (Laros et al. 1987).
b) subthreshold bursts—The observed burst intensity distribution power law, (Cheng et al. 1995) has an index , which places most of the energy in the largest bursts up to the high-E cutoff. Recent XTE PCA observations find that this power-law distribution extends to bursts far below the ICE threshold (Dieters, priv. comm.). An extrapolation to zero of the integrated energy as a function of burst size indicates that of the burst energy is sub-threshold. The noise due to sub-threshold bursts would be muted if the energy comes out in the form of many small bursts, randomly distributed in time. Indeed, 80% of the sub-threshold energy is extrapolated to be in bursts at least a factor of 2 below our threshold but, as this Letter shows, bursts are not randomly distributed in time, so these small bursts still have the potential to cause problems.
c) intensity-energy relationship—The catalogued burst size (the number of counts detected in the 26-40 keV channel of a scintillator) is proportional to the total energy fluence incident on the detector if the bursts always have similar spectra. Fenimore, Laros & Ulmer (1994) find that the spectral shape of bursts from this source is largely independent of the burst fluence with a small scatter in the burst hardness. The spectral fits indicate that each count represents the emission of of X/-rays.
d) isotropic emission and rotational modulation—SGRs are rotating neutron stars, and anisotropic emission would make the relationship between total emitted energy and the detected counts dependent on the neutron star’s rotational phase. Fourier analysis of the times of bursts in interval (which, coming from a single system, might be expected to show the strongest phase coherence) showed no significant modulation for periods between 7.40 and 7.48 seconds—the reasonable range of extrapolations to 1983 of the Kouveliotou et al. (1998) measured period and spindown rate. Weighting the times either directly or inversely with showed that both strong and weak bursts were independent of spin phase.
These conditions merely ensure that the measured running sum of burst sizes is a good approximation to the total emitted burst X/-ray energy. The energy which flows into the reservoir may escape, undetected, through other channels of non-burst or non-X/ energy release. However, as the data show, any energy leaks are not severe enough to conceal SGR 1806-20’s relaxation system behavior.
2.2 Statistical Analysis
Any set of events can be trivially described as a relaxation system, assuming a sufficiently large reservoir and an arbitrary set of release times and sizes. However, relaxation systems with specific properties can be distinguished from random systems by use of a test statistic designed to detect those properties. If the observed value of this test statistic is outside of the range expected for a random process, then that is proof that the system is non-random, and evidence of a physically-significant relaxation system.
For a relaxation system with a constant accumulation rate, a reservoir small compared to the total emitted energy, and a tendency to release a large fraction of the available energy, a promising statistic is the Sum Of Residuals (SOR). This is the sum of the energies left in the reservoir immediately after each burst . Since the contents of the reservoir and the accumulation rate are not directly observable, the SOR is minimized with respect to a constant rate and an empty-reservoir time with the constraint that each residual must be for all .
The SOR value can be calculated for the observed data and then, by a bootstrap method, compared to the distribution of SOR values calculated for randomized versions of the data. For this analysis, the randomized data is produced by ‘shuffling’ (selection without replacement) the burst intensities while keeping the burst times the same. This procedure trivially preserves all previously-known characteristics of the data (intensity distribution, interval distribution, and interval-interval correlation) to ensure that the relaxation system behavior is not an artifact of these characteristics.
The entire 134-burst catalog was searched for the sub-interval of bursts with the lowest SOR. This located the interval . Then, for each of trials, the burst intensities were shuffled as described above, and the randomized catalog was again searched for the -burst interval with the lowest SOR. (In most cases, this interval was essentially the same as interval .) In only 21 of trials was the SOR lower than that of the observed data. (This result is moderately insensitive to the value of , giving similar values for and , and increasing by an order of magnitude at .) This demonstrates at the 99.998% confidence level that the intensities are inconsistent with chance, and are correlated with burst times in a manner that implies a relaxation system during this time period.
With the existence of relaxation systems demonstrated, they can be sought in other intervals, with the randomization restricted to specific sets of consecutive bursts. For all 9 bursts in (DOY 294.867-312.797) the SOR statistic does not distinguish the measurements from the randomized trials. However, when the SOR minimization is permitted to discard any one burst (from each of the observed and randomized trials), the observed data is non-random at the level. This is evidence, not just that 8 of the bursts are from a relaxation system, but that the remaining burst belongs to a different system. The false-trigger rate in this catalog is estimated to be (Laros et al. 1987), or a chance of occurring during this time interval. This implies that the extra burst was from SGR 1806-20, but was not from the system responsible for the other bursts during .
Interval , as fit by a relaxation system with a single rate change, is non-random at the 97% level. This result, although marginal, suggests that systems on SGR 1806-20 can change their accumulation rate.
3 Discussion
As shown in this Letter, some of the bursts from SGR 1806-20 come from relaxation systems. Additional examples can be found in the burst history, and parsimony suggests that all SGR bursts (except, perhaps, superbursts) are from such systems. This would not always be easily demonstrable, even if observations meet all of the requirements of Section 2.1. Single systems that produce only a few bursts, rapidly vary their accumulation rates, or have reservoirs large compared to the typical burst size could be indistinguishable from random. Multiple simultaneously active systems could be difficult to disentangle.
The accumulation rates for the intervals discussed in this paper are as low as 19 counts/day (equivalent to ) for the 18-day interval , and as high as 392 counts per day (equivalent to ) for interval . Accumulation rates up to 80,000 counts/day (equivalent to ) are seen during the peak hour of activity on 1983 Nov 16, probably in one or a few relaxation systems. There are also quiescent intervals when no bursts are seen for years—between 1985 Aug and 1993 Sep, the available instruments (which provide incomplete coverage) recorded no bursts that are attributed to SGR 1806-20.
If all SGR bursts are from relaxation systems, the available data show that there can be multiple systems active simultaneously. The conditions which activate such systems are global to the SGR—several systems are apparent in the months covered by this Letter, but there are years when no systems are active. However, each system is independent in that it has its own accumulation rate and reservoir.
Relaxation systems are incompatible with SGR models in which each burst is produced by the accretion of a distinct object, such as neutron stars invading another star’s Oort cloud. Continuous accretion with episodic burning, as in a nova, is a type of relaxation system, but it would be difficult for accretion to independently feed multiple sites, each with its own rate and beginning and ending times.
This analysis extends the earthquake analogy of Thompson & Duncan (1995) beyond the similarity of the intensity distribution and the interval relationships found by Cheng et al. (1995). Seismic regions are relaxation systems, driven by quasi-steady accumulation of tectonic stress due to continental drift, with sudden, incomplete releases of energy as earthquakes. Tsuboi (1965), using an analysis similar to this Letter’s, found that the energy released by earthquakes in and near Japan during 1885-1963 is consistent with a constant input rate into a finite reservoir.
Further studies of this aspect of SGRs can be made using continuously-operating gamma-ray instruments on interplanetary spacecraft, such as those on Ulysses, Near Earth Asteroid Rendezvous and Wind. Although XTE is continually interrupted by Earth occultations, its high sensitivity might allow it to determine if the smallest, most frequent bursts also demonstrate the behavior of relaxation systems over short time intervals. The comparison of SGRs with earthquakes may improve our understanding of both types of events.
References
- (1) Atteia, J.-L., et al., 1987, ApJ, 320, L105
- (2) Cheng, B., Epstein, R.I., Guyer, R.A., & Young, A.C. 1995, Nature 382, 518
- (3) Corbel, S., Wallyn, P., Dame, T.M., Duruchoux, P., Mahoney, W.A., Vilhu, O., & Grindlay, J.E. 1997, ApJ, 478, 624
- (4) Fenimore, E.E., Laros, J. G., & Ulmer, A. 1994, ApJ, 432, 742
- (5) Kouveliotou, C., et al. 1998, Nature, 393, 235
- (6) Hurley, K.J., McBreen, B., Rabbette, M., and Steel, S., 1994, A&A, 288, L49
- (7) Kulkarni, S.R. & Frail, D.A., 1993, Nature, 365, 33
- (8) Laros, J.G., et al. 1987, ApJ, 320, L111
- (9) Thompson, C., & Duncan, R.C., 1995, MNRAS, 275, 255
- (10) Tsuboi, C., 1965, Proc. Jap. Acad., 41, 392
- (11) Ulmer, A., Fenimore, E.E., Epstein, R.I., Ho, C., Klebesadel, R.W., Laros, J.G., & Delgado, F. 1993, ApJ, 418, 395