Dark Matter and Energy in the Universe
111To appear in Physica Scripta,
Proceedings of the Nobel Symposium, Particle Physics
and the Universe (Enkoping, Sweden, August 20-25, 1998)
Michael S. Turner
Departments of Astronomy & Astrophysics and of Physics
Enrico Fermi Institute, The University of Chicago, Chicago, IL 60637-1433
NASA/Fermilab Astrophysics Center
Fermi National Accelerator Laboratory, Batavia, IL 60510-0500
ABSTRACT
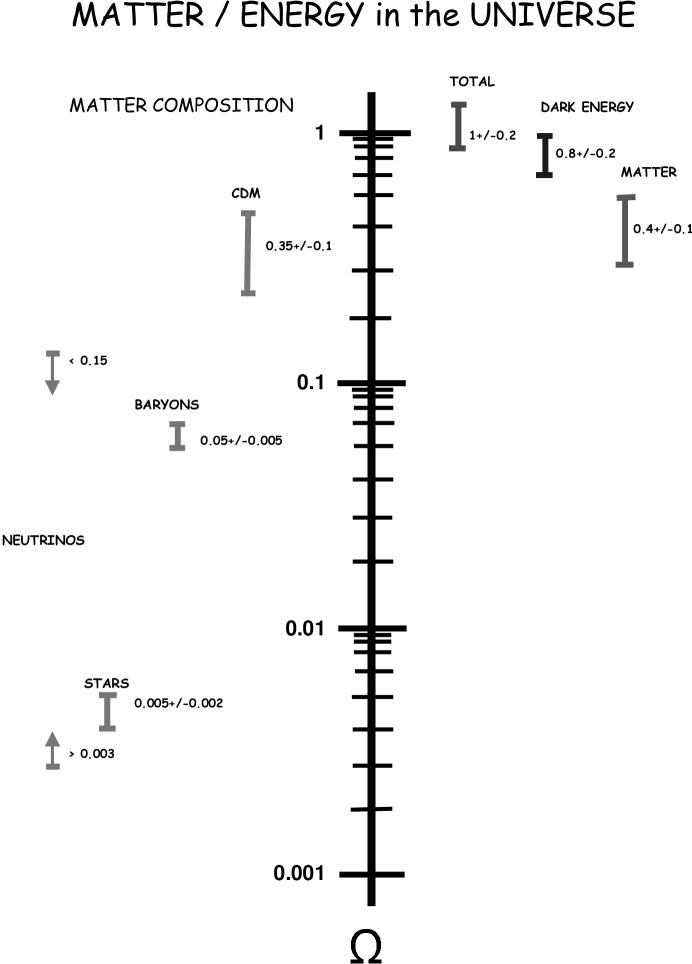
For the first time, we have a plausible and complete accounting of matter and energy in the Universe. Expressed a fraction of the critical density it goes like this: neutrinos, between 0.3% and 15%; stars, between 0.3% and 0.6%; baryons (total), ; matter (total), ; smooth, dark energy, ; totaling to the critical density (within the errors). This accounting is consistent with the inflationary prediction of a flat Universe and defines three dark-matter problems: Where are the dark baryons? What is the nonbaryonic dark matter? What is the nature of the dark energy? The leading candidate for the (optically) dark baryons is diffuse hot gas; the leading candidates for the nonbaryonic dark matter are slowly moving elementary particles left over from the earliest moments (cold dark matter), such as axions or neutralinos; the leading candidates for the dark energy involve fundamental physics and include a cosmological constant (vacuum energy), a rolling scalar field (quintessence), and a network of light, frustrated topological defects.
1 Introduction
The quantity and composition of matter and energy in the Universe is of fundamental importance in cosmology. The fraction of the critical energy density contributed by all forms of matter and energy,
| (1) |
determines the geometry of the Universe:
| (2) |
Here, subscript ‘0’ denotes the value at the present epoch, , is the fraction of critical density contributed by component (e.g., baryons, photons, stars, etc) and . The sign of specifies the spatial geometry: positive for a 3-sphere, negative for a 3-saddle and 0 for the flat space.
The present rate of deceleration of the expansion depends upon as well as the composition of matter and energy,
| (3) |
The pressure of component , ; e.g., for baryons , for radiation , and for vacuum energy .
The fate of the Universe – expansion forever or recollapse – is not directly determined by and/or . It depends upon precise knowledge of the composition of all components of matter and energy, for all times in the future. Recollapse occurs only if there is a future turning point, that is an epoch when the expansion rate,
| (4) |
vanishes and
| (5) |
is less than zero. In a universe comprised of matter alone, a positively curved universe () eventually recollapses and a negatively curved universe () expands forever. However, exotic components complicate matters: a positively curved universe with positive vacuum energy can expand forever, and a negatively curved universe with negative vacuum energy can recollapse.
The quantity and composition of matter and energy in the Universe is also crucial for understanding the past. It determines the relationship between age of the Universe and redshift, when the Universe ended its early radiation dominated era, and the growth of small inhomogeneities in the matter. Ultimately, the formation and evolution of large-scale structure and even individual galaxies depends upon the composition of the dark matter and energy.
Measuring the quantity and composition of matter and energy in the Universe is a challenging task. Not just because the scale of inhomogeneity is so large, around Mpc; but also, because there may be components that remain exactly or relatively smooth (e.g., vacuum energy or relativistic particles) and only reveal their presence by their influence on the evolution of the Universe itself.
2 A Complete Inventory of Matter and Energy
2.1 Preliminaries
2.1.1 Radiation
Because the cosmic background radiation (CBR) is known to be black-body radiation to very high precision (better than ) and its temperature is known to four significant figures, K, its contribution is very precisely known, . If neutrinos are massless or very light, eV, their energy density is equally well known because it is directly related to that of the photons, (per species) (there is a small 1% positive correction to this number; see Dodelson & Turner, 1992).
It is possible that additional relativistic species contribute significantly to the energy density, though big-bang nucleosynthesis (BBN) severely constrains the amount (the equivalent of less than 0.4 of a neutrino species; see e.g., Burles et al, 1999) unless they were produced by the decay of a massive particle after the epoch of BBN.
In any case, we can be confident that the radiation component of the energy density today is small. The matter contribution (denoted by ), consisting of particles that have negligible pressure, is the easiest to determine because matter clumps and its gravitational effects are thereby enhanced (e.g., in rich clusters the matter density typically exceeds the mean density by a factor of 1000 or more). With this in mind, I will decompose the present matter/energy density into two components, matter and vacuum energy,
| (6) |
ignoring the contribution of the CBR and ultrarelativistic neutrinos. I will use vacuum energy as a stand in for a smooth component (more later). Vacuum energy and a cosmological constant are indistinguishable: a cosmological constant corresponds to a uniform energy density of magnitude .
2.2
There is a growing consensus that the anisotropy of the CBR offers the best means of determining the curvature of the Universe and thereby , cf., Eq. (2). This is because the method is intrinsically geometric – a standard ruler on the last-scattering surface – and involves straightforward physics at a simpler time (see e.g., Kamionkowski et al, 1994).
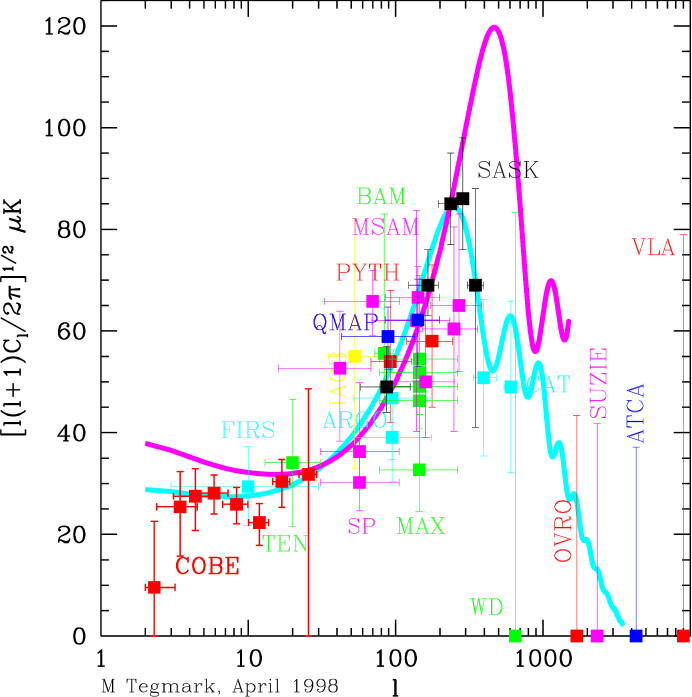
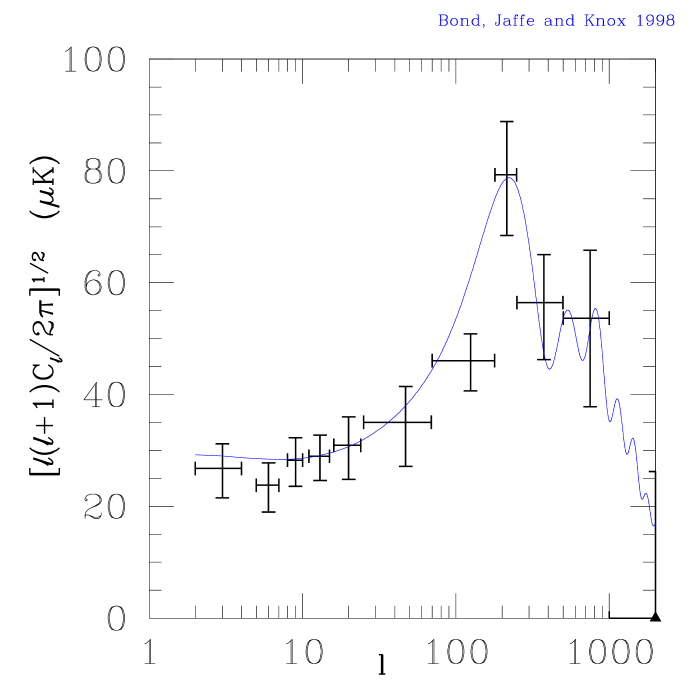
At last scattering baryonic matter (ions and electrons) was still tightly coupled to photons; as the baryons fell into the dark-matter potential wells the pressure of photons acted as a restoring force, and gravity-driven acoustic oscillations resulted. These oscillations can be decomposed into their Fourier modes; Fourier modes with determine the multipole amplitudes of CBR anisotropy. Last scattering occurs over a short time, making the CBR is a snapshot of the Universe at yrs. Each mode is “seen” in a well defined phase of its oscillation. (For the density perturbations predicted by inflation, all modes the have same initial phase because all are growing-mode perturbations.) Modes caught at maximum compression or rarefaction lead to the largest temperature anisotropy; this results in a series of acoustic peaks beginning at (see Fig. 2). The wavelength of the lowest frequency acoustic mode that has reached maximum compression, , is the standard ruler on the last-scattering surface. Both and the distance to the last-scattering surface depend upon , and the position of the first peak . This relationship is insensitive to the composition of matter and energy in the Universe (see Spergel, 1999).
CBR anisotropy measurements, shown in Figs. 2 and 3, now cover three orders of magnitude in multipole number and involve more than twenty experiments. COBE is the most precise and covers multipoles ; the other measurements come from balloon-borne, Antarctica-based and ground-based experiments using both low-frequency (GHz) HEMT receivers and high-frequency (GHz) bolometers. Taken together, all the measurements are beginning to define the position of the first acoustic peak, at a value that is consistent with a flat Universe. Various analyses of the extant data have been carried out, indicating (see e.g., Lineweaver, 1998). It is certainly too early to draw definite conclusions or put too much weigh in the error estimate. However, a strong case is developing for a flat Universe and more data is on the way (Python V, Viper, MAT, Maxima, Boomerang, DASI, and others). Ultimately, the issue will be settled by NASA’s MAP (launch late 2000) and ESA’s Planck (launch 2007) satellites which will map the entire CBR sky with 30 times the resolution of COBE (around ) (see Wilkinson, 1999).
2.3 Matter
2.3.1 Baryons
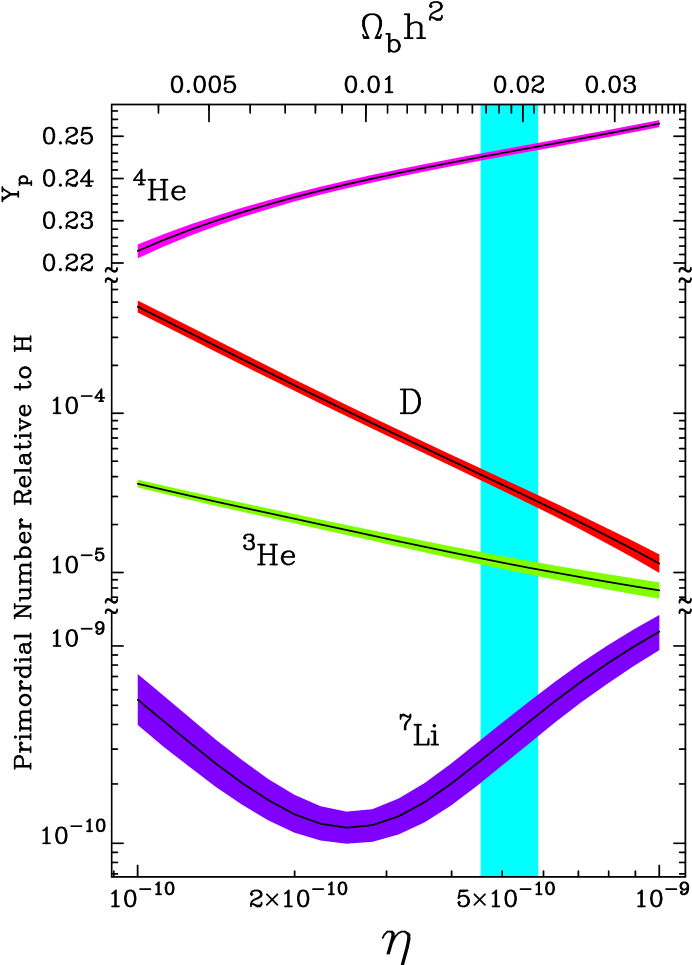
For more than twenty years big-bang nucleosynthesis has provided a key test of the hot big-bang cosmology as well as the most precise determination of the baryon density. Careful comparison of the primeval abundances of D, 3He, 4He and 7Li with their big-bang predictions defined a concordance interval, (see e.g., Copi et al, 1995; for another view, see Hata et al, 1995).
Of the four light elements produced in the big bang, deuterium is the most powerful “baryometer” – its primeval abundance depends strongly on the baryon density () – and the evolution of its abundance since the big bang is simple – astrophysical processes only destroy deuterium. Until recently deuterium could not be exploited as a baryometer because its abundance was only known locally, where roughly half of the material has been through stars with a similar amount of the primordial deuterium destroyed. In 1998, the situation changed dramatically, launching BBN into the precision era of cosmology.
Over the past four years there have been claims of upper limits, lower limits, and determinations of the primeval deuterium abundance, ranging from (D/H) to (D/H) . In short, the situation was confusing. In 1998 Burles and Tytler clarified matters and established a strong case for (D/H) (Tytler, 1999). That case is based upon the deuterium abundance measured in four high-redshift hydrogen clouds seen in absorption against distant QSOs, and the remeasurement and reanalysis of other putative deuterium systems. In this enterprise, the Keck I 10-meter telescope and its HiRes Echelle Spectrograph have played the crucial role.
The Burles – Tytler measurement turns the previous factor of three concordance range for the baryon density into a 10% determination of the baryon density, or (see Fig. 4), with about half the error in coming from the theoretical error in predicting the BBN yield of deuterium. [A very recent analysis has reduced the theoretical error significantly, and improved the accuracy of the determination of the baryon density, (Burles et al, 1999).]
This precise determination of the baryon density, based upon the early Universe physics of BBN, is consistent with two other measures of the baryon density, based upon entirely different physics. By comparing measurements of the opacity of the Lyman- forest toward high-redshift quasars with high-resolution, hydrodynamical simulations of structure formation, several groups (Meiksin & Madau, 1993; Rauch et al, 1997; Weinberg et al, 1997) have inferred a lower limit to the baryon density, (it is a lower limit because it depends upon the baryon density squared divided by the intensity of the ionizing radiation field). The second test involves the height of the first acoustic peak: it rises with the baryon density (the higher the baryon density, the stronger the gravitational force driving the acoustic oscillations). Current CBR measurements are consistent with the Burles – Tytler baryon density; the MAP and Planck satellites should ultimately provide a 5% or better determination of the baryon density, based upon the physics of gravity-driven acoustic oscillations when the Universe was 300,000 yrs old (see e.g., Spergel, 1999). This will be an important cross check of the BBN determination.
2.3.2 Weighing the dark matter:
Since the pioneering work of Fritz Zwicky and Vera Rubin, it has been known that there is far too little material in the form of stars (and related material) to hold galaxies and clusters together, and thus, that most of the matter in the Universe is dark (see e.g. Trimble, 1987). Weighing the dark matter has been the challenge. At present, I believe that clusters provide the most reliable means of estimating the total matter density.
Rich clusters are relatively rare objects – only about 1 in 10 galaxies is found in a rich cluster – which formed from density perturbations of (comoving) size around 10 Mpc. However, because they gather together material from such a large region of space, they can provide a “fair sample” of matter in the Universe. Using clusters as such, the precise BBN baryon density can be used to infer the total matter density (White et al, 1993). (Baryons and dark matter need not be well mixed for this method to work provided that the baryonic and total mass are determined over a large enough portion of the cluster.)
Most of the baryons in clusters reside in the hot, x-ray emitting intracluster gas and not in the galaxies themselves, and so the problem essentially reduces to determining the gas-to-total mass ratio. The gas mass can be determined by two methods: 1) measuring the x-ray flux from the intracluster gas and 2) mapping the Sunyaev - Zel’dovich CBR distortion caused by CBR photons scattering off hot electrons in the intracluster gas. The total cluster mass can be determined three independent ways: 1) using the motions of clusters galaxies and the virial theorem; 2) assuming that the gas is in hydrostatic equilibrium and using it to infer the underlying mass distribution; and 3) mapping the cluster mass directly by gravitational lensing (Tyson, 1999). Within their uncertainties, and where comparisons can be made, the three methods for determining the total mass agree (see e.g., Tyson, 1999); likewise, the two methods for determining the gas mass are consistent.
Mohr et al (1998) have compiled the gas to total mass ratios determined from x-ray measurements for a sample of 45 clusters; they find . Carlstrom (1999), using his S-Z gas measurements and x-ray measurements for the total mass for 27 clusters, finds . (The agreement of these two numbers means that clumping of the gas, which could lead to an overestimate of the gas fraction based upon the x-ray flux, is not a problem.) Invoking the “fair-sample assumption,” the mean matter density in the Universe can be inferred:
| (7) | |||||
I believe this to be the most reliable and precise determination of the matter density. It involves few assumptions, and most of them have now been tested (clumping, hydrostatic equilibrium, variation of gas fraction with cluster mass).
2.3.3 Supporting evidence for
This result is consistent with a variety of other methods that involve different physics. For example, based upon the evolution of the abundance of rich clusters with redshift, Henry (1998) finds (also see, Bahcall & Fan, 1998 and N. Bahcall, 1999). Dekel and Rees (1994) place a low limit (95% cl) derived from the outflow of material from voids (a void effectively acts as a negative mass proportional to the mean matter density).
The analysis of the peculiar velocities of galaxies provides an important probe of the mass density averaged over very large scales (of order several hundred Mpc). By comparing measured peculiar velocities with those predicted from the distribution of matter revealed by redshift surveys such as the IRAS survey of infrared galaxies, one can infer the quantity where is the linear bias factor that relates the inhomogeneity in the distribution of IRAS galaxies to that in the distribution of matter (in general, the bias factor is expected to be in the range 0.7 to 1.5; IRAS galaxies are expected to be less biased, .). Recent work by Willick & Strauss (1998) finds , while Sigad et al (1998) find . The apparent inconsistency of these two results and the ambiguity introduced by bias preclude a definitive determination of by this method. However, Dekel (1994) quotes a 95% confidence lower bound, , and the work of Willick & Strauss seems to strongly indicate that is much less than 1; both are consistent with .
Finally, there is strong, but circumstantial, evidence from structure formation that is around 0.4 and significantly greater than . It is based upon two different lines of reasoning. First, there is no viable model for structure formation without a significant amount of nonbaryonic dark matter. The reason is simple: in a baryons-only model, density perturbations grow only from the time of decoupling, , until the Universe becomes curvature dominated, ; this is not enough growth to produce all the structure seen today with the size of density perturbations inferred from CBR anisotropy. With nonbaryonic dark matter and , dark-matter perturbations begin growing at matter – radiation equality and continue to grow until the present epoch, or nearly so, leading to significantly more growth and making the observed large-scale structure consistent with the size of the density perturbations inferred from CBR anisotropy.
Second, the transition from radiation domination at early times to matter domination at around 10,000 yrs leaves its mark on the shape of the present power spectrum of density perturbations, and the redshift of matter – radiation equality depends upon . Measurements of the shape of the present power spectrum based upon redshift surveys indicate that the shape parameter (see e.g., Peacock & Dodds, 1994). For , this implies . (If there are relativistic particles beyond the CBR photons and relic neutrinos, the formula for the shape parameter changes and can be accommodated; see Dodelson et al, 1996).
2.4 Mass-to-light ratios and : amazingly, the glass is half full!
The most mature approach to estimating the matter density involves the use of mass-to-light ratios, the measured luminosity density, and the deceptively simple equation,
| (8) |
where is the measured (B-band) luminosity density of the Universe. Once the average mass-to-light ratio for the Universe is determined, follows by dividing it by the critical mass-to-light ratio, (in solar units). Though it is tantalizingly simple – and it is far too easy to take any measured mass-to-light ratio and divide it by – this method does not provide an easy and reliable method of determining .
Based upon the mass-to-light ratios of the bright, inner regions of galaxies, few, the fraction of critical density in stars (and closely related material) has been determined, (see e.g., Faber & Gallagher, 1979). Persic & Salucci (1992) derive a similar value based upon the observed stellar-mass function. Luminous matter accounts for only a tiny fraction of the total mass density and only about a tenth of the baryons.
CNOC (Carlberg et al, 1996, 1997) have done a very careful job of determining a mean cluster mass-to-light ratio, , which translates to an estimate of the mean matter density, . Because clusters contain thousands of galaxies and cluster galaxies do not seem radically different from field galaxies, one is tempted to take this estimate of the mean matter density seriously. However, it is significantly smaller than the value I advocated earlier, . Which estimate is right?
I believe the higher number, based upon the cluster baryon fraction, is more reliable and that we should be surprised that the CNOC number is so close, closer than we had any right to expect! After all, only a small fraction of galaxies are found in clusters and the luminosity density itself evolves strongly with redshift and corrections for this effect are large and uncertain. (We are on the tail end of star formation in the Universe: 80% of star formation took place at a redshift greater than unity; see Fig. 6.) While the value for derived from the cluster baryon fraction also relies upon clusters, the underlying assumption is far weaker and much more justified, namely that clusters provide a fair sample of matter in the Universe.
Even if mass-to-light ratios were measured in the red (they typically are not), where the light is dominated by low-mass stars and reflects the integrated history of star formation rather than the current star-formation rate as it does in the blue, one would still require the fraction of baryons converted into stars in clusters to be identical to that in the field to have agreement between the CNOC estimate and that based upon the cluster baryon fraction. Apparently, the fraction of baryons converted into stars in the field and in clusters is similar, but not identical.
To put this in perspective and to emphasize the shortcomings of the mass-to-light technique, had one used the cluster mass-to-x-ray ratio and the x-ray luminosity density, one would have inferred . A factor of two discrepancy based upon optical mass-to-light ratios does not seem so bad. Enough said.
2.5 Missing energy?
The results and are in apparent contradiction, suggesting that one or both are wrong. However, prompted by a strong belief in a flat Universe, theorists have explored the remaining logical possibility: a dark, exotic form of energy that is smoothly distributed and contributes 60% of the critical density (Turner et al, 1984; Peebles, 1984). Being smoothly distributed its presence would not have been detected in measurements of the matter density. The properties of this missing energy are severely constrained by other cosmological facts, including structure formation, the age of the Universe, and CBR anisotropy. So much so, that a smoking-gun signature for the missing energy was predicted (see e.g., Turner, 1991).
To begin, let me parameterize the bulk equation of state of this unknown component: . This implies that its energy density evolves as where . The development of the structure observed today from density perturbations of the size inferred from measurements of the anisotropy of the CBR requires that the Universe be matter dominated from the epoch of matter – radiation equality until very recently. Thus, to avoid interfering with structure formation, the dark-energy component must be less important in the past than it is today. This implies that must be less than or ; the more negative is, the faster this component gets out of the way (see Fig. 7). More careful consideration of the growth of structure implies that must be less than about (Turner & White, 1997).
Next, consider the constraint provided by the age of the Universe and the Hubble constant. Their product, , depends the equation of state of the Universe; in particular, increases with decreasing (see Fig. 8). To be definite, I will take Gyr and (see e.g., Chaboyer et al, 1998 and Freedman, 1999); this implies that . Fig. 8 shows that is preferred by age/Hubble constant considerations.
To summarize, consistency between and along with other cosmological considerations implies the existence of a dark-energy component with bulk pressure more negative than about . The simplest example of such is vacuum energy (Einstein’s cosmological constant), for which . The smoking-gun signature of a smooth, dark-energy component is accelerated expansion since for .
2.6 Missing energy found!
In 1998 evidence for accelerated expansion was presented in the form of the magnitude – redshift (Hubble) diagram for fifty-some type Ia supernovae (SNe Ia) out to redshifts of nearly 1. Two groups, the Supernova Cosmology Project (Perlmutter et al, 1998; Goobar, 1999) and the High-z Supernova Search Team (Riess et al, 1998; Schmidt et al, 1998), working independently and using different methods of analysis, each found evidence for accelerated expansion. Perlmutter et al (1998) summarize their results as a constraint to a cosmological constant (see Fig. 9),
| (9) |
For , this implies , or just what is needed to account for the missing energy!
(A simple explanation of the SN Ia results may be useful. If galactic distances and velocities were measured today they would obey a perfect Hubble law, , because the expansion of the Universe is simply a rescaling. Because we see distant galaxies at an earlier time, their velocities should be larger than predicted by the Hubble law, provided the expansion is slowing due to the attractive force of gravity. Using SNe Ia as standard candles to determine the distances to faraway galaxies, the two groups in effect found the opposite: distant galaxies are moving slower than predicted by the Hubble law, implying the expansion is speeding up!)
Recently, two other studies, one based upon the x-ray properties of rich clusters of galaxies (Mohr et al, 1999) and the other based upon the properties of double-lobe radio galaxies (Guerra et al, 1998), have reported evidence for a cosmological constant (or similar dark-energy component) that is consistent with the SN Ia results (i.e., ).
There is another powerful test of an accelerating Universe whose results are more ambiguous. It is based upon the fact that the frequency of multiply lensed QSOs is expected to be significantly higher in an accelerating universe (Turner, 1990). Kochanek (1996) has used gravitational lensing of QSOs to place a 95% cl upper limit, ; and Waga and Miceli (1998) have generalized it to a dark-energy component with negative pressure: (95% cl), both results for a flat Universe. On the other hand, Chiba and Yoshii (1998) claim evidence for a cosmological constant, , based upon the same data. From this I conclude: 1) lensing excludes larger than 0.8, and 2) when larger objective surveys of gravitational-lensed QSOs are carried out (e.g., the Sloan Digital Sky Survey), there is the possibility of uncovering another smoking-gun for accelerated expansion.
By far, the strongest evidence for dark energy is the SN Ia data. The statistical errors reported by the two groups are smaller than possible systematic errors. Thus, the believability of the results turn on the reliability of SNe Ia as one-parameter standard candles. SNe Ia are thought to be associated with the nuclear detonation of Chandrasekhar-mass white dwarfs. The one parameter is the rate of decline of the light curve: The brighter ones decline more slowly (the so-called Phillips relation; see Phillips, 1993). The lack of a good theoretical understanding of this (e.g., what is the physical parameter?) is offset by strong empirical evidence for the relationship between peak brightness and rate of decline, based upon a sample of nearby SNe Ia. It is reassuring that in all respects studied, the distant sample of SNe Ia appear to be similar to the nearby sample. For example, distribution of decline rates and dispersion about the Phillips relationship. The local sample spans a range of metallicity, likely spanning that of the distant sample, and further, suggesting that metallicity is not an important second parameter.
At this point, it is fair to say that if there is a problem with SNe Ia as standard candles, it must be subtle. Cosmologists are even more inclined to believe the SN Ia results because of the preexisting evidence for a “missing-energy component” that led to the prediction of accelerated expansion.
2.7 Cosmic concordance
With the SN Ia results we have for the first time a complete and self-consistent accounting of mass and energy in the Universe (see Fig. 1). The consistency of the matter/energy accounting is illustrated in Fig. 9. Let me explain this exciting figure. The SN Ia results are sensitive to the acceleration (or deceleration) of the expansion and constrain the combination . (Note, ; corresponds to the deceleration parameter at redshift , the median redshift of these samples). The (approximately) orthogonal combination, is constrained by CBR anisotropy. Together, they define a concordance region around , , and . The constraint to the matter density alone, , provides a cross check, and it is consistent with these numbers. Cosmic concordance!
But there is more. We also have a consistent and well motivated picture for the formation of structure in the Universe, CDM. The CDM model, which is the cold dark matter model with , and , is a very good fit to all cosmological constraints: large-scale structure, CBR anisotropy, age of the Universe, Hubble constant and the constraints to the matter density and cosmological constant; see Fig. 10 (Krauss & Turner, 1995; Ostriker & Steinhardt, 1995; Turner, 1997). Further, as can be seen in Figs. 2 and 3, CBR anisotropy measurements are beginning to show evidence for the acoustic peaks characteristic of the Gaussian, curvature perturbations predicted by inflation. Until 1998, CDM’s only major flaw was the absence of evidence for accelerated expansion. Not now.
3 Three Dark Matter Problems
While stars are very interesting and pretty to look at – and without them, astronomy wouldn’t be astronomy and we wouldn’t exist – they represent a tiny fraction of the cosmic mass budget, only about 0.5% of the critical density. As we have known for several decades, the bulk of the matter and energy in the Universe is dark. The present accounting defines three dark matter/energy problems; none is yet fully addressed.
3.1 Dark Baryons
By a ten to one margin, the bulk of the baryons are dark and not in the form of stars. With the exception of clusters, where the “dark” baryons exist as hot, x-ray emitting intracluster gas, the nature of the dark baryons is not known. Clusters only account for around 10% or so of the baryons in the Universe (Persic & Salucci, 1992) and the (optically) dark baryons elsewhere, which account for 90% or more of all the baryons, could take on a different form.
The two most promising possibilities for the dark baryons are diffuse hot gas and “dark stars” (white dwarfs, neutron stars, black holes or objects of mass around or below the hydrogen-burning limit). I favor the former possibility for a number of reasons. First, that’s where the dark baryons in clusters are. Second, the cluster baryon fraction argument can be turned around to infer at the time clusters formed, redshifts ,
| (10) |
That is, at the time clusters formed, the mean gas density was essentially equal to the baryon density (unless is very small), thereby accounting for the bulk of baryons in gaseous form. Third, numerical simulations suggest that most of the baryons should still be in gaseous form today (Rauch et al, 1997; Ostriker, 1999).
There are two arguments for dark stars as the baryonic dark matter. First, the gaseous baryons not associated with clusters have not been detected. Second, the results of the microlensing surveys toward the LMC and SMC (Spiro, 1999) are consistent with about one-third of our halo being in the form of half-solar mass white dwarfs.
I find neither argument compelling; gas outside clusters will be cooler ( K) and difficult to detect, either in absorption or emission. There are equally attractive explanations for the Magellanic Cloud microlensing events (e.g., self lensing by the Magellanic Clouds, lensing by stars in the spheroid, or lensing due to disk material that, due to flaring and warping of the disk, falls along the line of sight to the LMC; see Sahu, 1994; Evans et al, 1998; Gates et al, 1998; Zaritsky & Lin, 1997; Zhao, 1998). The white-dwarf interpretation for the halo has a host of troubles: Why haven’t the white dwarfs been seen (Graff et al, 1998)? The star formation rate required to produce these white dwarfs – close to – far exceeds that measured at any time in the past or present (see Madau, 1999). Where are the lower-main-sequence stars associated with this stellar population and the gas, expected to be 6 to 10 times that of the white dwarfs, that didn’t form into stars (Fields et al, 1997)? Finally, there is evidence that the lenses for both SMC events are stars within the SMC (Alcock et al, 1998; EROS Collaboration, 1998a,b) and at least one of the LMC events is explained by an LMC lens.
The SMC/LMC microlensing puzzle can be stated another way. The lenses have all the characteristics of ordinary, low-mass stars (e.g., mass and binary frequency). If this is so, they cannot be in the halo (they would have been seen); the puzzle is to figure out where they are located.
3.2 Cold Dark Matter
The second dark-matter problem follows from the inequality : There is much more matter than there are baryons, and thus, nonbaryonic dark matter is the dominant form of matter. The evidence for this very profound conclusion has been mounting for almost two decades, and this past year, the Burles – Tytler deuterium measurement anchored the baryon density and allowed the cleanest determination of the matter density, through the cluster baryon fraction.
Particle physics provides an attractive solution to the nonbaryonic dark matter problem: relic elementary particles left over from the big bang (see Ellis, 1999). Long-lived or stable particles with very weak interactions can remain from the earliest moments of particle democracy in sufficient numbers to account for a significant fraction of critical density (very weak interactions are needed so that their annihilations cease before their numbers are too small). The three most promising candidates are a neutrino of mass 30 eV or so (or eV), an axion of mass eV, and a neutralino of mass between GeV and GeV. All three are motivated by particle-physics theories that attempt to unify the forces and particles of Nature. The fact that such particles can also account for the nonbaryonic dark matter is either a big coincidence or a big hint. Further, the fact that these particles interact with each other and ordinary matter very weakly, provides a simple and natural explanation for dark matter being more diffusely distributed.
At the moment, there is significant circumstantial evidence against neutrinos as the bulk of the dark matter. Because they behave as hot dark matter, structure forms from the top down, with superclusters fragmenting into clusters and galaxies (White, Frenk & Davis, 1983), in stark contrast to the observational evidence that indicates structure formed from the bottom up. (Hot + cold dark matter is still an outside possibility, with or less; see Dodelson et al, 1996 and Gawiser & Silk, 1998.) Second, the evidence for neutrino mass based upon the atmospheric (Totsuka, 1999) and solar-neutrino (Kirsten, 1999 and J. Bahcall, 1999) data suggests a neutrino mass pattern with the tau neutrino at eV, the muon neutrino at eV to eV and the electron neutrino with an even smaller mass. In particular, the factor-of-two deficit of atmospheric muons neutrinos with its dependence upon zenith angle is very strong evidence for a neutrino mass difference squared between two of the neutrinos of around eV2 (Fukuda et al, 1998). This sets a lower bound to neutrino mass of about eV, implying neutrinos contribute at least as much mass as bright stars. WOW!
Both the axion and neutralino behave as cold dark matter; the success of the cold dark matter model of structure formation makes them the leading particle dark-matter candidates. Because they behave as cold dark matter, they are expected to be the dark matter in our own halo; in fact, there is nothing that can keep them out (Gates & Turner, 1994). As discussed above, 2/3 of the dark matter in our halo – and probably all the halo dark matter – cannot be explained by baryons in any form. The local density of halo material is estimated to be , with an uncertainty of slightly less than a factor of 2 (Gates et al, 1995). This makes the halo of our galaxy an ideal place to look for cold dark matter particles! An experiment at Livermore National Laboratory with sufficient sensitivity to detect halo axions is currently taking data (van Bibber et al, 1998; Rosenberg and van Bibber, 1999) and experiments at several laboratories around the world are beginning to search for halo neutralinos with sufficient sensitivity to detect them (Sadoulet, 1999). The particle dark-matter hypothesis is compelling, but very bold, and most importantly, it is now being tested.
Finally, while the axion and the neutralino are the most promising particle dark-matter candidates, neither one is a “sure thing.” Moreover, any sufficiently heavy particle relic (mass greater than a GeV or so) will behave as cold dark matter. A host of more exotic possibilities have been suggested, from solar-mass primordial black holes produced at the quark/hadron transition (see e.g., Jedamzik, 1998 and Jedamzik & Niemeyer, 1998) that masquerade as MACHOs in our halo to supermassive (mass greater than GeV) particles produced by nonthermal processes at the end of inflation (see e.g., Kolb, 1999). Lest we become overconfident, we should remember that Nature has many options for the particle dark matter.
3.3 Dark Energy
I have often used the term exotic to refer to particle dark matter. That term will now have to be reserved for the dark energy that is causing the accelerated expansion of the Universe – by any standard, it is more exotic and more poorly understood. Here is what we do know: it contributes about 60% of the critical density; it has pressure more negative than about ; and it does not clump (otherwise it would have contributed to estimates of the mass density). The simplest possibility is the energy associated with the virtual particles that populate the quantum vacuum; in this case and the dark energy is absolutely spatially and temporally uniform.
This “simple” interpretation has its difficulties. Einstein “invented” the cosmological constant to make a static model of the Universe and then he discarded it; we now know that the concept is not optional. The cosmological constant corresponds to the energy associated with the vacuum. However, there is no sensible calculation of that energy (see e.g., Zel’dovich, 1967; Bludman and Ruderman, 1977; and Weinberg, 1989), with estimates ranging from to times the critical density. Some particle physicists believe that when the problem is understood, the answer will be zero. Spurred in part by the possibility that cosmologists may have actually weighed the vacuum (!), particle theorists are taking a fresh look at the problem (see e.g., Harvey, 1998; Sundrum, 1997). Sundrum’s proposal, that the energy of the vacuum is close to the present critical density because the graviton is a composite particle with size of order 1 cm, is indicative of the profound consequences that a cosmological constant has for fundamental physics.
Because of the theoretical problems mentioned above, as well as the checkered history of the cosmological constant, theorists have explored other possibilities for a smooth, component to the dark energy (see e.g., Turner & White, 1997). Wilczek and I pointed out that even if the energy of the true vacuum is zero, as the Universe as cooled and went through a series of phase transitions, it could have become hung up in a metastable vacuum with nonzero vacuum energy (Turner & Wilczek, 1982). In the context of string theory, where there are a very large number of energy-equivalent vacua, this becomes a more interesting possibility: perhaps the degeneracy of vacuum states is broken by very small effects, so small that we were not steered into the lowest energy vacuum during the earliest moments.
Vilenkin (1984) has suggested a tangled network of very light cosmic strings (also see, Spergel & Pen, 1997) produced at the electroweak phase transition; networks of other frustrated defects (e.g., walls) are also possible. In general, the bulk equation-of-state of frustrated defects is characterized by where is the dimension of the defect ( for strings, for walls, etc.). The SN Ia data almost exclude strings, but still allow walls.
An alternative that has received a lot of attention is the idea of a “decaying cosmological constant”, a termed coined by the Soviet cosmologist Matvei Petrovich Bronstein in 1933 (Bronstein, 1933). (Bronstein was executed on Stalin’s orders in 1938, presumably for reasons not directly related to the cosmological constant; see Kragh, 1996.) The term is, of course, an oxymoron; what people have in mind is making vacuum energy dynamical. The simplest realization is a dynamical, evolving scalar field. If it is spatially homogeneous, then its energy density and pressure are given by
| (11) |
and its equation of motion by (see e.g., Turner, 1983)
| (12) |
The basic idea is that energy of the true vacuum is zero, but not all fields have evolved to their state of minimum energy. This is qualitatively different from that of a metastable vacuum, which is a local minimum of the potential and is classically stable. Here, the field is classically unstable and is rolling toward its lowest energy state.
Two features of the “rolling-scalar-field scenario” are worth noting. First, the effective equation of state, , can take on any value from 1 to . Second, can vary with time. These are key features that may allow it to be distinguished from the other possibilities. In fact, there is some hope that more SNe Ia will be able to do this and perhaps even permit the reconstruction of the scalar-field potential (Huterer & Turner, 1998).
The rolling scalar field scenario (aka mini-inflation or quintessence) has received a lot of attention over the past decade (Freese et al, 1987; Ozer & Taha, 1987; Ratra & Peebles, 1988; Frieman et al, 1995; Coble et al, 1996; Turner & White, 1997; Caldwell et al, 1998; Steinhardt, 1999). It is an interesting idea, but not without its own difficulties. First, one must assume that the energy of the true vacuum state ( at the minimum of its potential) is zero; i.e., it does not address the cosmological constant problem. Second, as Carroll (1998) has emphasized, the scalar field is very light and can mediate long-range forces. This places severe constraints on it. Finally, with the possible exception of one model (Frieman et al, 1995), none of the scalar-field models address how fits into the grander scheme of things and why it is so light (eV).
4 Concluding Remarks
1998 was a very good year for cosmology. We now have a plausible and complete accounting of matter and energy in the Universe; in CDM, a model for structure formation that is consistent with all the data at hand; and the first evidence for the key tenets of inflation (flat Universe and adiabatic density perturbations). One normally conservative cosmologist has gone out on a limb by stating that 1998 may be a turning point in cosmology as important as 1964, when the CBR was discovered (Turner, 1999).
We still have important questions to address: Where are the dark baryons? What is the dark matter? What is the nature of the dark energy? What is the explanation for the complicated pattern of mass and energy: neutrinos (0.3%), baryons (5%), cold dark matter particles (35%) and dark energy (60%)? Especially puzzling is the ratio of dark energy to dark matter: because they evolve differently with time, the ratio of dark matter to dark energy was higher in the past and will be smaller in the future; only today are they comparable. WHY NOW?
While we have many urgent questions, we can see a flood of precision cosmological and laboratory data coming that will help to answer these questions: High-resolution maps of CBR anisotropy (MAP and Planck); large redshift surveys (SDSS and 2dF); more SN Ia data; experiments to directly detect halo axions and neutralinos; more microlensing data (MACHO, EROSII, OGLE, AGAPE, and superMACHO); accelerator experiments at Fermilab and CERN, searching for the neutralino and its supersymmetric friends and further evidence for neutrino mass, and at the KEK and SLAC B-factories, revealing more about the nature of violation; and nonaccelerator experiments that will shed further light on neutrino mass, particle dark matter, new forces, and the nature of gravity.
These are exciting times in cosmology!
Acknowledgments.
This work was supported by the DoE (at Chicago and Fermilab) and by the NASA (at Fermilab by grant NAG 5-7092). I wish to thank the organizers, L. Bergstrom, P. Carlson, and C. Fransson, both for their graciousness as hosts and for putting on such a fine meeting.
References
- [1] Alcock, C. et al 1998, Astrophys. J., submitted.
- [2] Bahcall, J. 1999, this volume.
- [3] Bahcall, N. 1999, this volume.
- [4] Bahcall, N. & Fan, X. 1998, Astrophys. J., 504, 1.
- [5] van Bibber, K. et al 1998, Phys. Rev. Lett., 80, 2043.
- [6] Bronstein, M.P. 1933, Phys. Zeit. der Sowjetunion, 3, 73.
- [7] Bludman, S. & Ruderman, M. 1977, Phys. Rev. Lett., 38, 255.
- [8] Burles, S. & Tytler, D. 1998a, Astrophys. J., 499, 699.
- [9] Burles, S. & Tytler, D. 1998b, Astrophys. J., 507, 732.
- [10] Burles, S., Nollett, K., Truan, J. & Turner, M.S. 1999, Phys. Rev. Lett., in press.
- [11] Caldwell, R., Dave, R., & Steinhardt, P.J. 1998, Phys. Rev. Lett., 80, 1582.
- [12] Carlberg, R. et al 1996, Astrophys. J., 436, 32.
- [13] Carlberg, R. et al 1997, Astrophys. J., 478, 462.
- [14] Carlstrom, J. 1999, Physica Scripta, in press.
- [15] Carroll, S. 1998, Phys. Rev. Lett., 81, 3067.
- [16] Chaboyer, B. et al 1998, Astrophys. J., 494, 96.
- [17] Chiba, M. & Yoshii, Y. 1998, Astrophys. J., in press (astro-ph/9808321).
- [18] Coble, K., Dodelson, S. & Frieman, J. A. 1996, Phys. Rev. D, 55, 1851.
- [19] Copi, C.J., Schramm, D.N. & Turner, M.S. 1995, Science, 267, 192.
- [20] Dekel, A. 1994, Ann. Rev. Astron. Astrophys., 32, 371.
- [21] Dekel, A. & Rees, M. 1994, Astrophys. J. Lett., 422, L1.
- [22] Dodelson, S., Gates, E.I. & Turner, M.S. 1996, Science, 274, 69.
- [23] Dodelson, S. & Turner, M.S. 1992, Phys. Rev. D, 42, 3372.
- [24] Ellis, J.E. 1999, this volume.
- [25] EROS Collaboration 1998a, Astron. Astrophys., 332, 1.
- [26] EROS Collaboration 1998b, Astron. Astrophys., 337, L17.
- [27] Evans, W., Gyuk, G., Turner, M.S. & Binney, J. 1998, Astrophys. J. Lett., 501, L45.
- [28] Faber, S. & Gallagher, J. 1979, Ann. Rev. Astron. Astrophys., 17, 135.
- [29] Fields, B., Mathews, G.J. & Schramm, D.N. 1997, Astrophys. J., 483, 625.
- [30] Freedman, W. 1999, this volume.
- [31] Freese, K. et al 1987, Nucl. Phys. B, 287, 797.
- [32] Frieman, J., Hill, C., Stebbins, A. & Waga, I. 1995, Phys. Rev. Lett., 75, 2077.
- [33] Fukuda, Y. et al (SuperKamiokande Collaboration) 1998, Phys. Rev. Lett., 81, 1562.
- [34] Gates, E.I. & Turner, M.S. 1994, Phys. Rev. Lett., 72, 2520.
- [35] Gates, E.I., Gyuk, G. & Turner, M.S. 1995, Astrophys. J. Lett., 449, 123.
- [36] Gates, E.I., Gyuk, G., Holder, G. & Turner, M.S. 1998, Astrophys. J. Lett., 500, 145.
- [37] Gawiser, E. & Silk, J. 1998, Science, 280, 1405.
- [38] Goobar, A. 1999, this volume.
- [39] Graff, D.S., Laughlin, G. & Freese, K. 1998, Astrophys. J., 499, 7.
- [40] Guerra, E.J., Daly, R.A. & Wan, L. 1998, Astrophys. J., submitted (astro-ph/9807249)
- [41] Harvey, J. 1998, hep-th/9807213.
- [42] Hata, N. et al 1995, Phys. Rev. Lett., 75, 3977.
- [43] Henry, P. 1998, in preparation.
- [44] Huterer, D. & Turner, M.S. 1998, Phys. Rev. Lett., submitted (astro-ph/9808133).
- [45] Jedamzik, K. 1998, astro-ph/9805147.
- [46] Jedamzik, K. & Niemeyer, J. 1998, Phys. Rev. Lett., 80, 5481.
- [47] Kamionkowski, M., Spergel, D.N. & Sugiyama, N. 1994, Astrophys. J. Lett., 426, L57.
- [48] Kirsten, T. 1999, this volume.
- [49] Kochanek, C. 1996, Astrophys. J., 466, 638.
- [50] Kolb, E.W. 1999, this volume.
- [51] Kragh, H. 1996, Cosmology and Controversy (Princeton Univ. Press, Princeton, NJ).
- [52] Krauss, L. & Turner, M.S., 1995, Gen. Rel. Grav., 27, 1137.
- [53] Lineweaver, C. 1998, Astrophys. J. Lett., 505, 69.
- [54] Madau, P. 1999, this volume.
- [55] Meiksin, A. & Madau, P. 1993, Astrophys. J., 412, 34.
- [56] Mohr, J., Mathiesen, B. & Evrard, A.E. 1998, Astrophys. J., submitted.
- [57] Mohr, J. et al 1999,
- [58] Ostriker, J.P. 1999, this volume.
- [59] Ostriker, J.P. & Steinhardt, P.J. 1995, Nature
- [60] Ozer, M. & Taha, M.O. 1987, Nucl. Phys. B, 287, 776.
- [61] Peacock, J. & Dodds, S. 1994, Mon. Not. R. astron. Soc., 267, 1020.
- [62] Peebles, P.J.E. 1984, Astrophys. J., 284, 439.
- [63] Perlmutter, S. et al 1998, Astrophys. J., in press (astro-ph/9812133).
- [64] Persic, M. & Salucci, P. 1992, Mon. Not. R. astron. Soc., 258, 14p.
- [65] Phillips, M. M. 1993, Astrophys. J. Lett., 413, L105.
- [66] Ratra, B. & Peebles, P.J.E. 1988, Phys. Rev. D, 37, 3406.
- [67] Rauch, M. et al 1997, Astrophys. J., 489, 7.
- [68] Riess, A. et al 1998, Astron. J., 116, 1009.
- [69] Rosenberg, L. & van Bibber, K. 1999, Phys. Rep., in press.
- [70] Sadoulet, B. 1999, this volume
- [71] Sahu, K.C. 1994, Nature, 370, 265.
- [72] Schmidt, B. et al 1998, Astrophys. J., 507, 46.
- [73] Steinhardt, P.J. 1999, this volume.
- [74] Sundrum, R. 1997, hep-th/9708329.
- [75] Sigad, et al 1998, Astrophys. J., 495, 516.
- [76] Spergel, D. N. & Pen, U.-L. 1997, Astrophys. J. Lett., 491, L67.
- [77] Spergel, D. N. 1999, this volume.
- [78] Spiro, M. 1999, this volume.
- [79] Totsuka, Y. 1999, this volume.
- [80] Trimble, V. 1987, Ann. Rev. Astron. Astrophys., 25, 425.
- [81] Turner, E.L. 1990, Astrophys. J. Lett., 365, L43.
- [82] Turner, M.S. 1983, Phys. Rev. D, 28, 1243.
- [83] Turner, M.S. 1991, Physica Scripta, T36, 167.
- [84] Turner, M.S. 1997, in Critical Dialogues in Cosmology, ed. N. Turok (World Scientific, Singapore), p. 555.
- [85] Turner, M.S. 1998, Pub. Astron. Soc. Pac., in press.
- [86] Turner, M.S., Steigman, G. & Krauss, L. 1984, Phys. Rev. Lett., 52, 2090.
- [87] Turner, M.S. & White, M. 1997, Phys. Rev. D, 56, R4439.
- [88] Turner, M.S. & Wilczek, F. 1982, Nature, 298, 633.
- [89] Tyson, J. A. 1999, this volume.
- [90] Tytler, D. 1999, this volume.
- [91] Weinberg, D. et al 1997, Astrophys. J., 490, 546.
- [92] Weinberg, S. 1989, Rev. Mod. Phys., 61, 1.
- [93] Vilenkin, A. 1984, Phys. Rev. Lett., 53, 1016.
- [94] Waga, I. & Miceli, A.P.M.R. 1998, astro-ph/9811460.
- [95] White, S.D.M., Frenk, C. & Davis, M. 1983, Astrophys. J. Lett., 274, L1.
- [96] White, S.D.M. et al, 1993, Nature 366, 429.
- [97] Wilkinson, D. T. 1999, this volume.
- [98] Willick, J. & Strauss, M. 1998, Astrophys. J., 507, 64.
- [99] Zaritsky, D. & Lin, D.N.C. 1997, Astron. J., 114, 254.
- [100] Zel’dovich, Ya.B. 1967, JETP, 6, 316.
- [101] Zhao, H.-S. 1998, Mon. Not. R. astron. Soc., 294, 139.