Variable-Frequency QPOs from the Galactic Microquasar GRS 1915+105
Abstract
We show that the galactic microquasar GRS 1915105 exhibits quasi-periodic oscillations (QPOs) whose frequency varies continuously from 1–15 Hz, during spectrally hard dips when the source is in a flaring state. We report here analyses of simultaneous energy spectra and power density spectra at 4 s intervals. The energy spectrum is well fit at each time step by an optically thick accretion disk plus power law model, while the power density spectrum consists of a varying red noise component plus the variable frequency QPO. The features of both spectra are strongly correlated with one another. The 1–15 Hz QPOs appear when the power law component becomes hard and intense, and themselves have an energy spectrum consistent with the power law component (with root mean square amplitudes as high as 10%). The frequency of the oscillations, however, is most strikingly correlated with the parameters of the thermal disk component. The tightest correlation is between QPO frequency and the disk X-ray flux. This fact indicates that the properties of the QPO are not determined by solely a disk or solely a corona.
1 Introduction
The galactic source GRS 1915105 was first discovered in 1992 as an X-ray transient by GRANAT/Watch (Castro-Tirado, Brandt & Lund 1992), and subsequent radio observations showed that it is a source of superluminal jet-like outflows (Mirabel & Rodriguez 1994). GRS 1915105 can be quite luminous in X-rays ( erg s-1), above the Eddington limit for neutron stars (Greiner, Morgan & Remillard 1996). It also exhibits a rich set of variability in X-rays (Morgan, Remillard & Greiner 1997, hereafter MGR97). Much interest has focussed on a weak 67 Hz quasi-periodic oscillation (QPO) feature that is sometimes present. These oscillations have been interpreted as the signature of oscillating material at or near the radius of marginally stable orbits (MGR97, Nowak et al 1997) and perhaps Lense-Thirring precession due to a maximally rotating black hole (Cui, Zhang, Chen 1998). On the occasions when it is detected, the frequency of the 67 Hz QPO does not appear to vary with total source intensity (MGR97). GRS 1915105 exhibits lower frequency oscillatory behavior as well, including a 1–15 Hz variable frequency QPO, a lower frequency complex of QPO modes (below 0.1 Hz), and a stochastic low frequency noise component. In this Letter we investigate the properties of the 1–15 Hz QPO, further concentrating on how the QPO frequency depends on the spectral parameters of the source.
Chen, Swank & Taam (1997, hereafter CST97) have noted that the frequency of the 1–15 Hz QPO generally depends on the total source intensity, but the dependence between the two is neither simple nor unique (see also Chen, Taam & Swank 1998). The X-ray flux of GRS 1915105 can vary by a factor of five or more, and the count rate from GRS 1915105 is high enough that temporally resolved spectroscopy is possible over intervals of several seconds. We exploit that fact here for an observation where both the intensity and QPO frequency cover a wide range. We find that the spectrum is well represented by a combination of optically thick thermal and power law components. The lower-frequency QPOs clearly appear only when GRS 1915105 is in a spectrally hard state. Remarkably, however, the frequency of the QPO is very strongly dependent on the fitted thermal flux.
In this paper we present evidence of the strong correlations between the spectral and temporal properties. Section 2 describes the observational techniques and results. Section 3 shows the correlation first between the energy and Fourier spectra, and second, between the QPO frequency and the fitted fluxes of the individual spectral components. In Section 4 we discuss the results in light of current accretion disk models.
2 Observations and Analysis
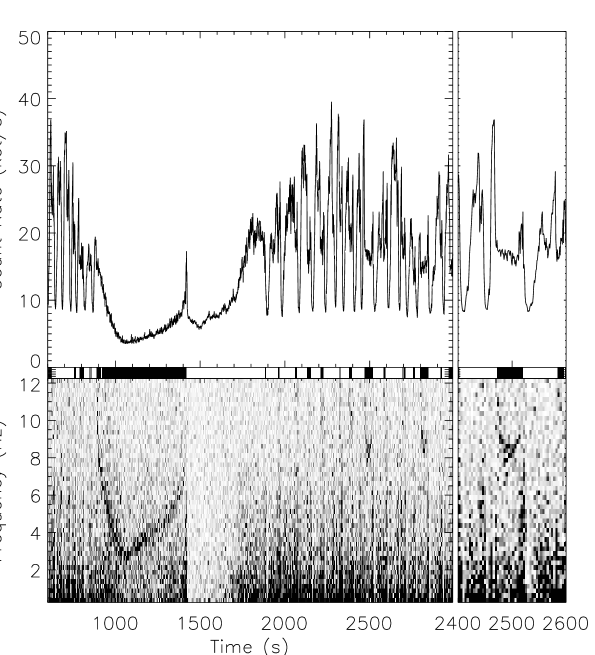
GRS 1915105 has been the target of nearly 250 observations by RXTE during its mission between early 1996 to the present. In this Letter we present RXTE spectral and timing results from observations of GRS 1915105 on 1997 September 09. Our analysis of observations from other days indicate that this day is representative of a substantial fraction of the source behavior, and that the source is variable enough to span a large range in source intensity and QPO frequency. A portion of the light curve from the Proportional Counter Array (PCA) is shown in the top panel of Figure 1. On this particular day, the source exhibits oscillatory “flaring” on time scales of 100 s, followed by extreme dips which last several hundreds of seconds. It is these extreme dips which appear to be associated with the disappearance of the inner accretion disk (Belloni et al 1997) and simultaneous outbursts observed in the infrared and radio (Mirabel et al 1998). We find three distinct states which GRS 1915105 traverses repeatedly.
To resolve the rapid variations it is advantageous to measure spectral changes on the shortest feasible time interval. PCA data is collected by the EDS in several concurrently running acquisition modes; each mode can have differing temporal resolution and spectral coverage. During this observation the “binned” and “event” modes collected X-ray events below and above 13 keV respectively, which were then merged, accumulated at 4 s intervals, and binned to 25 channels, approximately logarithmic in energy. After background subtraction, the 4 s spectra were statistically significant and also captured most of the dramatic variability in the source. Response matrices were generated by PCARMF v3.5 and corrected for secular gain drift.
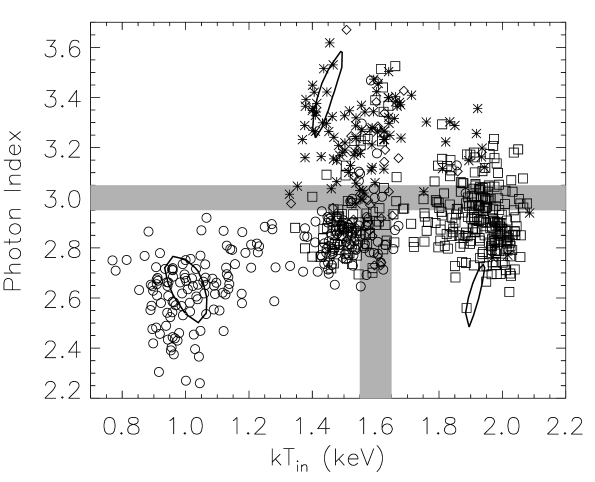
Spectra from 3.18–30 keV were fitted individually with an absorbed two-component emission model consisting of a multicolor “disk” black body (Mitsuda et al 1984), representing emission from an optically thick accretion disk (in steady state), and a power law, which may be associated with Compton scattering of soft photons by energetic electrons. A systematic error of 1%, comparable to the statistical error, was added in quadrature to account for uncertainties in the detector response calibration. The fitted disk model parameters are the temperature and radius at the inner edge of the accretion disk. We chose this model because it is likely to bear some physical resemblance to the GRS 1915105 system, and because the fits are acceptable. In a first pass through the data, neutral absorption was allowed to vary at each time step; it was noted that the absorption remained essentially constant at cm-2, and in a second pass, it was fixed at that value. The ensemble of reduced values had a mean of 1.48 and standard deviation of 0.43 for 21 degrees of freedom. The 1–30 keV unabsorbed source luminosity varied from erg s-1 over the observation, assuming a distance of 12.5 kpc. Figure 2 is a scatter plot of the inner disk temperature and photon index parameters, and shows that there is a large degree of “clustering” in a few states. While the absolute value of the parameters may change with improved calibration, the relative distribution of values should remain approximately the same. A preliminary discussion of the results, showing also the parameters as a function of time, can be found in Swank et al. (1998).
Power density spectra (PDS) from 0.25 to 1024 Hz were also constructed at 4 s intervals by performing an FFT on the combined data, a portion of which is shown in the lower panel of Figure 1. There is no evidence that the 67 Hz QPO is manifested in this observation; the 3- upper limit for the QPO is 0.6%. A distinct variable-frequency QPO does however appear from 2–12 Hz, for example during the extreme dip between 1100–1600 s in Figure 1. In the other observations, the combined frequency range is approximately 1–15 Hz. The fractional RMS amplitudes are as high as 10 percent, increasing with energy. Clearly the frequency of the QPO depends in some form on the source intensity. We show below that the primary dependence is on the disk flux and not the power law flux, except at the lowest frequencies where the disk flux is very weak.
There are several other features of note in the dynamical power spectrum: (1) when the source is at its brightest, a strong low-frequency ( Hz) noise component is observed; and (2) following the “spike” at time 1600 s the power spectrum becomes extremely quiet in terms of variability. These features persist in subsequent cycles of the source on the same day (which are not shown), and show a regular correlation between the source’s spectral and temporal variability behavior.
3 Spectral and Temporal Correlation
Having a record of the properties of both the PDS and energy spectrum, it is straightforward to compare the two for correlations. The power spectra of GRS 1915105 were manually divided into at least three separate categories, as noted in Figure 2: a 1–15 Hz QPO state, a low frequency noise state, and a quiet state. These temporal states are sufficiently distinct that they can be visually separated and are plotted with different symbols in Figure 2.
It is remarkable that each temporal state occupies a fairly well-localized domain of the energy spectrum. The approximate demarcations between separate states are shown in Table 1. The QPO appears when the inner disk temperature is relatively low and the power law component is hard. In addition to the extreme dip already mentioned, the QPO also appears briefly as “U”-shaped features at 8 Hz in the PDS when the spectral conditions are satisfied, near times 2500 s and 2800 s, as the magnified region in Figure 1 demonstrates. Although the values in Table 1 correspond only to 1997 September 09, in the course of scanning many observations we find that the spectral/temporal behavior is similar. All three states are not always present, but the separatrix between the states in vs. photon index space only varies by perhaps as much as 10%. The overall spectral/temporal correlation is thus quite robust.
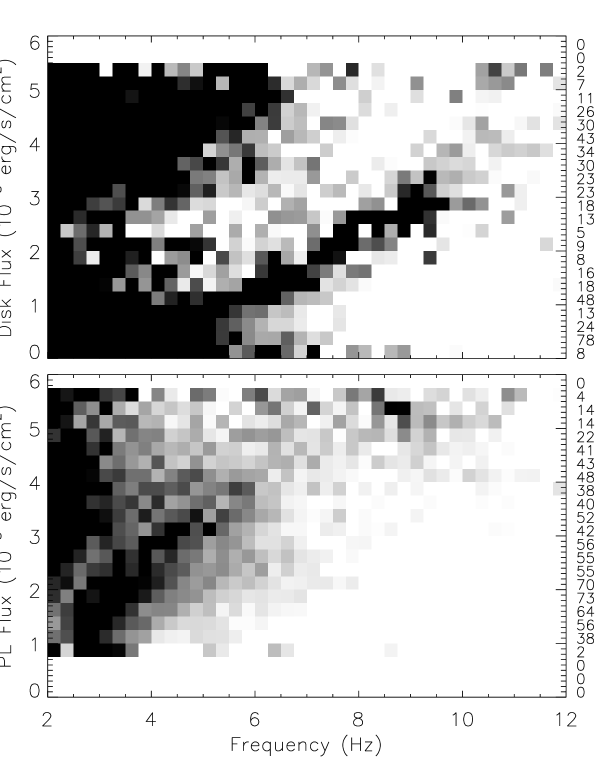
The approximate correlation between total intensity and QPO frequency on time scales of days has been noted previously (CST97, MGR97). Clearly this general trend holds on the shorter time scales presented in this Letter, and we wished to determine whether the dependence was tied distinctly to either the thermal or power law components. This was accomplished by constructing an average power spectrum for each fitted flux level, shown in Figure 3. The figure was constructed by first selecting spectra with a relatively low temperature and hard power law, using the spectral cuts in Table 1. By using a spectral cut, we have tried to avoid the bias introduced by choosing individual spectra by hand. The selected spectra are identified with a black mark in the central band of Figure 1. The spectra were then sorted into component 1–30 keV flux levels and averaged. The result is a power “image” representing the average spectral density parameterized by both frequency and X-ray flux.
The correlation between thermal flux and QPO frequency is very tight between 4 and 10 Hz, while the correlation with power law intensity is very weak (except perhaps from 2–4 Hz where the contribution attributed to the disk is much less than the power law flux, and is difficult to determine precisely with the PCA). From a qualitative standpoint, we could find no other relevant quantity or spectral parameter, including the total X-ray flux and derived quantities such as the inner disk radius, that made a tighter correlation than the thermal flux. This seems surprising given that the QPOs appear during the extreme dips when the power law flux is strong. On the other hand, the oscillations also appear when the thermal flux is quite high, for example during the brief episode near 2500 s. The averaging technique we have used is sensitive to weaker oscillations that do not show in a single power spectrum, but are apparent in a flux-selected average spectrum.
Above 4 Hz the correlation of the frequency with the thermal flux is quite linear: the frequency grows at Hz for each increase of erg s-1 cm-2 in thermal flux. Below 3–4 Hz the correlation appears to be lost. In that frequency range, a rather broad correlation with power law flux is suggested by Figure 3. Upon examination of individual QPO tracks via peak fitting during the extreme dips, the frequency between 2–4 Hz does appear to vary strongly with the power law flux, but tracks from different times do not overlap. The broad correlation reflects the variance between QPO tracks.
We emphasize that in examining several observations we find that the curves of frequency vs. thermal flux correlation overlay one another quite closely. The slope and intercept of the linear correlation changes slightly from observation to observation by perhaps 10 percent. The tight dependence of QPO frequency on the thermal flux (and not the power law flux) thus seems relatively certain. Muno et al. (1998) undertake to fit the QPO peaks individually, and find general agreement with our results.
4 Discussion
Quasiperiodic oscillations whose frequency depends on flux are seen from neutron star sources. The frequencies of both horizontal branch oscillations (HBO) of accreting “Z” sources, and the more recently discovered kilohertz oscillations, seen in both “Z” and “Atoll” low-mass X-ray binaries, depend on intensity. Both the magnetospheric beat frequency model (Alpar & Shaham 1985) and the sonic point model (Miller, Lamb & Psaltis 1998) are driven by an interaction between the central rotating compact object and the inner edge of the accretion disk, and can produce frequency variations. By analogy, the variable low frequency oscillations in black hole candidates (CST97; Takizawa et al 1997) could also be associated with the inner disk edge. Indeed, Chen, Taam & Swank (1998) remark upon the similarity in frequencies, when scaled by the central mass, and suggest a common origin. The beat models, however, rely on radiation or magnetic fields from the central source, which cannot play a role in black hole systems. If the oscillations are at the orbital Kepler frequency of the disk, they would come from material at a much larger radius than that of the inner disk: a Kepler radius of 500(3000) km with 15(1) Hz oscillations for a black hole, compared with a much smaller X-ray spectral radius of 60(300) km (corrected by a factor of 3 for scattering effects [Zhang, Cui & Chen 1997], but not relativistic effects, which are expected to be ). Furthermore, other observations have similar QPO frequencies and disk fluxes, but substantially different fitted inner radii; this argues against the interpretation that the oscillations depend solely on the inner edge of the disk.
The simultaneous presence of a strong, hard power law component during the 1–15 Hz QPO suggests that the “corona,” in whatever form it may take, plays a vital role in the formation of the oscillations. The maximum fractional RMS amplitude of the oscillations increases from 6% to 13% in the 2–7 and 15–31 keV bands, respectively, and yet the thermal disk component cuts off at keV. Nevertheless, the disk flux is also clearly important, as it appears to regulate the frequency of the oscillations. Some properties of the corona may however be strongly tied to the disk properties.
For a hot coronal inner region, the diffusion time scale could be close to the periods observed. The frequency corresponding to the diffusion time scale works out to be , where is the radius. The ratio of minimum to maximum frequencies (1:15) corresponds very roughly to the ratio of the radii determined by the spectra. But since the data for even a single observation does not show a systematic correlation between disk radius and the frequency, other changes would be needed to modify the radius dependence.
Recent theories of accretion disks find a number of instabilities which can produce global intensity oscillations in black hole systems. Simulations of the thermal-viscous instability have led to strong oscillations from 20–60 mHz, even when the dissipative effects of a corona are included (Chen & Taam 1994; Abramowicz, Chen & Taam 1995). Taam, Chen & Swank (1997) have invoked this model to explain 100 s outbursts from GRS 1915105. However, this is a much longer period than we observe here, and further, predicts a negative rather than positive correlation between QPO frequency and mass accretion rate (and hence flux). Inertial-acoustic modes, sound waves modified by rotation, can also be excited in the inner disk (e.g., Chen & Taam 1995). Simulations have produced oscillations with a few percent amplitudes at the maximum epicyclic frequency, or Hz (Chen & Taam 1995), but also a 4 Hz modulation corresponding to the sound-crossing time of the inner unstable portion of the accretion disk. While it is conceivable that we are observing this lower frequency modulation, a mechanism such as scattering must be invoked to explain the absence of simultaneous higher frequency oscillations.
The oscillation might also be due to oscillations of a shock at the inner edge of the accretion disk (Molteni, Sponholz & Chakrabarti 1996). The predicted oscillation frequency, Hz, is comparable to what we observe. The simulated amplitude is several percent, and the frequency increases with the mass accretion rate. However, the actual presence of a shock at the inner edge of the accretion disk is not likely for accretion flows characterized by high specific angular momentum (Narayan, Kato & Honma 1997; Chen, Abramowicz & Lasota 1997; Chen et al 1997).
In summary, we find that the 1–15 Hz QPOs occur when the hard power law spectral component becomes strong, especially during extreme dips when the source is very active. The QPOs themselves have a hard spectrum which suggests oscillations of the power law component. However, above 4 Hz we find that the frequency depends nearly linearly on the flux of the thermal component, and not on the power law component. When the thermal flux is lowest, a weak correlation with the power law flux is suggested. When the power law flux drops and the slope steepens at the end of the dips, the QPO then disappears. This strongly suggests that the two spectral components interact with each other. Such considerations have not received much theoretical treatment in the literature as yet. A more extensive set of observations of this phenomenon in GRS 1915105 will be presented by Muno, et al (1998).
References
- (1) Abramowicz, M. A., Chen, X., & Taam, R. E. 1995, ApJ, 452, 379
- (2) Alpar, M. A., & Shaham, J. 1985, Nature, 316, 239
- (3) Belloni, T., Mendez, M., King, A. R., van der Klis, M., & van Paradijs, J. 1998, A&A, 330, L9
- (4) Castro-Tirado, A. J., Brandt, S., & Lund, N. 1992, IAU Circ.5990
- (5) Chen, X., Abramowicz, M. A., & Lasota, J.-P. 1997, ApJ, 476, 61
- (6) Chen, X., Swank, J. H., & Taam, R. E. 1997, ApJ, 477, L41 (CST97)
- (7) Chen, X., & Taam, R. E. 1994, ApJ, 431, 732
- (8) Chen, X., & Taam, R. E. 1995, ApJ, 441, 354
- (9) Chen, X., Taam, R. E., Abramowicz, M. A., & Igumenshchev, I. V. 1997, MNRAS, 285, 439
- (10) Chen, X., Taam, R. E., & Swank, J. H. 1998, in Proceedings of the Fourth Compton Symposium, ed. C. D. Dermer, M. S. Strickman & J. D. Kurfess (New York: AIP), 995
- (11) Cui, W., Zhang, S. N., & Chen, W. 1998, ApJ, 492, 53
- (12) Greiner, J., Morgan, E. H., & Remillard, R. A. 1996, ApJ, 473, 107
- (13) Miller, M. C., Lamb, F. K., & Psaltis, D. 1998, ApJ, 508, 791
- (14) Mirabel, I. F., & Rodriguez, L. F. 1994, Nature, 371, 46
- (15) Mirabel, I. F., et al 1998, A&A, 330, L9
- (16) Mitsuda, K., et al 1984, PASJ, 36, 741
- (17) Molteni, D., Sponholz, H., & Chakrabarti, S. K. 1996, ApJ, 457, 805
- (18) Morgan, E. H., Remillard, R. A., & Greiner, J. 1997, ApJ, 482, 993 (MGR97)
- (19) Muno, M. P., Morgan, E. H., & Remillard, R. 1998, in preparation
- (20) Narayan, R., Kato, S., & Honma, F. 1997, ApJ, 476, 49
- (21) Nowak, M. A., Wagoner, R. V., Begelman, M. C., & Lehr, D. E. 1997, ApJ, 477, L91
- (22) Shakura, N. I., & Sunyaev, R. A. 1973, A&A, 24, 337
- (23) Swank, J., Chen, X., Markwardt, C., & Taam, R. 1998, in Accretion Processes in Astrophysical Systems: Some Like it Hot, ed. S. Holt & T. Kallman (New York: AIP), 327 (astro-ph/9801220)
- (24) Taam, R. E., Chen, X., & Swank, J. H. 1997, ApJ, 485, L83
- (25) Takizawa, M. et al, ApJ, 489, 272
- (26) Zhang, S. N., Cui, W., & Chen, W. 1997, ApJ, 482, L155
| Temporal State | Photon Index | |
|---|---|---|
| 1–15 Hz QPO | keV | |
| Low Freq. Noise | keV | |
| Quiet | —aaall temperatures |