The Mass of Black Holes in the Nuclei of Spirals.
Abstract
We use the innermost kinematics of spirals to investigate whether these galaxies could host the massive Black Holes remnants that once powered the QSO phenomenon. Hundreds rotation curves of early and late-type spirals are used to place upper limits on the central BH masses. We find: i) in late type spirals, the central massive dark objects (MDO’s) are about times smaller than the ones detected in ellipticals, ii) in early type spirals, the central bodies are likely in the same mass range of the elliptical MDO’s. As a consequence, the contribution to the QSO/AGN phenomenon by the BH remnants eventually hosted in Spirals is negligible: . We find several hints that the MDO mass vs bulge mass relationship is significantly steeper in spirals than in ellipticals although, the very issue of the existence of such relation for late Hubble type objects remains open. The upper limits on the mass of the BHs resident in late-type spirals are stringent: , indicating that only low luminosity activity possibly occurred in these objects.
1 Introduction
There is an increasing direct evidence that, at the centers of bulge-dominated galaxies, reside Massive Dark Objects (MDO), which are the likely remnants of the engines that once powered the QSO phenomenon (Ho, 1998). In a limited number of cases, the evidence comes from the spectacular central-body-dominated (CBD) rotation curves of circumnuclear () gaseous disks obtained by means of very high resolution instruments (i.e. HST, VLBI and VLBA, e.g. Bower et al. 1998, Cretton et al. 1998, Schreier et al. 1998).
In general, however, the evidence is more indirect: only careful studies of the dynamics of the innermost regions () of galaxies reveal the presence of a central compact object, allowing mass estimates (e.g. Kormendy and Richstone 1995; Magorrian et al. 1998; van der Marel 1997). The conclusions are that virtually every hot galaxy hosts a MDO with a mass ranging from to and roughly proportional to the mass of the spheroidal stellar component (). These MDO masses are large enough to match those associated with the QSO phenomenon. In fact, the highest bolometric luminosities of Quasars, (), under the assumption that the latter radiate at the Eddington limit, imply underlying BH masses of , i.e. masses comparable with those of the largest MDOs detected in ellipticals (Magorrian et al. 1998). On the other hand, the lowest QSO bolometric luminosities still imply considerable BH masses, of the order of (e.g. Paper I) that it will be hereafter considered as the minimum reference mass for a BH QSO-powering remnant. For disk galaxies the situation is different and much more uncertain. A direct determination of the central mass has been obtained only in a few cases (including M31 and the Galaxy) and remarkably, these do not exceed (see e.g. Paper I, Ho, 1998). That is, in spirals, MDO masses in the range of the QSO engine remnants have not currently been detected. This could be an intrinsic property of galactic BH’s, perhaps related to the link between the BH mass and the bulge mass, coupled with the relationship between the latter and the host galaxy Hubble type. In any case, the eventual lack of detections in spirals of massive BH () cannot be ascribed to observational biases. In fact, the “sphere of influence” , of a black hole of mass at the center of a galaxy at distance and with a projected central dispersion velocity is given by: with measured in arc-seconds. In hot, pressure-dominated systems, “balances” the gravitational attraction per unit mass due to a great part of the whole galaxy: since , the stellar dynamics, probed at resolution, can disentangle the central BH from the surrounding galactic nucleus only if . In rotationally-dominated objects a relation like the above still approximately holds when we substitute with the circular velocity. In this case, the RCs (Rotation Curves), often available down to , if correctly probe the gravitational potential, measure only the mass inside . Therefore they can resolve a central body of very small mass in that the nuclear stellar mass, obtained by extrapolating at low radii the stellar mass distribution, is quite small (e.g. PSS). Turning back the argument, if nuclei of spirals host QSO remnants, then the innermost kpc of their circular velocities will be strongly affected by such central bodies.
In paper I (Salucci et al. 1998) we showed that the Mass Function of Massive Dark Objects in elliptical galaxies matches that expected from the remnants of the past QSO activity. Extrapolating the E/S0 MDO Mass Function, we have predicted that only low mass MDOs reside in spirals and that in these objects activity has been statistically lower than in ellipticals. The aim of this work is to confirm this scenario by investigating, through MDO’s masses upper limits obtained by inner kinematics, the predicted strong Hubble Type dependence of the QSO remnant mass (Salucci et al. 1999, Monaco et al. 1999).
The plan of this work is the following: in section 2 we set up the issue, in sections 3 and 4 we derive the MDO mass upper limits for late and early type spirals, in section 4 we investigate the BH mass vs bulge mass relationship for disk systems and in section 5 we derive the constraints for the cosmological mass function of spiral BH.
It is worth to recall two definitions. Given a distribution of mass and the related gravitational potential , the circular velocity is defined as and for a point-like or a spherical distribution, the enclosed mass is given by . The rotation curve is a set of centered, folded and de-projected recessional velocities considered as a function of their galactocentric radii. These two quantities are in principle different, in that observational errors, non-axisymmetric disturbances, disordered motions and a finite spatial resolution modify into a different curve.
In this paper we assume , and we take, as the reference magnitude in the I-band, (which translates to in the B-band (e.g. Rhee, 1997)). No conclusion of this work depends on these choices.
2 QSO remnants in spirals?
Is the available kinematical data consistent with the centers of spirals being the host of the silent QSO remnants, i.e. of the BH-powered engines that once radiated at the Eddington rate (see Paper I)?
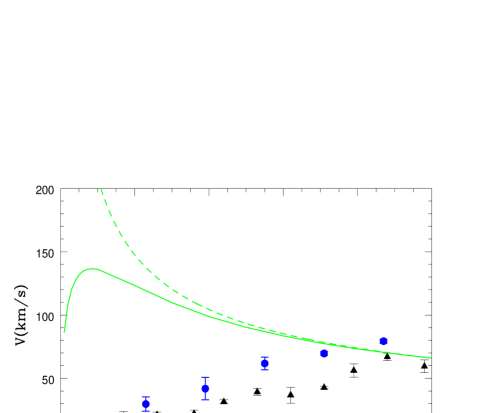
To introduce the data with which we will tackle this issue, we start from the 967 rotation curve of spirals recently published in PS95, and notice that most of them trace the kinematics down to the central kpc (PS95, see also MFB). These RC’s have an effective spatial resolution of , i.e. , where is the galaxy systemic velocity. The range of is large: , so that many objects (, see Appendix A) lie within a distance leading to a spatial resolution of or lesser, well sufficient to detect a QSO remnants similar to those commonly found in ellipticals. As an example, in Figure (1) we compare the innermost-kpc region of two typical RC’s belonging to our high-resolution sample (see below) with the circular velocity of a test particle rotating around a central body of mass , corresponding to an average elliptical MDO mass. In order to produce the actual rotation curve, the original circular velocity has been line-of-sight projected, seeing-convolved and pixel averaged (here and throughout the paper) following well-known prescriptions (e.g. Appendix D in Qian et al. 1995). In detail, we convolve with a FWHM Gaussian seeing and we process it by assuming an inclination of , a spatial resolution of perpendicular to the slit, and of along the slit, i.e. assuming values similar to those of the RC’s of our samples (see MFB). Furthermore (conservatively) . (No conclusion of this paper depends on which (reasonable) values are assumed for the above quantities.)
In Figure 1 we show the resulting : we realize that, an average-mass, QSO powering BH, situated in the center of these spirals, would be the major contributor to the rotation curve out to , i.e. 5-6 times their effective spatial resolution scale. Therefore, as we look for silent QSO in spirals, ground-based kinematical observations are able to detect their massive remnants, if present. On the other hand, the large number of RC’s in PS95/MFB sample provide the needed database to put this issue on a statistical basis. The available data amounts to about 800 (, one for each arm) measurements inside which refer to galaxies and four times more measurements inside . These data provide individual and synthetic RC’s and, in turn, the circular velocities.
The data-base for our investigation includes two sub-samples selected from the PS95 sample. More specifically, we select a sample, (herafter the IND sample) by including all the rotation curves that individually probe the mass distribution of the innermost and a sample (hereafter the SYN sample) by including all the rotation curves that collectively form the synthetic rotation curve of the innermost kpc (see Rubin 1982, PSS).
The IND sample is built by selecting all PS95 RC’s that fulfill the following criteria: (i) the RC has at least 4 measurements inside a radius of , ii) the innermost velocity data is situated inside a radius of , where is the I-band absolute magnitude. These criteria are a good compromise made in order to select a large sample of rotation curves equally distributed per magnitude interval, whilst at the same time being able to set very stringent upper limits to the MDO/BH mass. We find 83 RC’s that result smooth, symmetric and with negligible non-circular disturbances (see also Ratnam and Salucci, 1999) as it is also indicated by recent HST measurements (Erwin and Sparke, 1999).
The SYN sample is built by selecting all the RC’s in PS95 with at least one velocity data inside a radius of , except for the highest luminosity class, where we set . We found 158 RC’s with (2-10) data velocities each, notice that we neglect all the (few) velocities at distances on both arms, because the kinematical symmetry center cannot usually be determined with a precision better that (see PS95).
3 Massive Dark Objects in Late Types Spirals
To determine the upper limits for the spiral MDO masses we devise a dual (individual/coadded) multi-step strategy: 1) we prove that the mass distribution of a stellar disk (plus occasionally that of a bulge) generates a circular velocity that reproduces very well the observed innermost-kpc RC’s and moreover, . 2) we hide the biggest possible central BH in these RC’s by exploiting their r.m.s and the (small) discrepancies between the disk mass models and the observations. 3) we correct the derived mass upper limits for the effects of the finite spatial resolution.
First, we derive this correction by following Qian et al, (1995). For a point-like object observed with setup similar to that of our RC’s, to assume results incorrect by a non-negligible amount : (see Fig. (1)) and therefore it leads to underestimate the MDO mass by up to a factor . However, if the finite resolution effect would dominate, we should also find: . We observe, instead: that implies that the actual values of are smaller than the maximum one. This is because one fraction of originates from the diffuse stellar disk, which is free from above effect, and is has a positive log derivative , as the observed one. By applying to a disk+BH system the eqs. (1)-(5) of PS90 we estimate that the fraction of due the ordinary diffuse matter is more than so that: . Notice that, by assuming , no conclusion in this paper changes.
Then, the MDO mass upper limits are computed as
where indicates the MDO-to-total mass fraction (inside ) that can be hidden in the irregularities and/or in the r.m.s. of the rotation curves, and corrects for the depression of the circular velocity occurring when it is measured at a low spatial resolution.
3.1 MDO/BH upper-limits from the IND sample
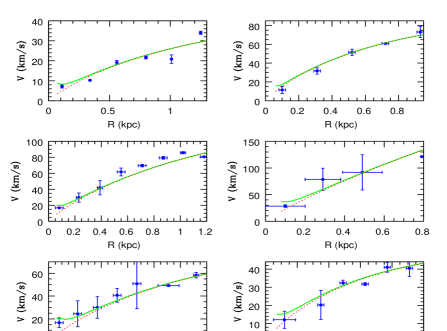
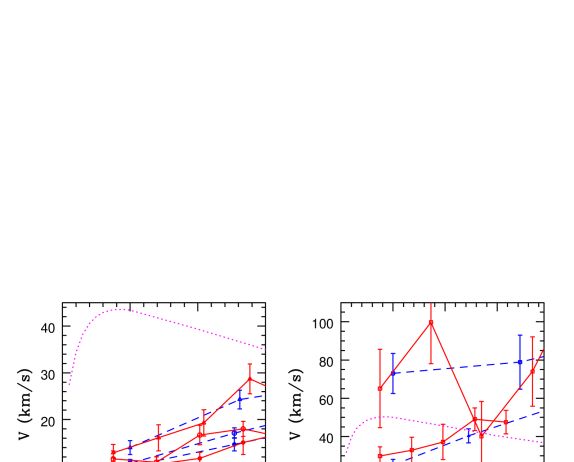
We reproduce the 83 RC’s of the IND sample by means of two mass models, the first of which features: (i) a Freeman disk of length-scale (derived from photometry, PS95) and mass and (ii) a MDO of mass given by Eq(1), while the second one assumes . In Fig. (2) we show the best-fitting solution for the first 6 RC’s of the IND sample relative to the (only disk, OD) and (disk+ black hole) cases. More details and the plots relative to the entire sample are given in Ratnam Salucci (1999). As result, the kinematics of the crucial innermost regions (i.e. ) never shows a pure CBD rotation curve, neither a RC obviously influenced by a BH+resolution effects. On the contrary, all RC profiles strictly conform to those generated by a mass distribution proportional to the light distribution, as it is best recognized by noticing that, at , the values of the local RC slopes, are in good agreement with those of a Freeman disk.
Despite that the no-MDO model fits have excellent reduced chi-squares: and result systematically better than the disk+ MDO model fits, we take the latter solutions to determine the MDO mass upper limits. We obtain values of that, galaxy by galaxy, range between and . These lead to the MDO mass upper limits plotted in Fig (3) as a function of galaxy luminosity. Notice the main uncertainty in these estimates comes from errors in the assumed distances that may be as large as a factor 2. Observational errors and mass modeling uncertainties induce, in the estimated upper limits, at most a fractional uncertainty of , that is negligible in that the findings of this paper involve effects of the order of one magnitude or more.
| (1) | (2) | (3) | (4) | (5) | (6) | (7) | (8) | (9) |
|---|---|---|---|---|---|---|---|---|
| 10 | 1.1 | 14.7 | 1.4 | 0 | ||||
| 10.6 | 0.9 | 17.1 | 1.1 | |||||
| 14.0 | 1.5 | 24.3 | 2.0 | |||||
| 25.1 | 3.0 | 40.4 | 3.7 | |||||
| 73.0 | 10.5 | 78.9 | 14.1 |
TABLE I (1) Average luminosity for each luminosity class (2) Disk length-scale (3) Bin size width, () (4) Rotation
velocity at (5) r.m.s. of (6) Rotation velocity at (7) r.m.s. of (8) Disk mass (in ) (9) Bulge
mass (in ).
3.2 MDO/BH upper-limits from the SYN sample
We sort the 158 objects of the SYN sample in 5 luminosity classes of average values (and average disk scalelenghts , see Table 1) and, for each class, we frame the RC’s with radial bins placed at the following positions: the first bin ranges from to (given in the previous section). The centers of the first bin are placed at , except for the highest luminosity class where it is placed at The centers of the following bins () are placed at at: , with given in Table 1. In view of a later investigation, let us point out that the coaddition length, , for many RC’s, is larger than the effective spatial resolution (see Appendix A), and can be further reduced for statistical tests.
From the rotation data relative to a radial bin (and to a luminosity class) we derive the bin average velocity and bin velocity r.m.s. (i.e. , , , . The resulting synthetic RC’s have smooth profiles (see Fig 4) and small r.m.s, , indicating that these curves are not significantly affected by non-circular and/or non-equilibrium motions. Moreover, these synthetic curves are independent of the coaddition scale. This is shown by means of a new set of zoomed synthetic RC’s that map the region out to with a coaddition length half than the previous one: by comparing the two sets of curves we realize that they are mutually consistent (see Fig 5).
We reproduce the synthetic rotation curves by means of a mass model including a Freeman disk and (at high luminosities) a Hernquist bulge. Disk length-scales are from PS95, bulge effective radii are estimated from disk-scale-lengths according to Courteau and de Jong, (1996). For the disk mass we adopt the values independently derived from the outer (1-10 kpc) kinematics (see PSS). The mass model has no free parameters in the three least-luminous luminosity classes, and one free parameter, the bulge mass, in the remaining two. The mass models vs data are shown in Fig (2). Remarkably, in the region presumably most affected by the presence of a central mass, the stellar components fully account for the observed kinematics (see Table 1 for the parameters of the mass models). In the innermost half-kpc the light traces the gravitating mass to an accuracy that leaves no room for a more diffuse dark component.
We derive the MDO mass upper limits by taking into account that we are dealing with coadded RC’s, rather than with individual ones. Then, we set up to automatically maximise the MDO mass upper limits. We assume: i) a mass model including a MDO + a stellar component with the steepest allowed mass profile: and, ii) the r.m.s. in are entirely due to the presence of MDO’s so the upper limits derived by eq. (1) will be multiplied by the additional term .
By requiring that the above mass model reproduces the RC’s at and at , we get:
where . Specifically, for the lowest luminosity class, continuosly rises to reach at highest luminosity class. Then, eq. (1)-(2) and ii) determine the (late type spirals) maximum central mass compatible with the RC’s of the SYN sample. Notice that the innermost-kpc mass models of objects of the IND sample show MDO’s masses upper limits are on average smaller than those derived with the above (more conservative) assumptions.
3.3 MDO/BH upper limits in Sb-Im
Before we draw our conclusion let us point to Appendix B where we show that we need a very small correction to Eqs (1) in order to take into account the part of the gravitational attraction balanced by pressure gradients rather than pure rotation; more specifically. In Sb-Im’s the asymmetric drift term in the Jeans Equation is not a relevant fraction of the circular velocity and therefore the rotation velocity does not significantly underestimate the enclosed mass.
The upper limits on MDO’s obtained from the IND and SYN samples are very similar, though the methods employed are different and complementary. In detail, the ”detection” method used for the IND sample has a lower mass threshold and it probes each galaxy separately, while the one employied for the SYN sample is negligibly affected by observational errors or galaxy peculiarities and it involves a larger statistics. As matter of fact, the luminosity-averaged values upper limits obtained for the IND sample (see Fig (2)) turn out to be just smaller than those obtained for the SYN sample (shown in Fig 6).
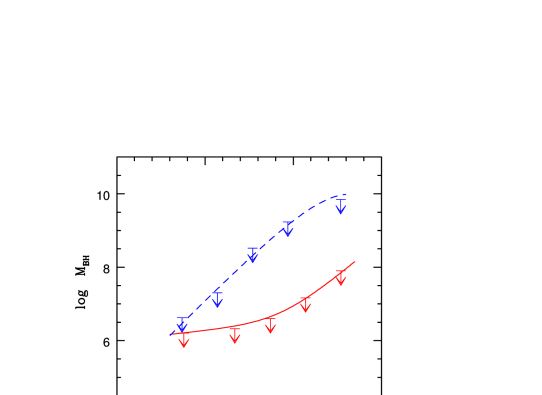
The global results are shown in Fig.(6): MDO’s in spirals, if existing, are remarkably less massive than those detected in ellipticals: strict limits on their mass range between at to at . Only in the very most luminous spirals (i.e. ), that amount to only few per thousand of the whole population, the upper limits reach (barely) allowing a QSO powering MDO.
4 MDO in Early Type Spirals
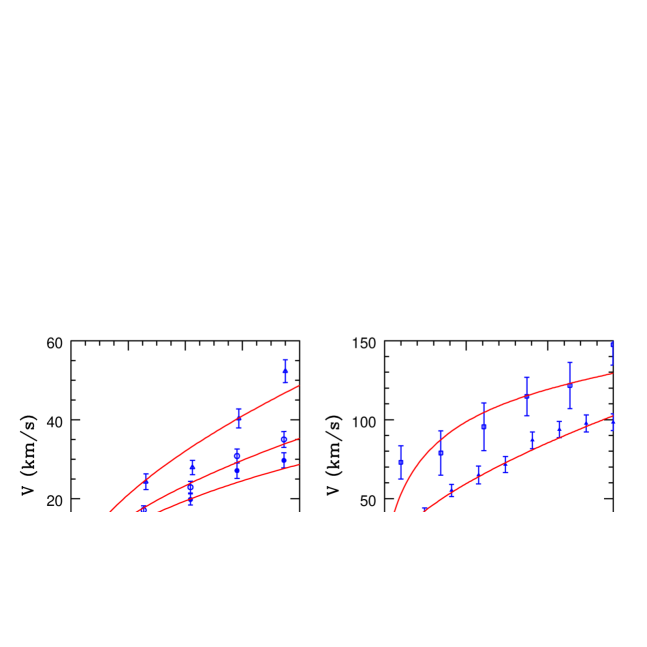
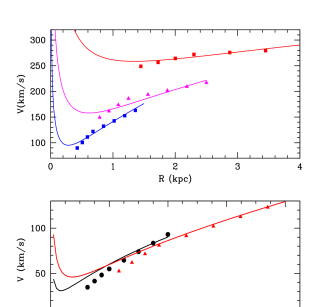
Sa galaxies are much less numerous than late type spirals, however, in view of their massive bulge, , they must be considered as a possible location for QSO remnants. From an observational point of view, we note that there are few available Sa rotation curves also because these objects have little star-formation and weak lines. However, the largest available sample (Rubin et al., 1982) allows us to perform a useful investigation on the values of MDO masses in early type spirals. With their sample Rubin et al. (1982) derived the synthetic (coadded) rotation curves sorting the 21 objects in 5 luminosity classes and in 8 radial bins of size , with . The center of the first radial bin is displaced from the galaxy center by to avoid the complex and uncertain nuclear kinematics. In Fig.(7) we show these coadded curves out to , and their interpolation out to . We have checked that this interpolation out to is consistent with the kinematics of each individual galaxy, apart from certain regions of complex motions, not related to the central mass. Notice that, differently from Sb-Im galaxies, in Sa’s we are forced to set the coaddition length much larger than the seeing or the instrumental resolution (and no correction for these latter is then needed).
Sa galaxies have higher circular velocities than Sc galaxies (Rubin et al. 1982): the total mass inside the innermost kpc is 4-10 times larger than that in late type galaxies. The methods devised to MDO upper limits late type spirals rest upon the accurate knowledge of the profile of the rotation curve inside the central half- and it cannot be adopted in Sa’s also because the bulge-disk photometric decomposition is uncertain. We then devise a new method, proper also to tackle a limited statistic.
| (1) | (2) | (3) | (4) | (5) |
|---|---|---|---|---|
TABLE 2. (1) . (2) & (3) Disk and Bulge Mass (in ) (4) & (5) DM parameters and see PSS for details.
We proceed by first reproducing the coadded Sa rotation curves by means of no-MDO three-components mass models that include a Freeman disk, a Hernquist bulge and a dark halo with density profile according to PSS. This last component is introduced for completeness, but it has no role in the present analysis. We find that, the ordinary stellar components can very well account for the rotation curves out to , and, by including the DM component, out to . The parameters of the mass models, given in Table 2, are similar to those of Sc galaxies, with the exceptions of an (important) higher central density of both luminous and dark components and an (irrelevant) larger uncertainty on the distribution of DM. We then include in the mass models a central mass component large enough to affect the innermost kinematics. By increasing the value of the MDO mass, the models are progressively unable to reproduce the data until for a central mass value of , the model rotation curves become inconsistent with the coadded ones at a level (with ) (see Fig.(7)).
The derived MDO upper limits (see Fig.(6)) range from , and, though obtained from measurements with high-threshold mass detection, they, nevertheless, indicate: 1) at a given luminosity, MDO upper limits for Sa’s are up to one order of magnitude larger than those in later Hubble types. Apart from factors of 2-4 that could be due to the lower spatial resolution in Sa’s, this is not a selection bias. In fact the innermost half-kpc of early type spirals contains a larger mass than the corresponding region of late type spirals, and therefore can conceal a more massive MDO 2) the top most luminous Sa’s, , are serious candidates for QSO remnants, in variance with objects of lower luminosity, in which the nuclear masses do not exceed .
5 The MDO vs Bulge mass ratio
Observational evidence and theoretical arguments relate the MDO mass with that of the hot component of the host galaxy (in spirals: the bulge). In samples dominated by ellipticals, it has been found (Paper I) that is a proportionality between the two masses with a quite large scatter. Here, we investigate the ratio between these two masses in disk systems, where the mass of host systems is a factor 10-100 times smaller.
For Sa’s the bulge masses are directly obtained by the present mass modeling (see Table 2). Sb-Im galaxies possess small bulges, whose luminosity is on an average the stellar disk luminosity (e.g. Simien and de Vaucouleurs, 1986). In detail, the bulge-to-disk luminosity ratio strongly depends on galaxy Hubble Type decreasing from in Sb, to in Sd’s, while it is (almost) independent of luminosity. The bulge-to-disk mass ratio is given by where the multiplying term takes into account that bulges and disks have different stellar populations and therefore different stellar mass-to-light ratios In fact, the bulge mass-to-light ratios are higher than the disk by a factor (Van der Marel 1996; PSS). This, inserted in the above equation, yields to two limiting relationships between disk and bulge masses: and . For a number of objects with known bulge mass, the MDO mass has been directly determined (see Ho, 1998). This sample of six objects provides the crucial calibration of the MDO-bulge systematic in spirals.
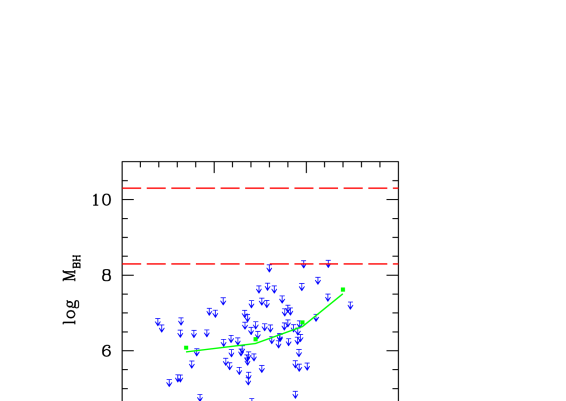
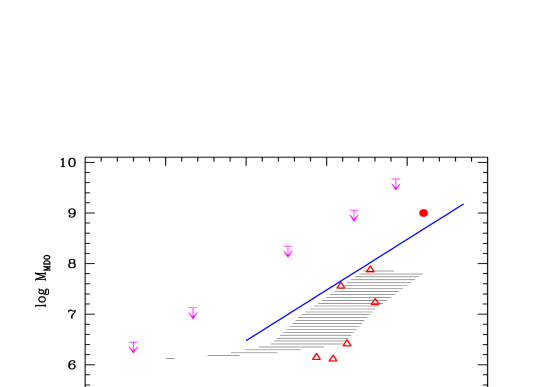
In Fig.(8) we show the bulge-MDO mass relationship, namely with MDO upper limits for early and late type spirals and MDO determinations for spirals and ellipticals. Both upper limits and actual detections show that MDOs in early type spirals may follow the elliptical vs relationship (Paper I). On the other hand, late type spirals, even conceding a direct proportionality between these masses, clearly show a lower zero-point of the MDO mass. Notice, that the Magorrian et al. (1998) zero-point of the MDO mass vs bulge mass relationship implies a larger discrepancy between the values of MDO masses in ellipticals and spirals.
As a result, at a given bulge mass, the mass of the central dark body depends on the Hubble type of the host galaxy. Thus, we are lead to conclude that the bulge mass does not play an exclusive role in “determining” the BH mass.
6 Discussion and Conclusions
Where are the engines of the QSO phase, i.e. where are the masses, as large as , of the BH remnants presently located? Recent observations suggest that every hot system hosts a central BH (Magorrian et al. 1998) of mass of a few times the mass in stars. Integrating the MDO upper limits over the spiral luminosity functions we obtain an upper limit for the cosmological density of MDOs residing in spirals. Assuming that galaxies distribute according to Schecther luminosity functions , with the parameters given in Paper I, we get :
These limits must be compared with the cosmological BH mass density, as implied by the QSO/AGN accreted material, estimated to be as large as (Paper I). Thus, the contribution to the shining phase of quasar due to BHs hosted in late type spirals is totally negligible.
The role of spirals as BH hosts can be further elucidated by determining the MDO upper limits mass function (ULMF), which can be obtained by convolving the spiral luminosity functions with the MDO mass limits as a function of the luminosity. Inspection of Figure (9) indicates that, while the QSO/AGN phenomenon implies the existence of a large number of BH’s with a wide range of masses, , the inner kinematics of late type spirals, in agreement with the few detections available so far, specifies that these systems can be major hosts of BHs only for . Notice that recent estimates seem indeed to indicate very low values for the BH masses in spirals (Colbert and Mushotzky, 1999)
Thus, we can rule out the possibility that in the distant past cold stellar systems such as late type spirals hosted highly luminous QSOs. The nuclei of these objects possibly host only minor activity, of which low luminosity Seyferts and liners represent perhaps the “last fires in the last galaxies”.
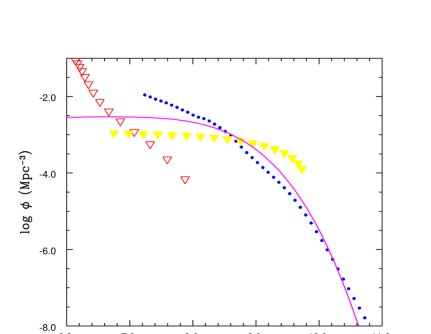
Outside these mass scales (see Fig. (9)) different Hubble types must provide the location for the great majority of BH remnants. In particular, nuclei of the most luminous Sa may contribute, with at the mass scale of , to the locations of the present population of dormant BHs once at the heart of the QSO shining phase. In fact, at higher BH masses the number of Sa hosts declines exponentially, while lower masses are outside of the QSO phenomenon.
What about for the Hubble types with peculiar luminosity and/or central surface brightness? Mass models of dwarf ellipticals and rotation curves of dwarf spirals imply that in these objects the gravitating mass inside the innermost is (Salucci & Persic 1997); LSB rotation curves, on the other hand, indicate that the gravitating mass within the innermost kpc is (e.g. Salucci and Persic, 1997). In addition, in these objects a diffuse dark matter component largely contributes to the “central” dark mass. Thus, we can completely neglect these Hubble types as host for dormant BH’s in the QSO-engine mass range.
A-fortiori, then, ellipticals and S0s remain the sole location for the QSO remnants both for the common detection in the nuclei of these objects of very massive MDOs and for the exclusion of all other galaxy types. This conclusion is supported by recent results obtained with HST, which show that all the QSOs brighter than appear to reside in elliptical galaxies (McLure et al. 1998).
7 Appendix A
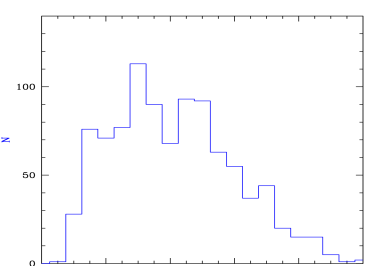
In Fig (10) we show the distribution of kinematical distances for the PS95 sample. The scale is: .
8 Appendix B
Altough the presence of an axisymmetric drift, common at very low radii in early type galaxies (e.g. Kent 1988), is unlikely in objects of later type types (Vega Beltran and references therein, 1999), it is worth to investigate its possible relevance on the RC’s of our samples.
IND Sample The OD mass model has just one free parameter, the disk mass, determined by the outer kinematics not affected by non-circular motions. Therefore, in the case of no-central MDO, if, at , the axisymmetric drift dominates, we should detect a significant excess of the OD circular velocity with respect to the observed value . Since in the great majority of the 83 RCs the OD prediction perfectly agrees with data, it is unlikely that, in each galaxy, the central object plot to exactly compensate the part of cut off by the axisymmetric drift.
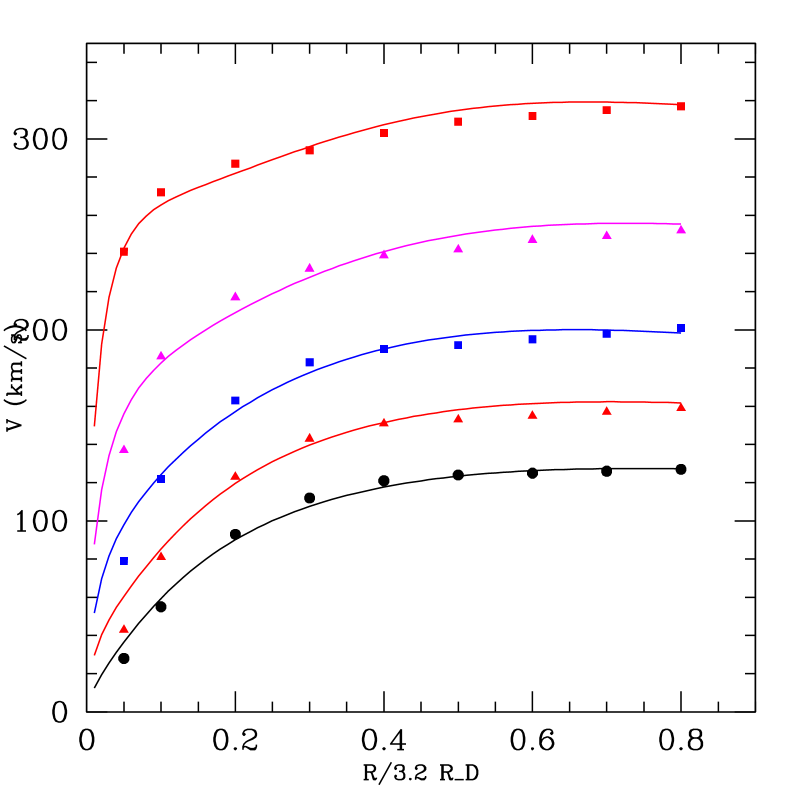
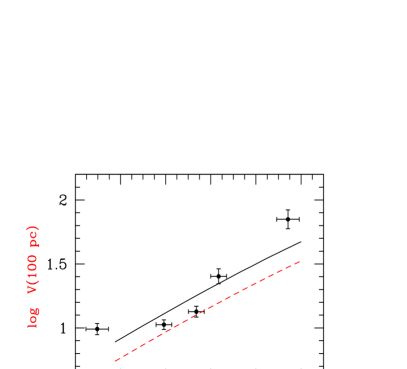
SYN Sample A set of exponential thin disk RC’s of different length-scales (in pc) gives rise to a set of RC’s, that, when estimated at a fixed radius (e.g. ), depend on as shown in Figure 11 (see PSS and Salucci and Persic, 1999 for details). Then, the observed velocity- relationship, (see Figure 11), in perfect agreement with the above Tully-Fisher-like prediction, should be considered as a further coincidence, in the case of a systematic presence of a large axisymmetric drift effect. Finally, we can use the above relationship to show that, at the rotation velocity is a good measure of the circular velocity: .
9 ACKNOWLEDGMENTS
We thank the referee for very useful suggestions that have improved this work. One of the authors C.R would like to thank the hospitality of ICTP/SISSA where this work was carried out. We thank Ezio Pignatelli for helpful discussion. We also thank financial support by ASI.
REFERENCES
Bower G.A., etal, 1998, ApJ, 492, L111
Colbert, E. F., Mushotzky, R. F, 1999 astro-ph/9901023
Courteau S., Rix, H.W. 1997, AAS, 191, 7702
Courteau S., DeJong R. S., Broeils A.H., 1996, ApJ, 457, L73
Cretton N., van den Bosch F.C., preprint in astro-ph/98053324
Erwin, P. and Sparke, L., 1999 preprint in astro-ph/9906262
Ford H. C., Tsvetanov Z.I., Ferrarese L., Jaffe W., 1997, in Proceedings IAU Symposium 186, Kyoto, August 1997, D.B. Sanders, J. Barnes, eds., Kluwer Academic Pub.
Ho L.C., 1998, in Observational Evidence for Black Holes in the Universe, ed. Chakrabarti, S. K., Kluwer Academic Pub.
Kormendy J., Richstone D., 1995, ARAA, 33, 581
Magorrian J., Tremaine S., Richstone D., Bender R., Bower G., Dressler A., Faber S.M., Gebhardt K., Green R., Grillmair C., Kormendy J., Lauer T.R., 1998, 115, 2285
Matheweson, D.S, Ford, V.L., Buchorn, M. 1992, ApJS, 81,413, MFB
McLure R. J., Dunlop J. S. , Kukula M.J, Baum S. A., O’Dea C. P., Hughes D. H. , 1998, preprint in astro-ph 9809030
Persic M., Salucci P., 1990, MNRAS, 247, 349 PS90
Persic M., Salucci P., 1995, ApJS, 99, 501
Persic M., Salucci P., Stel F., 1996, MNRAS, 281, 27, PSS
Qian, E.E., de Zeew, P.T., van der Marel R.P., Hunter, C. 1995, MNRAS, 274, 602
Rhee M.H. 1997, Phd. Thesis, Groningen University
Ratnam C. , Salucci P. 1999, submitted
Rubin V.C., Thonnard N., Ford W.K, Burstein D, 1982, ApJ, 261,439
Salucci P. , Persic M. ASP Conference Series 117, 1 , 1997 Eds: Persic. M and Salucci P.
Salucci P., Szuskiewicz E., Monaco P., Danese G., 1999 MNRAS, in press, Paper I
Schreier E.J. etal preprint, astro-ph/9804098
Simien F., DeVaucouleurs G., 1986, ApJ, 302, 564
van der Marel R.P., 1997, in Proceedings IAU Symposium 186, Kyoto, August 1997, D.B. Sanders, J. Barnes, eds., Kluwer Academic Pub.
van der Marel R.P., 1998, astro-ph 9806365
Vega Beltran, J.C., Zeilinger, W.W., Pizzella A., Corsini, E.M., Bertola, F., Beckman, J., 1999, astro-ph 9906349