06 (04.19.1, 08.14.1, 13.25.5)
R. Neuhäuser, rne@mpe.mpg.de
On the number of accreting and cooling isolated neutron stars detectable with the ROSAT All-Sky Survey
Abstract
We present limits to the curve for isolated neutron stars, both cooling and accreting neutron stars, which are not active as radio pulsars, as observed with the ROSAT All-Sky Survey and compare it with theoretical expectations. So far, only one isolated neutron star is identified optically among ROSAT sources, namely RXJ185635-3754 (Walter & Matthews 1997). Three more promising candidates have been suggested. In addition, several upper limit estimates are available on the space density of such neutron stars from different optical follow-up studies. We show that the curve according to the current observations, including the identified neutron star, the three additional candidates, and the upper limits, lies between the theoretical expectations for middle-aged cooling neutron stars and old accreting neutron stars. At least one of the neutron star candidates found so far with ROSAT may be cooling instead of accreting. We suggest that the fact that more accreting isolated old neutron stars were expected (e.g., Madau & Blaes 1994) than observed is mostly due to the velocity distribution used in those calculations. More recent radio observations indicate that there are fewer slow neutron stars, ie., fewer accreting X-ray bright old neutron stars. At the X-ray bright end of the curve, however, the ROSAT observations agree well with the theoretical expectations.
keywords:
Surveys – Stars: neutron – X-rays: stars1 Introduction: Isolated neutron stars
Both from the metallicity of the interstellar medium and the rate of supernovae (Narayan & Ostriker 1990, van den Berg & Tamman 1991, Tamman 1994), it is expected that the Galaxy is populated by to neutron stars (NS); of those, only have been discovered so far as radio pulsars or in binary systems (Taylor et al. 1993). Isolated old NS (IONS), which are not active as radio pulsars (see Caraveo et al. 1996), may be visible as bright (up to ) and soft ( to ) X-ray sources, for to . They can emit X-rays either as old NS due to accretion of material from the interstellar medium (Ostriker et al. 1970) or as middle-aged NS due to emission from a cooling surface (eg., Becker 1995).
Depending on some model assumptions, a few hundred to several thousand accreting IONS were expected to be detectable with the ROSAT All-Sky Survey (RASS) in the to range (Treves & Colpi 1991, henceforth TC91; Colpi et al. 1993; Blaes & Madau 1993, henceforth BM93; Madau & Blaes 1994, henceforth MB94). The fact that only one to four IONS (see Sect. 2 for details) have been found among RASS sources so far seems to be in contradiction with the expectations. Eg., Livio et al. (1998) argue that this is due to a magnetic field evolution different from what is assumed so far. However, as already pointed out by Neuhäuser et al. (1997) and Haberl et al. (1997), only the X-ray brightest IONS can be identified as such with currently available optical telescopes (see Sect. 3 for details).
The theoretical expectations by TC91 and MB94 are partly based on the distribution of the space velocity of NS at birth. Because Bondi-Hoyle accretion (Bondi & Hoyle 1944) scales with , only the slowest NS will be bright enough to be detectable in the RASS. Both the TC91 and MB94 calculations are based on the NS birth velocity distribution suggested by Narayan & Ostriker (1990), but more recent studies indicate that there are significantly fewer NS with low velocities (Lyne & Lorimer 1994, Manning et al. 1996, Hansen & Phinney 1998a, 1998b, Cordes & Chernoff 1998), so that there would consequently also be fewer IONS detectable with the RASS (see Sect. 5 for details).
In this paper, we first summarize the observational facts on the number and space density of accreting IONS found in the RASS by compiling all the data known for individual IONS candidates (Sect. 2) and listing upper limits on the IONS space density obtained from follow-up identification programs (Sect. 3). In Sect. 4 we present several estimates for the local space density of NS and derive the curves for IONS observable with the RASS for both cooling and accreting NS. Finally, in Sect. 5, we compare these expectations with actual observations and discuss, whether the apparent discrepancy may be due to the velocity distribution of NS being different from the one assumed in TC91 and MB94.
2 The isolated neutron stars found so far
The only candidate IONS from Einstein Observatory follow-up programs, namely MS0317.7-6647 (Stocke et al. 1995), shows a hard energy tail in its ASCA spectrum and may hence be a low-mass X-ray binary located in NGC 1313. With the ROSAT PSPC, the whole sky has been observed down to a limiting flux of . Voges et al. (1996) have published the RASS Bright Source Catalog called 1RXS with 18811 sources down to a limiting count rate of . For details on ROSAT and its prime instruments, the Positional Sensitive Proportional Counter (PSPC) and the High Resolution Imager (HRI), see Trümper (1982), Pfeffermann et al. (1988), and David et al. (1996), respectively.
So far, only one IONS has been identified optically among RASS sources, namely RXJ185635-3754 111also called RXJ1856.53754, 1RXS J185635.1375433, 1RXP J1856353754.7, 1WGA J1856.53754, 1ES1853379, 1ES185337.9, 1RXH J185635.3375432 (Walter et al. 1996, Neuhäuser et al. 1997, Walter & Matthews 1997, Neuhäuser et al. 1998), a bright ( with the PSPC) and soft ( blackbody spectrum) previously unidentified RASS source. It was first detected by the Einstein Observatory slew survey, then with RASS as well as PSPC and HRI pointed observations; all the different flux measurements are consistent with constant X-ray emission, the flux being . It has also been detected with the EUVE (Lampton et al. 1997). Walter & Matthews (1997) have identified the optical counterpart with the HST at mag () and mag (), ie., faint () and blue as expected for IONS. The object has also been detected from the ground with the ESO-3.5m-NTT at mag (Neuhäuser et al. 1998).
The object is located near the R CrA dark cloud area, most certainly inside or foreground to this cloud (see Fig. 2 in Neuhäuser et al. 1997) at a distance of (Marraco & Rydgren 1981). An upper limit to the radius can be obtained using the Greenstein & Hartke (1983) model with at the pole and at the equator, which yields the emitting area () and . The small distance is consistent with the low absorbing column density found in a fit to the PSPC spectrum, namely mag or (Walter et al. 1996). The optical magnitudes are inconsistent with the non-magnetic H or He atmospheres predicted by Pavlov et al. (1996), and are also brighter than their pure black-body spectrum by mag, and fainter than their magnetic H atmospheres by mag. Although these inconsistencies might indicate an ion cyclotron emission feature, we do not favor this explanation, because the EUVE, , , and fluxes all follow a Planckian, which is somewhat more absorbed than by just mag, which was obtained from the PSPC spectrum alone. Because this NS cannot be associated with any supernova remnant and because it does not show pulsation, it may well be an IONS accreting from the interstellar medium.
| Table 1. Upper limits on space density of RASS-detected IONS | |||||
| Projects and areas | area | number | space density of | count rate | reference |
| of IONS | IONS per sr | limit | |||
| Hamburg Quasar Survey | 8480 | 0.05 | Bade et al. (1998) | ||
| Gal. Plane Survey Cygnus | 64.5 | 0.02 (0.012) | Motch et al. (1997a,b) | ||
| Northern areas I, IVac (Va) | 216 (37) | 0.03 (0.01) | Zickgraf et al. (1997) | ||
| High-latitude MBM clouds | 64.5 | 0.012 | Danner et al. (1998a) | ||
| Dame et al. dark clouds | 1600 | 0.05 | Danner et al. (1998b) | ||
| Very bright soft sources | 30000 | 0.5 | Thomas et al. (1998) | ||
RXJ0720.4-3125 222also called 1RXS J072025.1312554 is another NS among previously unidentified RASS sources. It was first discovered in the ROSAT Galactic Plane Survey (Motch et al. 1991) and is similar to RXJ185635-3754. Its PSPC spectrum with shows a blackbody spectrum with low () absorption (Haberl et al. 1997). Its emission is modulated by a pulse period. Recently, Motch & Haberl (1998) presented two optical candidate counterparts to this RASS source at (star X1) and mag (star X2), detected with the ESO-3.5m-NTT. Star X1 has also been detected by Kulkarni & van Kerkwijk (1998), their star X, with and ) mag with the Keck II. Hence, with the X-ray flux being , the flux ratio excludes everything else than an IONS.
Another candidate IONS has been found in the galactic plane, namely RXJ0806.4-4123 333also called 1RXS J080623.0412233 (Haberl et al. 1998). The PSPC count rate of this source is . The blackbody spectrum has for an absorbing column density of . No optical counterpart has been found so far down to mag (Haberl et al. 1998), so that may already exclude everything but an IONS as counterpart.
The RASS source RXJ1308.6+2127 444also called 1RXS J130848.6212708, RBS1223 found during the ROSAT Bright Survey (RBS) by Schwope et al. (1999), with can be nothing else than an IONS. This source is also soft and, with observed with the PSPC, it is the faintest IONS candidate found so far. No optical counterpart has been found down to mag inside the arc sec error circle around its HRI position (Schwope et al. 1999).
3 Observed upper limits on the number of IONS
There are several programs under way aiming at the identification of RASS sources (compiled in Table 1). They all provide some constraints on the number density of IONS: The number of unidentified sources can be taken as upper limit to the number of IONS. However, selection effects may bias these searches against finding IONS. For example, a bright star or AGN near the RASS source position may be incorrectly assumed to be the correct counterpart. Hence, we have to add the number of possible mis-identifications to the number of unidentified sources to obtain the upper limit to the number of IONS. Following Bade et al. (1998) and Motch et al. (1997a,b), we allow of possibly wrong identifications for the remainder of the surveys, as listed below. This is a conservative estimate, because the probability for random positional coincidence of an X-ray source with, eg. a CV, AGN, hot white dwarf or else, is at a PSPC count rate of . This is extremly conservative, because neither will all the mis-identificatified X-ray sources be IONS nor are all the as yet unidentified sources really IONS.
The follow-up identification programs compiled in Table 1 are as follows:
-
•
Bade et al. (1998), in the Hamburg Quasar Survey, search for optical identifications to RASS sources with .
-
•
Motch et al. (1997a,b) have identified all but a few sources in their deg2 Cygnus area.
-
•
Zickgraf et al. (1997) have carried out an identification program for several northern high-latitude fields. In their areas I ( deg2) and IVac ( deg2), they could identify all but a few sources.
-
•
Danner (1998a) searched for IONS in all translucent clouds listed in Magnani et al. (1985).
-
•
Danner (1998b) also searched for IONS in the dark clouds listed by Dame et al. (1987), a total of deg 2. He investigated and identified all the soft and bright RASS sources in or near these clouds, but found only one IONS candidate, namely RXJ185635-3754, which was already presented by Walter et al. (1996).
-
•
For the ROSAT Bright Survey (Hasinger et al. 1997), an identification program for all the bright RASS sources with a count rate in the deg2 area at excluding the Virgo cluster and the Magellanic clouds, no reliable numbers on unidentified or possibly mis-identified sources are available, yet. Within this program, however, Schwope et al. (1999) identified RXJ1308.6+2127 as IONS candidate as mentioned above.
-
•
Thomas et al. (1998) identified all but one of the bright (), soft (more counts in the band than in the band) RASS sources at , but did not find any IONS.
Most of the expected NS have small X-ray fluxes and are faint optical sources. On the assumption that the optical magnitude of the only reliably optically identified IONS (RXJ185635-3754) is typical for these objects, an IONS near the RASS flux limit has mag. However, Geminga shows optical emission brighter than expected from a blackbody extrapolation of its X- and -ray spectrum, possibly an ion cyclotron line (Mignani et al. 1998). Hence, radio-quiet, isolated (middle-aged and old) NS may actually be up to mag brighter in the optical than expected from pure blackbodies. However, the claimed cyclotron emission feature on Geminga relies on only one data point, and neither RXJ185635-3754 nor the three IONS candidates (not yet detected optically) do show any indication for such an emission feature. This argues against optical emission features to be abundant in IONS.
The ESO-3.5m-NTT can achieve a limiting magnitude of mag in an one hour exposure (at new moon, with arc sec seeing, for a detection). Hence, with a ten hour exposure (a full long night), one can detect objects as faint as mag. With the Keck 10-m telescopes and the HST, the best currently available telescopes, one can achieve a limiting magnitude of mag (with similar parameters as above). Using the ESO-8.2m-VLT telescopes UT1 and UT2, both simultaneously with FORS 1 and FORS 2, one will be able to detect objects as faint as mag when exposing for as long as a full winter night. This is exactly the optical magnitude expected for an IONS with X-ray count rate at the RASS flux limit.
4 The curve of isolated NS
We shall first compare estimates for the local space density of NS, and will then derive the expected curves of RASS detectable old accreting and middle-aged cooling NS. Then we compare these expectations with actual ROSAT observations, both detected IONS (and candidates) as well as upper limits on their space density.
4.1 The local space density of neutron stars
One can estimate the number of IONS to be detectable with the RASS due to accretion by investigating Bondi-Hoyle mass accretion onto an IONS travelling through the ambient interstellar material, which is assumed to be ionized.
TC91 estimate the number density of IONS by a Monte-Carlo simulation to be (projected onto the galactic plane). Assuming Bondi-Hoyle accretion, TC91 derive the curve for RASS detectable IONS (see their Fig. 1), shown also in our Fig. 1. Because the probability to discover such an accreting IONS is larger in regions with dense interstellar material, Colpi et al. (1993) list the numbers of IONS individually for a number of near-by galactic dark clouds.
BM93 derived the number density of NS to be , if there are a total of NS in the Galaxy. These are NS with ages up to the age of the Galaxy, yrs.
To check whether the assumptions made for those calculations are correct, eg., regarding the local NS space density (or the total number of NS in the Galaxy), we can compare those numbers with actual observations, both radio and X-ray observations: Lyne et al. (1998) estimated the number of unabsorbed NS, observable as radio pulsars, to be (corrected for beaming). A NS is observable as radio pulsar up to an age of yrs. Hence, extrapolating from the density of up to yr old NS to the density of up to yr old NS, the NS density from radio observations is .
The density of NS can also be estimated from NS found as X-ray point sources in supernova remnants. There are four such objects within kpc, namely Puppis A, G, PKS , and G (see Caraveo et al. 1996). Allowing for some obscuration by interstellar absorption, the real number may be somewhat higher, say four to ten NS in supernova remnants within kpc. Hence, their density is to . These objects are up to yrs old. Hence, extrapolating to up to yr old NS, the NS density from X-ray observations is to .
The numbers obtained by Lyne et al. (1998) from radio observations and by us from X-ray observations are consistent with each other, but the numbers obtained by TC91 and BM93 are somewhat different, probably due to unrealistic assumptions made by TC91 and BM93. We shall use for the remainder of this paper.
4.2 Accreting neutron stars detectable in the RASS
Using the local space density of NS obtained in BM93, and assuming as density of the local interstellar material within around the Sun, ie. inside the local bubble, and outside, MB94 obtain the number of IONS detectable along the line of sight above a ROSAT PSPC count rate to be
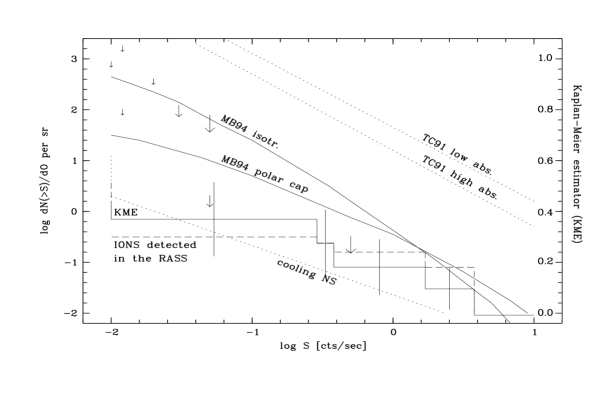
with as maximum source distance and the IONS accretion rate distribution . MB94 plot the cumulative source counts expected for the RASS in their Fig. 2b, also shown in out Fig. 1.
4.3 Cooling neutron stars detectable in the RASS
The standard NS cooling curve following the F-P model (Friedman & Pandharipande 1981, Umeda et al. 1993) is consistent with the observational data (see Becker & Trümper 1997), so that the X-ray luminosity of a cooling NS drops fast at yrs, ie. at . Therefore, in order to restrict the calculation to young, up to yrs old NS, we have to scale the space density given above, assuming that the birth rate of NS has been constant in time. Hence, the local space density of up to yr old, ie., X-ray bright NS, is (or for a scale height of 450 pc).
For an object with a blackbody spectrum, the PSPC instrument detects X-ray photons most efficiently for spectra peaking at . At this energy 555 According to the Technical Appendix of the ROSAT Call for Proposals, the counts to energy conversion factor is for ., the RASS detection limit of corresponds to an X-ray flux of , if absorption is negligible. Hence, one can detect an unabsorbed NS with the RASS up to a distance of .
Now, if we consider low absorption by H atoms (Paresce 1984), again to be conservative (in order not to underestimate the number of cooling NS), one can detect a NS with down to the RASS limit only up to a distance of . Hence, in a cylinder with radius and a scale-height of pc, there are isolated cooling NS to be expected in the RASS down to the flux limit of . This corresponds to cooling NS number density of . We display the corresponding curve in Fig. 1.
5 Discussion and conclusion
In Fig. 1, we compare the expectations by MB94 and TC91 for accreting NS and - as estimated above - for cooling NS with all the observations available so far, both the lower limits due to the four identified IONS (candidates) and the upper limits as compiled above. Taking into account the upper limits and the identified NS candidates, ie., using the Kaplan-Meier estimator (computed with ASURV, Feigelson & Nelson 1985, Isobe et al. 1986), we get approximately the same curve as for the four IONS (candidates) alone.
At or above the PSPC count rate of the faintest IONS candidate known so far (), one would expect about one cooling isolated NS, and between one and four are found so far. For those four, however, it is not known, yet, whether they are cooling, middle-aged NS or accreting IONS.
The upper limits to the number density of IONS detected by RASS at the fainter end, towards the RASS detection limit, do not rule out any of the models, just because these upper limits are obtained in limited areas, ie., are not hard limits.
At the bright end of the curve, the lower limits derived from the four IONS candidates are consistent with the data because all bright RASS sources are already identified. The observations indicate that there are a few more IONS than expected from the curve of cooling middle-aged NS. At the X-ray bright end, the observed curve agrees well with the expectation by MB94 for accreting old NS, but the TC91 expectations are far off. Also, the upper limits to the NS space density obtained by ROSAT follow-up studies are consistent with the MB94 expectations, but inconsistent with TC91.
Motch et al. (1997a) also compared the curve of the unidentified sources in their deg2 area in Cygnus with the TC91 and MB94 expectations of the number density of IONS and concluded that the TC91 model seems to be excluded from the observational data, but the MB94 model may be consistent with the data.
Obviously, the large number of accreting NS expected by TC91 and MB94 are not found in the data. As discussed above (Sect. 3), the vast majority of these objects would be faint in the optical and, hence, difficult to identify optically with current technology.
The number of IONS detectable in the RASS depends crucialy on the velocity distribution of NS, in particular at the low-velocity end, because Bondi-Hoyle accretion scales with . Both TC91 and BM93 assumed the best-fit velocity distribution obtained by Narayan & Ostriker (1990), which shows a peak in their non-Maxwellian distribution at . MB94 then assumed diffuse heating of the NS population, so that the peak in their heated distribution was shifted towards higher velocities, namely to almost . More recently, Lyne & Lorimer (1994) and Lorimer et al. (1997), using many newly published proper motions and a revised distance model, have published a new velocity distribution, which is different from the one by Narayan & Ostriker (1990) in two important regards: The mean velocity is larger in the new (Maxwellian) distribution, namely , and the number of low-velocity NS is smaller. However, Hartman (1997) argues that the initial NS velocity distribution has more low-velocity NS than the distribution proposed by Lyne & Lorimer (1994), if one takes into account errors in the proper motions. Manning et al. (1996), Hansen & Phinney (1998a, 1998b), and Cordes & Chernoff (1998) also come to the conclusion that there are significantly fewer low velocity NS than assumed earlier.
Repeating the TC91 or MB94 calculations with the new velocity distribution would, however, be beyond the scope of this paper. With less NS at low velocity, one would obviously expect less accreting IONS detectable with the RASS.
In any case, the optical follow-up observations are so far limited to the brightest objects. Within the errors of the currently observed IONS density and the upper limits presented, the RASS observations are in agreement with theoretical expectations.
Acknowledgements.
We would like to thank Frank Haberl, Werner Becker, Günther Hasinger, Axel Schwope, Norbert Bade, Christian Motch, H.-C. Thomas, and Fred Walter for usefull discussion. We are also grateful to our referee, Duncan Lorimer, for several useful comments, which improved this paper. ROSAT is supported by the German government (BMBF/DLR) and the Max-Planck-Society.References
- [1] Bade N., Engels D., Voges W., et al., 1998, A&AS 127, 145
- [2] Becker W., 1995, PhD Thesis, Ludwig-Maximilians-Universität München
- [3] Becker W., Trümper, 1997, A&A 326, 682
- [4] Blaes O., Madau P., 1993, ApJ 403, 690 (BM93)
- [5] Bondi H., Hoyle F., 1944, MNRAS 104, 273
- [6] Caraveo P.A., Bignami G.F., Trümper J., 1996, A&A Rev. 7, 209
- [7] Colpi M., Campana S., Treves A., 1993, A&A 278, 161
- [8] Cordes J.M., Chernoff D.F., 1998, ApJ 505, 315
- [9] Dame T., Ungerechts H., Cohen R.S., 1987, ApJ 322, 706
- [10] Danner R., 1998a, A&AS 128, 331
- [11] Danner R., 1998b, A&AS 128, 349
- [12] David L.P., Harnden F.R., Kearns K.E., Zombeck M.V., 1996, The ROSAT High Resolution Imager calibration report. SAO technical report
- [13] Feigelson E.D., Nelson P.I., 1985, ApJ 293, 192
- [14] Friedman B.L., Pandharipande V.R., 1981, Nuclear Physics A 361, 502
- [15] Greenstein G., Hartke G.J., 1983, ApJ 271, 283
- [16] Haberl F., Motch C., Buckley D.A.H., Zickgraf F.-J., Pietsch W., 1997, A&A 326, 662
- [17] Haberl F., Motch C., Pietsch W., 1998, Astron. Nachr. 319, 97
- [18] Hansen B.M.S., Phinney E.S., 1998a, MNRAS 294, 569
- [19] Hansen B.M.S., Phinney E.S., 1998b, MNRAS 294, 557
- [20] Hartman J.W., 1997, A&A 322, 127
- [21] Hasinger G., Fischer J.-U., Schwope A., et al., 1997, Astron. Nachr. 318, 329
- [22] Isobe T., Feigelson E.D., Nelson P.I., 1986, ApJ 306, 490
- [23] Kulkarni S.R., van Kerkwijk M.H., 1998, ApJ 507, L49
- [24] Lampton M., Lieu R., Schmitt J.H.M.M., et al., 1997, ApJS 108, 545
- [25] Livio M., Xu C., Frank J., 1998, ApJ 492, 298
- [26] Lorimer D.R., Bailes M., Harrison P.A., 1997, MNRAS 289, 592
- [27] Lyne A.G., Lorimer D.R., 1994, Nature 369, 127
- [28] Lyne A.G., Manchester R.N., Lorimer D.R., et al., 1998, MNRAS 295, 743
- [29] Madau P., Blaes O., 1994, ApJ 423, 748 (MB94)
- [30] Magnani L., Blitz L., Mundy L., 1995, ApJ 295, 402
- [31] Marraco H.G., Rydgren A.E., 1981, AJ 86, 62
- [32] Mignani R.P., Caraveo P.A., Bignami G.F., 1998, A&A 332, L37
- [33] Motch C., Haberl F., 1998, A&A 333, L59
- [34] Motch C., Belloni T., Buckley D., et al., 1991, A&A 246, L24
- [35] Motch C., Guillout P., Haberl F., et al., 1997a, A&A 318, 111
- [36] Motch C., Guillout P., Haberl F., et al., 1997b, A&AS 122, 201
- [37] Narayan R., Ostriker J.P., 1990, ApJ 352, 222
- [38] Neuhäuser R., Thomas H.-C., Danner R., Peschke S., Walter F.M., 1997, A&A 318, L43
- [39] Neuhäuser R., Thomas H.-C., Walter F.M., 1998, The Messenger 92, 27
- [40] Ostriker J.P., Rees M.J., Silk J., 1970, ApJ 6, L179
- [41] Paresce F., 1984, ApJ 89, 1022
- [42] Pavlov G.G., Zavlin V.E., Trümper J.E., Neuhäuser R., 1996, ApJ 472, L33
- [43] Pfeffermann E., et al., 1988, The focal plane instrumentation of the ROSAT telescope. In: Proc. SPIE 733, 519
- [44] Schwope A.D., Hasinger G., Schwarz R., Haberl F., Schmidt M., 1999, A&A, in press
- [45] Stocke J.T., Wang Q.D., Perlman E.S., Donahue M.E., Schachter J., 1995, AJ 109, 1199
- [46] Tamman G.A., 1994, The Frequency of supernovae. In: Bludman S.A., Mochkovitch R., Zinn-Justin J. (eds.) Supernovae, Les Houches 1990, page 1
- [47] Taylor J.H., Manchester R.N., Lyne A.G., 1993, ApJS 88, 529
- [48] Thomas H.-C., Beuermann K., Reinsch K., Schwope A.D., Trümper J., Voges W., 1998, A&A 335, 467
- [49] Treves A., Colpi M., 1991, A&A 241, 107 (TC91)
- [50] Trümper J., 1982, Adv. Space Res. 2 (no. 4), 241
- [51] Umeda H., Shibazaki N., Nomoto K., Tsuruta S., 1993, ApJ 408, 186
- [52] van den Berg S., Tamman G.A., 1991, ARA&A 29, 363
- [53] Voges W., Aschenbach B., Boller Th., et al., 1996, IAUC 6420
- [54] Walter F.M., Matthews L.D., 1997, Nature 389, 358
- [55] Walter F.M., Wolk S.J., Neuhäuser R., 1996, Nature 379, 233
- [56] Zickgraf F.-J., Thiering I., Krautter J., et al., 1997, A&AS 123, 103