Institute for Astronomy, 2680 Woodlawn Drive, Honolulu, Hawaii 96822, USA
Present address: Canadian Institute for Theoretical Astrophysics, 60 St. George Street, Toronto, M5S 1A7, Canada
Detection of Filamentary X-Ray Structure in the Core of the Shapley Supercluster
Abstract
We report on X-ray observations of the core of the Shapley Supercluster. Combining data from pointed observations of the ROSAT PSPC detector and data from the ROSAT All-Sky Survey, the observed region covers an area of . It contains the central clusters A3562, A3558 and A3556.
We find clear evidence for X-ray emission connecting the three clusters. This confirms the existence of a filamentary, physical structure embedding the three clusters A3562, A3558 and A3556. We also find evidence for faint emission westwards of A3556. In total, the extension of the filamentary X-ray emission of the core of the Shapley Supercluster amounts up to at least Mpc. The total luminosity in the 0.1-2.4 keV energy band is erg s-1.
Key Words.:
S – large-scale structure of the universe – galaxies:clusters:general – X-ray:galaxies1 Introduction
The Shapley Supercluster (SSC) has for long been known as a large region of a high overdensity of galaxies (Shapley 1930). Located in in the direction of Hydra-Centaurus at it is one of the densest large scale concentrations of matter (Fabian 1991) in the Universe. If clusters of galaxies are taken as mass tracers (Scaramella et al. 1989), the Shapley concentration accounts for at least 10-20% of the acceleration of the Local Group towards the Great Attractor (Lynden-Bell et al. 1988, Scaramella et al. 1991, Drinkwater et al. 1998).
Optical (Vettolani et al. 1990, Raychaudhury et al. 1991, Bardelli et al. 1994, Quintana et al. 1997) and X-ray observations (Raychaudhury et al. 1991, Day et al. 1991, Breen et al. 1994, Bardelli et al. 1996, Ettori et al. 1997) reveal that the SSC has a remarkable structure dominated by a central high-density core. Centered on A3558 (Shapley 8) this central region of the SSC includes five Abell Clusters (A3558, A3556, A3559, A3560, A3562) and two rich groups of galaxies (SC1327-312 and SC1329-313). This corresponds to an overdensity of with respect to the average density of ACO clusters (Vettolani et al. 1990).
A comprehensive study of the mass distribution in the SSC inferred from X-ray observations has been reported by Ettori et al. (1997). Their analysis was based on a mosaic of ROSAT PSCP and Einstein Observatory IPC data enclosed in a sky area of and centered on A3558. The individual mass estimates for 14 clusters and two groups of galaxies amount to an estimated total mass of the SSC of M⊙. Assuming a CDM-like power spectrum, Ettori et al. (1997) find that the core of Shapley is an overdensity on the level of () to ().
In this letter we report on the X-ray observation of the core of the SSC by ROSAT combining pointed observations and data from the ROSAT All-Sky Survey. The region of our study is centered at ; and covers a field of . It contains the central clusters A3562, A3558 and A3556 and the two rich groups of galaxies SC1327-312 and SC1329-313. This part of the core of the SSC is of particular interest since there are strong indications (Bardelli et al. 1994) that it forms a single elongated structure on the scale of Mpc at a redshift of . Our analysis shows that the core of SSC is traced by an elongated X-ray emission on similar scale. This confirms the existence of a physically connected, filamentary structure in the core of Shapley.
2 X-Ray Observation and Analysis
While ROSAT PSPC pointed data is limited by the sky coverage, ROSAT All-Sky Survey (RASS) (Trümper 1993, Voges et al. 1996) data offers a virtually unlimited field of view. On the other hand, RASS data is limited by the short exposure time (i.e. sec vs. typical sec of PSPC pointings). As only a part of the core of the SSC is covered by pointed observations, a completion of this area by RASS data offers a possibility to combine both advantages.
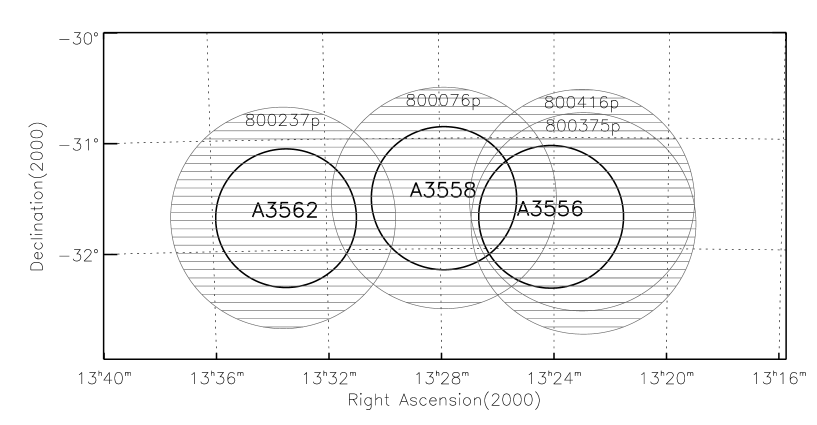
Fig. 1 shows the field of our study. The clusters A3562, A3558 and A3556 are shown as solid circles the radius of which correspond to 1 Abell radius ( Mpc). The ROSAT pointed PSPC observations covering the region are indicated by line-shaded circles of diameter each. Table 1 lists the center and total observation time for each observation.
The RASS and pointed PSPC data has been processed following the standard procedure for extended X-ray sources. In order to obtain the best signal-to-noise-ratio, only the 0.5 - 2 keV energy band (the hard ROSAT band) is used (Snowden et al. 1994). This reduces both the foreground X-ray emission of the Galactic interstellar medium and the detector background. The absorption of the X-ray emission due to neutral hydrogen in the line of sight varies only little. The neutral hydrogen column density ranges form cm-2 towards A3558 to cm-2 (A3562) and cm-2 towards A3556 (Stark et al. 1992). We adopted in the following the mean value cm-2.
3 X-ray Emission
3.1 Spatial analysis
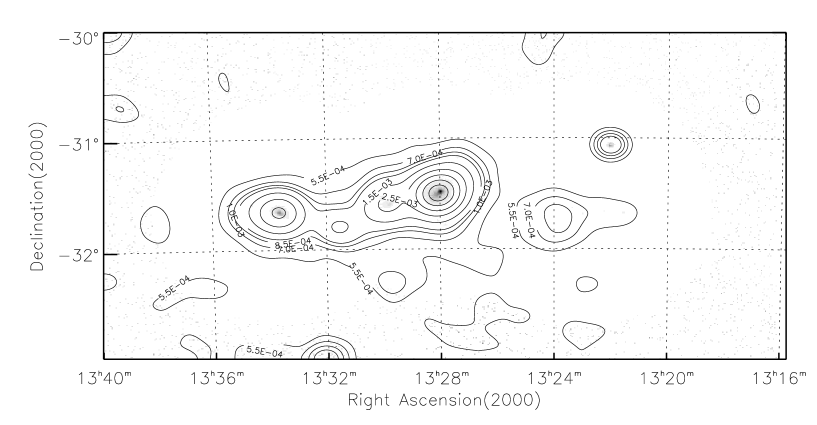
We began our analysis by merging the data of the pointed ROSAT PSPC observations. We then binned both the RASS and the pointed data into bins of size 3636 arcsec2 each and calculated the corresponding exposure maps using EXSAS. Fig. 2 presents the contour plot of the merged count rates in the ROSAT hard band (ROSAT band B, channels 52-201, 0.5-2 keV) obtained from the RASS and the pointed data. The contour plot is based on data smoothed with a Gaussian of FWMH 12 arcmin. This choice compensates for the different FWMH of the point spread functions (PSF) of pointed and RASS observations as well as for the varying PSF within the aperture of single pointings. The contour plot is overlaid on the binned flux. Due to the shorter exposure time, the region outside the pointed observations (i.e. the RASS data) exhibits a much lower signal-to-noise ratio resulting in a patchy appearance. The figure shows an overall picture of the region. Neither the background nor point sources have been subtracted.
Local maxima of the count rate clearly trace the clusters A3562, A3558 and A3556 as well as the two groups SC1327-312 and SC1329-313. Note also the region in the vicinity of A3556. The peak of the count rate centered on A3556 is surrounded by faint X-ray emission with an extension of about in the east-west direction and in the north-south direction. We have checked for X-ray sources in this region. Clearly visible is the point source 1RXS J132129.4-314054 of the ROSAT All-Sky Survey bright source catalogue. Its position roughly coincidents with the western edge of the emission around A3556. There are about five other point-like sources in this field, presumably associated with emission of single galaxies (c.f. section 4). In analogy with a more comprehensive study of the X-ray emission of A3558 (Bardelli et al. 1996), we find the point-like sources to contribute to the observed count rate.
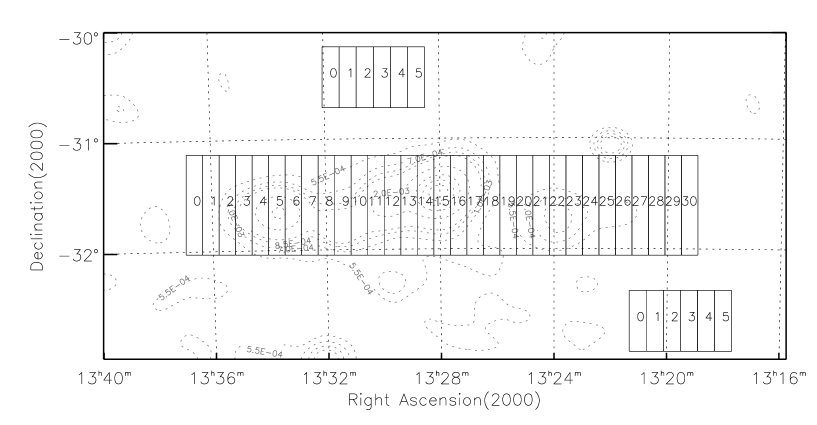
To check the significance of the elongated emission, we rebinned the central region into 31 bins as shown in Fig. 3. The count rates in the various bins as obtained from the unfiltered data is plotted in Fig. 4. The error bars are the (Poisson) errors. The background shown as dotted line ( cts sec-1 arcmin-2) is estimated from the average of the six bins with lowest flux. Its value is in good agreement with the background estimated from the smaller northern and south-western fields ( and cts sec-1 arcmin-2, respectively). Since the emission found for the background bins shows some structure, we quote here conservative Gaussian errors. While the region used for the first background estimation is covered by pointed observations, the two other fields lie mostly within the area of the RASS. Because of the poor photon statistics, the data from these two fields has not been included in the subsequent analysis.
The peaks of the flux seen in Fig. 3 are clearly associated with the clusters and rich groups in the field. From Fig. 4 it is also seen that the emission between the clusters A3556 and A3558 lies well above the background. Thus the X-ray emission traces the the core of the SSC as a filamentary-like structure with an extension of corresponding to Mpc.
As a final test we checked for the effect of different bin sizes and applied the same analysis to the ROSAT A band (channels 11-41, 0.1-0.4 keV), C band (channels 52-90 0.5-0.9 keV) and D band (channels 91-201 0.9-2 keV). While no corresponding emission could be found in the A band, the emission observed in the C and D band traces the same structure. Therefore we can exclude any contamination by galactic foreground emission miming the elongated emission.
Table 2 shows background subtracted fluxes and luminosities for various combinations of bins. For the conversion of the count rates in the ROSAT 0.5-2.0 keV band to the flux and luminosity in the 0.1-2.4 keV band we used a Raymond-Smith code with metallicity 0.35 (solar units). Where available, the plasma temperature for the different regions has been taken from the literature. The plasma temperature of SC1327-312 is estimated to be equal to SC1329-313. For the faint emission between the clusters A3558 and A3556 as well as for the elongated emission in the vicinity of A3556 we assumed a plasma temperature of 1 keV, corresponding roughly to the temperature expected for (poor) groups of galaxies or for faint filamentary emission (c.f. also section 4).
The (background subtracted) flux and luminosity obtained for A3558 (i.e. bins 13-17) are in good agreement with the corresponding values erg cm-2 s-1 and erg s-1 (rescaled to the energy range 0.1-2.4 keV) published by Bardelli et al. (1996). Note however, that the values given in Table 2 are of limited relevance since the binning used only crudely reflects the actual spatial structure of the different sources. In analogy, the total flux and luminosity found for the whole structure by summing up the respective values for the bins 3-27 has to be considered as a lower limit.
The combination of flux and temperature data with a spatial model for the emitting region allows for an estimation of the electron density and gas mass in the respective region. In order to get upper limits, we assume here the emitting gas to be uniformly distributed in a cylinder whose projection corresponds to the binned region (i.e. the axis of the cylinder is perpendicular to the line of sight). The volume of a bin then is Mpc3. The resulting electron density and gas mass estimations are quoted in Table 2. Note that the approximation we applied overestimates the actual values since it assumes uniform distributions of the flux and emitting gas. Thus the quoted values have to be considered as upper limits. The value we find for A3558 (i.e. bins 13-17) is in rough agreement with within Mpc calculated by Bardelli et al. (1996). Extrapolating to the whole structure, we find as an estimation of the total gas mass . An more precise determination of the gas mass as well as the estimation of the total mass should involve a more accurate model of both the gas and the flux distribution.
3.2 Spectral analysis
Based on ROSAT data, Bardelli et al. (1998) performed a comprehensive analysis of spectral properties of the emission of the central cluster A3558 (for a comparison with ASCA data see Markevitch & Vikhlinin 1997). Because of comparable exposure times of A3558 and the rest of the region covered by pointed PSPC observations, a corresponding analysis of the whole elongated emission should be possible. However this is beyond the scope of this letter. As a first step towards a spectral analysis of the region we determine here the hardness ratio (i.e. X-ray color) related to the ROSAT C and D energy band
| (1) |
where and denote the flux in the ROSAT bands C and D, respectively.
In Fig. 5 the hardness ratio of the background corrected flux is shown as a function of the bin number. The errors are the errors. As it is the case for the flux, the hardness ratio traces the structure of the core of Shapely. A clearly higher hardness ratio is found for the emission of clusters and groups than for intermediate, connecting emission. This is evidence for higher gas temperatures associated with density peaks, i.e. a result one would expect. For temperatures between 2 and 10 keV, and a neutral hydrogen column density of cm-2 the theoretical values for the hardness ratio range form 0.33 to 0.355. These values are in rough agreement with the hardness ratio found for the clusters and groups in the field. The corresponding hardness ratio of the background (i.e. the hardness ratio of six bins with lowest flux) is -0.22.
For a gas temperature of 1 keV, the theoretical value for the hardness ratio is . As is clear form Fig. 5, the hardness ratio between A3556 and A3558 lies bellow this value, indicating a temperature bellow 1 keV. The oscillating behavior of the hardness ratio westwards of A3556 (i.e. for bins ) is due to the background subtraction procedure. By subtracting the average flux of the six bins with lowest flux, the background corrected net flux in some of these bins may become negative giving rise to observed oscillatory feature.
4 Discussion
The analysis of the ROSAT RASS and pointed data of the core of the SSC shows clear evidence for X-ray emission related to a filamentary superstructure. Optical observations (Bardelli et al. 1994, 1998) reveal a striking similarity of isodensity contour lines of galaxy counts and X-ray contours. This strongly suggests a tight connection between the galaxy distribution and the X-ray emission. It is intriguing that galaxy counts and X-ray emission not only correlate on the scale of the single clusters in the field but also on the scale of the whole filamentary structure, including the region of faint emission between A3558 and A3556 and westwards of A3556.
The angular and redshift distribution of galaxies in this field provides strong evidence for a filamentary superstructure connecting the clusters A3562, A3558 and A3556 (Bardelli et al. 1994). We thus conclude the elongated X-ray emission of the core of the SSC to trace this filamentary superstructure.
In principle the elongated X-ray emission could arise from projection effects. However, there is little doubt that this isn’t the case. First of all, redshift measurements indicate the structure to lie perpendicular to the line of sight which excludes projection effects. Additional evidence comes from the flat, elongated X-ray emission of A3556 which is not comparable to the X-ray emission of compact, isolated clusters.
It is interesting to note that there is additional independent evidence for an elongated gas distribution westwards of A3556. The radio survey of A3556 (Venturi et al. 1997) reveals a wide-angle tailed (WAT) radio galaxy at a distance of Mpc westwards from the center of A3556. Normally, WAT galaxies are found at the center of groups or clusters and it is assumed that the tails are bent by gas flows due to a merging processes (Gomez et al. 1997). The original suggestion of Venturi et al. (1997) that the bent morphology of the WAT galaxy is due to interaction with surrounding relatively cold gas (i.e. keV) is confirmed by the present study.
X-ray emission from filamentary large scale structures is predicted by models (e.g. Bond et al. 1996) and recent N-body/hydro simulations (e.g. Cen & Ostriker 1996) of structure formation. It is expected to originate from the hot phase of the intergalactic medium (IGM) of temperature keV, either found in association with filaments themselves or with single cD galaxies or groups of galaxies tracing the structure. There have been only few claims of detection of X-ray emission on scales extending the scale of clusters of galaxies (i.e. Wang et al. 1997, Soltan et al. 1997, but see also Briel & Henry 1995). The fact that the present study found clear evidence for X-ray emission on the scale of Mpc is reconciled by the extraordinary dense nature of the core of Shapley.
While the emission centered on the clusters A3558, A3562 and A3556 as well as the one centered on the poor groups SC1329-313 and SC1327-312 is due to hot intercluster medium, the nature of the fainter emission connecting the whole structure is less obvious. To some extent, it remains debatable if the X-ray emission connecting the clusters A3558 and A3556 originates from poor groups of galaxies, from IGM distributed between the clusters or from overlapping gas distributions. In general, the X-ray luminosity of groups of galaxies in the 0.1-2.4 keV band is typically erg s-1 (Henry et al. 1995, Mulchaey et al. 1996). Comparing this value to the X-ray luminosity found in the bins 18-20 leads to groups in this region, a number which seems rather high. In addition, at least compact groups should be resolved as individual sources. We thus exclude this possibility.
Likewise, the background subtracted X-ray surface brightness of the bins 18-20 is erg cm-2 s-1 arcmin-2 (in the 0.1-2.4 keV energy band) corresponding to about 2.5 times the upper limit for emission from filamentary large scale structure (Briel and Henry, 1995). While the extraordinary dense nature of the region could explain this difference, the overall elongated structure may also suggest that the emission seen in the bins 18-20 is due to overlapping gas distributions of A3558 and A3556. In this case, the low hardness ratio of the intermediate region could be due to a temperature decrease in the outskirts of the clusters. Yet another possibility is that we are observing the beginning of the merging of A3558 and A3556.
A more definite answer to this question should involve the determination of the temperature distribution. If the low temperature (i.e. keV) assumed for the gas in the bins 18-20 is confirmed, this would be a strong indication for X-ray emission originating from IGM distributed on intrasupercluster scale. The low hardness ratio obtained for the questionable bins as well as the fact that we are dealing with an overall exceptional dense region indicates that this actually may be the case.
5 Conclusions
In summary, our analysis shows that the central part of the Shapley Supercluster is traced by elongated X-ray emission connecting the three clusters of galaxies A3562, A3558, A3556 and the two groups SC1327, SC1329. The filamentary-like X-ray emission extends over corresponding to Mpc. This is strong evidence for the original claim of Bardelli et al. (1994) that the three clusters A3562, A3558 and A3556 form a physically connected, single structure.
While the emission between A3558 and A3556 seems not to originate from groups of galaxies it remains debatable if it is due to overlapping gas distributions of A3558 and A3556 or if its of intrasupercluster origin. A more definite answer to this question as well as to questions related to the dynamical state of the structure could be provided by the temperature distribution of the region. Its determination is thus of great interest.
Acknowledgements.
It is a pleasure to thank Lev Kofman, Pat Henry and Sandro Bardelli for valuable discussions. Part of the work of A.K. has been supported by the Swiss National Foundation, grant 81AN-052101.References
- (1) Bardelli S., Zucca E., Vettolani G., Zamorani G., Scarmella R., Scaramella R., Collins C. A., MacGillivray T., 1994, MNRAS, 267, 665
- (2) Bardelli S., Zucca E., Malizia A., Zamorani G., Scarmella R., Vettolani G. 1996, A&A, 305, 435
- (3) Bardelli, S., Zucca, E., Zamorani, G., Vettolani, G., & Scaramella, R. 1998, MNRAS, 296, 599
- (4) Bond J. R., Kofman L., Pogosyan D., 1996, Nature, 380, 603
- (5) Breen J., Raychaudhury S., Forman W., Jones C., 1994, ApJ, 424, 59
- (6) Briel U. G., Henry J. P. 1995, A&A, 302, L9
- (7) Cen R., Ostriker J. P., 1996, ApJ, 464, 27O
- (8) Dickey J. M., Lockman F. J., 1990, ARA&A, 28 ,215
- (9) Drinkwater, M.J., Parker, Q. A., Proust, D., Quintana, H., Slezak, E. 1998, astro-ph 9807118
- (10) Day C. S. R., Fabian A. C., Edge A. C., Raychaudhury S., 1991, 252, 394
- (11) Fabian A. C., 1991, MNRAS, 253, 29
- (12) Gomez P. L., Pinkney J., Burns J. O., Wang Q., Owen F. N., & Voges W. 1997, ApJ, 474, 580
- (13) Henry J. P., et al. 1995, ApJ, 449, 422
- (14) Lynden-Bell D., Faber S. M., Burstein D., Davies R. L., Dressler A., Terlevich R. J., & Wegner G. 1988, ApJ, 326, 19
- (15) Ettori S., Fabian A. C., White D. A. 1997, MNRAS, 289, 787
- (16) Markevitch M., Vikhlinin A. 1997, ApJ, 474, 84
- (17) Mulchaey J. S., Davis D. S., Mushotzky R. F., Burstein D. 1996, ApJ, 456, 80
- (18) Postman M., Lauer T. R., 1995, ApJ 440, 28
- (19) Quintana H., Melnick J., Proust D., Infante L., 1997, A&AS, 125, 247
- (20) Raychaudhury S., Fabian A. C., Edge A. C., Jones, C., Forman W., 1991, MNRAS, 248, 101
- (21) Shapley H., 1930, Harvard Obs. Bull. 874, 9
- (22) Snowden S. C., McGammon D., Burrows D. N., Mendenhall J. A., 1994, ApJ, 424, 714
- (23) Scaramella R., Baiesi-Pillastrini G., Chincarini G., Vettolani G., Zamorani G., 1989, Natur, 338, 562
- (24) Soltan, A. M., Hasinger, G., Egger, R., Snowden, S., & Trümper, J., 1997, A&A, 320, 705
- (25) Trümper, J. 1993, Science, 260, 1769
- (26) Venturi, T., Bardelli, S., Morganti, R., & Hunstead, R. W. 1997, MNRAS, 285, 898
- (27) Vettolani G., Chingarini G., Scaramella R., Zamorani G., 1990, AJ 99, 1709
- (28) Voges, W., et al. 1996, MPE Report 263, 637
- (29) Wang Q. D., Connolly A. J., Brunner, R. J. 1997, ApJ, 487, L13
- (30) White D. A., Jones C., Forman W. 1997, MNRAS, 292, 419
-
a
refers to the energy band [0.5-2.0 keV]
-
b
refers to the energy band [0.1-2.4 keV]
-
c
is taken from the compilation of White et al. (1997)
-
d
estimation for (see text)