Properties of Candidate Cluster Galaxies at =1–2
Abstract
I discuss the properties of a population of candidate cluster galaxies recently identified in the fields of radio-loud quasars at =1–2. The magnitude, spatial, and color distributions of the excess galaxies in these fields are consistent with the quasars residing in moderately rich galaxy overdensities dominated by early-type galaxies. The broadband SEDs of very red galaxies in several fields suggest that there is considerable dispersion in the properties of early-type galaxies in these clusters at 1.5. Most excess galaxies are best fit as 2–3 Gyr old ellipticals, but some are either 4–5 Gyr old or considerably more metal-rich, and others must be extremely dusty. The latter are part of a “-band dropout” population which includes a number of galaxies in one field which are probably at 2.5, background to the quasar. Finally, I discuss narrowband redshifted H imaging in two fields which has yielded at least one detection. At 1.3 cluster galaxy star formation rates can be measured from H in the near-IR, rest-frame 1500Å light in the optical, and eventually rest-frame far-IR emission using SCUBA, to help determine the star formation histories of cluster galaxies as function of redshift.
1 Introduction
Studies of early-type cluster galaxies out to 1 have shown that the vast majority are relatively old and red at all 1, implying formation redshifts for their dominant stellar populations of at least 2.5, and probably 4 (Bower et al. (1998)). Hierarchical clustering models predict that some star formation (mostly merger-induced) in these galaxies continues down to at least 1 (Kauffmann (1996)). In contrast, monolithic collapse models predict a star formation epoch of shorter duration due to expulsion of the ISM by supernovae (Arimoto & Yoshii (1987)). One way to test these somewhat competitive models is to study the properties of 1 cluster galaxies, especially early-types; e.g. their spectral energy distributions, star formation rates, etc.
Combined optical and near-IR imaging can easily identify 1 clusters (although spectroscopic confirmation is difficult). However, clusters of galaxies are rare objects and wide-field deep near-IR imaging surveys are only now becoming feasible. Another way to find 1 clusters efficiently is to target fields where there is some reason to believe a cluster exists, such as the presence of X-ray emission (Rosati (1998)), quasar absorption line overdensities (Francis, Woodgate & Danks (1997)), or a known high-redshift object (e.g. a radio galaxy, Dickinson (1996)). This talk highlights results from a survey around radio-loud quasars (RLQs). We targeted RLQs because at lower redshift they are known to often reside in clusters (Yee & Ellingson (1993)), unlike radio-quiet quasars.
2 Candidate Clusters around =1–2 Radio-Loud Quasars
Hall, Green & Cohen (1998) and Hall & Green (1998) describe and analyze an and imaging survey of 31 RLQs at =1–2. The evidence for clusters around these RLQs is as follows:
There is an excess of 18.5 galaxies in these fields above the average published literature counts (Fig. 1a). The excess is significant even when the relatively large field-to-field scatter in band counts (due to the stronger clustering of red galaxies) is taken into account.


There are two spatial components to the excess (Fig. 1b). The first is a near-field excess within 40′′ of the quasars relative to our own data at 40′′. The second is a far-field excess relative to random-field counts from the literature which extends to at least 100′′. The near-field excess is present in 25% of the fields, and the far-field excess in 50%. The amplitude of the near-field excess is insufficient to explain the excess band counts, so we believe the far-field excess is real.
The color distribution of faint galaxies in these RLQ fields is significantly redder than in random fields (Fig. 2). The excess galaxies essentially all have 4, redder than evolutionary synthesis models of galaxy types Sa and later at any =0–3 (Poggianti (1997)). The ‘typical’ excess galaxy color is 5.5, redder than the Poggianti (1997) model ellipticals (Es) at any =0–3. This is because these model Es have exponentially declining star formation rates (SFRs) with 1 Gyr; models with faster declining SFRs match the observed colors better (e.g. 1 Gyr burst model Es can have 5.5 at 0.9). Thus, the color distribution of the excess galaxies is consistent with a population of predominantly early-type galaxies at 0.9.

The excess is uncorrelated with the presence of intervening Mg ii absorption at 0.9.
In summary, the magnitude, spatial, and color distributions of the excess galaxy population in these RLQ fields are all consistent with the excess being produced by overdensities of galaxies at the quasar redshifts. Roughly speaking, the amplitude of the near-field excess corresponds to Abell richness class 01 clusters (where 1 denotes the richness of the field), and the far-field excess to Abell richness 1.51.5. This is consistent with RLQs often being located in large-scale galaxy overdensities and occasionally in small-scale “condensations” within them. However, the richness measurements should be interpreted cautiously, as one galaxy at =0 may typically correspond to several galaxies at 1.5 due to mergers between then and now (Steinmetz (1997)).
3 Properties of Candidate Cluster Galaxies at =1.5


We do not yet have spectroscopy for these candidate cluster galaxies which would enable detailed study of their properties, as well as confirm the reality of the clusters. However, we have imaging data in multiple bands for several fields, notably Q 0835+580 (3C 205) and Q 1126+101 (both at 1.5; color pictures available at http://www.astro.utoronto.ca/hall/thesis.html). If we assume that the bulk of the excess galaxies are at the quasar redshifts, from these data we can place interesting constraints on the star formation histories of cluster galaxies at 1.5.
There is a distinct clump of galaxies within 20′′ of 3C 205. The / color-magnitude diagram of these galaxies (Fig. 3a) hints at a red sequence with 2.8. The uncertainties on the colors are large due to the optical faintness of the galaxies, but there are two galaxies significantly redder than the others. In Fig. 4a, the spectral energy distributions (SEDs) of these galaxies are compared to that of M32, whose youngest stellar population is believed to be 4–5 Gyr old (Spinrad et al. (1997)). The match is excellent; these galaxies are in fact redder (and thus possibly older) than the =1.552 mJy radio source LBDS 53W091, which may be old enough to significantly constrain the cosmological model given the large lookback time to =1.5 (Spinrad et al. (1997)). Dust cannot explain the redness of these objects due to the strong break at 1m observed (Fig. 4b), consistent with the 4000Å break at the quasar =1.5358. (3C 205 does have two intervening Mg ii systems at 1.437, but at least the fainter of these two extremely red galaxies — an -band dropout — is likely to be at the quasar instead of the Mg ii , since it is positionally coincident with the compact radio hot spot which terminates one of the quasar’s radio jets; cf. Lonsdale & Barthel (1998).) In Fig. 5a the same SEDs are compared to Bruzual & Charlot (1996) GISSEL 1-Gyr-long burst model ellipticals and to a 3.4 Gyr old Poggianti (1997) model elliptical (all with solar metallicity). The =1 Gyr exponentially declining SFR of the Poggianti model is bluer than the data, and remains bluer even when 5.9 Gyr old (not shown), whereas a 6 Gyr old GISSEL model is a good fit. Thus models with 1 Gyr exponentially declining SFRs are strongly disfavored for at least the reddest candidate cluster ellipticals. Fig. 5b plots the average SED of the seven next reddest galaxies near 3C 205 (the putative red sequence in Fig. 3a). 2–3 Gyr GISSEL models can match the data (with a bit of later star formation to explain the fluxes) as can a 4.3 Gyr old Poggianti E (not shown). The difference in color between these candidate early-type cluster galaxies implies a difference in age of 2–3 Gyr or in metallicity of 0.2 dex. If real, this large scatter must be erased at later times through merging to explain the small scatter seen in the red sequence at lower .


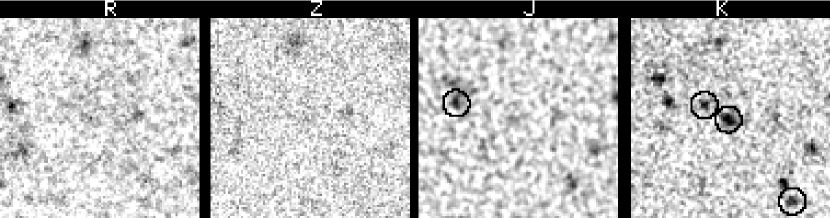


There is no dramatic clump of galaxies around Q 1126+101, but galaxies with and colors similar to those in the 3C 205 clump show a possible red sequence in this field as well, though it is less obvious (Fig. 3b). Again, there are several galaxies much redder than the putative red sequence, and some of these are -band dropouts consistent with 4–5 Gyr old galaxies at the quasar redshift (=1.5173). However, there are many more objects with very red colors in this field, and many of these objects have very red colors as well (Fig. 6). We denote objects with 2.5 as -band dropouts (Fig. 7); typically they are - and -band dropouts as well, although some are detected in . Some of these objects show a strong break only between and (Fig. 8a); they are best explained as moderately dusty galaxies background to the quasar. Others show strong breaks between and and and (Fig. 8b); they are best explained as extremely dusty galaxies at the quasar redshift. Some of these latter objects are redder in than the prototypical dusty starburst HR10 at =1.44 (Graham & Dey (1996)), whose colors must be due to dust rather than age for any reasonable cosmology. The surface density of -band dropouts with 25.5 is 2.80/□′ in the Q 1126+101 field, 1.29/□′ in our other fields, and 0.46/□′ in several field surveys. These surface densities and SED fits suggest that about half these objects are at the quasar redshifts and half are background to the quasars.
The existence of -dropouts which are probably at 2.5 has important implications for any census of galaxy populations at high redshift. Galaxies at =2.5–6 are now routinely identified via their redshifted far-UV Lyman breaks, but such galaxies must have considerable rest-frame far-UV flux to be found this way. As pointed out by Francis et al. (1997), since both dust and age can reduce a galaxy’s UV flux, there may be a population of 2.5 galaxies which are undetectable via the Lyman-break technique, particularly since even rest-frame UV-selected galaxies can be dusty (Sawicki & Yee (1998)). Francis et al. (1997) have in fact spectroscopically confirmed three galaxies at =2.38, selected via absorption lines in nearby background quasars, whose red colors require ages 2 Gyr or dust reddenings 0.5. These and other red galaxies nearby have similar bolometric luminosities to UV-selected objects, and along with the objects in our fields they may constitute a population of previously overlooked dusty and/or old galaxies at 2.5.
The dispersion in SED fits to candidate cluster galaxies, probably early type galaxies for the most part, implies a dispersion in their star formation histories. A similar result has been found for another candidate quasar host cluster at =1.1 (Yamada et al. (1998)). Most candidate cluster galaxies have little ongoing star formation, but a few objects must be significantly older or more metal-rich than the others. Some objects must be very dusty; if at the quasar they are best fit by an actively star-forming population plus a 2 Gyr old component.
4 H Emission in Two Candidate Clusters at =1.5

The NASA Infra-Red Telescope Facility’s NSFCAM instrument has a circularly variable filter which can be tuned to redshifted H at =1.3–2.83. In October 1997 we imaged two 1.5 candidate cluster fields to search for H emission. The field of view is only 1□′ in each cluster, but in the 3C 205 field we detected one galaxy at 6 (Fig. 9). The galaxy’s faint magnitude (=20.1), blue and reddish colors are consistent with it being at the quasar redshift, in which case its inferred SFRHα is 14.73.7 /yr (=75 km s-1 Mpc-1, =0.2, =0). (Note that most strong emission lines are blueward of H, so if the excess narrowband emission is not caused by H the object is likely at 1.5.) We have also obtained band imaging of this field to sample rest-frame 1500Å light from galaxies at the quasar redshift. The candidate H emitter has =23.0, corresponding to SFRFUV=5.6 /yr uncorrected for dust. Thus there is relatively good agreement between SFRHα and SFRFUV. H and -band observations of more cluster fields will determine current SFRs and limits for more cluster galaxies at 1.3. We have also proposed to map several fields with SCUBA to determine SFRFIR and to see if the recently discovered field population of sub-mm-luminous galaxies (Smail et al. (1998)) also exists in 1.5 clusters.
5 Summary
Optical/near-IR imaging of radio-loud quasars at =1–2 has revealed evidence for overdensities of red galaxies at the quasar redshifts. Qualitative SED fitting to broadband imaging data in multiple bandpasses yields interesting possible constraints on the star formation histories and current star formation rates of these candidate 1 early-type cluster galaxies. (These are being put on a more quantitative footing via calculation of photometric redshifts and formal constraints on age, reddening, etc., in collaboration with M. Sawicki; cf. Sawicki & Yee 1998.) The dispersion in SED fits suggests that some of these galaxies are significantly older or more metal-rich than the majority, and that some are very dusty and probably have considerable ongoing star formation given their L∗ luminosities. This dispersion is generally consistent with the late stages of a hierarchical merger-induced star formation epoch in early-type galaxies in these clusters; however, extended star formation histories are not favored for the reddest such galaxies at least. There are also a number of very red galaxies which are best fit as background galaxies at 2.5; these may be part of a population of previously overlooked dusty and/or old high-redshift galaxies. Lastly, we have also detected redshifted H emission from at least one candidate cluster galaxy.
Spectroscopic confirmation of these objects’ redshifts is a job for 8-m class telescopes, but multislit IR spectroscopy on 4-m telescopes is feasible for the brightest red objects, and we have been granted time for this on CFHT with OSIS-IR. Verifying that there is a large scatter in age and/or metallicity among early-type galaxies in clusters at 1 will require redshifts and spectral types for the candidate early-type galaxies, as well as morphologies from proposed deep WFPC2 imaging or near-IR adaptive optics observations. Multi-wavelength observations can be used to constrain SFRs in cluster galaxies at 1.3 three different ways: via H in the IR, via rest-frame far-UV in the optical, and via the rest-frame far-IR with SCUBA. These various observations should eventually enable us to determine the star formation histories of all types of cluster galaxies at 1 and the relative importance of hierarchical merging and monolithic collapses.
Acknowledgements.
I thank the organizers of the 13th Kingston Meeting on Theoretical Astrophysics: “Galaxy Formation and Cosmic Star Formation History” for financial support.References
- Arimoto & Yoshii (1987)
- (2) Arimoto, N., & Yoshii, Y. 1987, A&A, 173, 23
- Bica et al. (1996)
- (4) Bica, E., Alloin, D., Bonatto, C., Pastoriza, M. G., Jablonka, P., Schmidt, A., and Schmitt, H. R. 1996, in “A Data Base for Galaxy Evolution Modeling,” eds. C. Leitherer et al., PASP, 108, 996
- Bower et al. (1998)
- (6) Bower, R. G., Terlevich, A., Kodama, T., and Caldwell, N. 1998, to appear in “Star Formation in Early-Type Galaxies,” eds. P. Carral and J. Cepa (astro-ph/9808325)
- Bruzual & Charlot (1996)
- (8) Bruzual A., G., and Charlot, S. 1996, in “A Data Base for Galaxy Evolution Modeling,” eds. C. Leitherer et al., PASP, 108, 996
- Calzetti (1997)
- (10) Calzetti, D. 1997, to appear in “The Ultraviolet Universe at Low and High Redshift,” eds. W. H. Waller, M. N. Fanelli, and A. C. Danks (AIP: New York) (astro-ph/9706121)
- Dickinson (1996)
- (12) Dickinson, M. 1996, in “The Early Universe with the VLT,” ed. J. Bergeron (Springer-Verlag: Berlin), 274
- Dickinson et al. (1998)
- (14) Dickinson et al. 1998, in preparation
- Elston, Eisenhardt & Stanford (1998)
- (16) Elston, R., Eisenhardt, P., and Stanford, S. A. 1998, in preparation
- Francis, Woodgate & Danks (1997)
- (18) Francis, P. J., Woodgate, B. E., and Danks, A. C. 1997, ApJ, 482, L25
- Gehrels (1986)
- (20) Gehrels, N. 1986, ApJ, 303, 336
- Graham & Dey (1996)
- (22) Graham, J. P., and Dey, A. 1996, ApJ, 471, 720
- Hall, Green & Cohen (1998)
- (24) Hall, P. B., Cohen, M., and Green, R. F. 1998, ApJS, 119, 1 (astro-ph/9806145)
- Hall & Green (1998)
- (26) Hall, P. B., and Green, R. F. 1998, ApJ, 507, 558 (astro-ph/9806151)
- Kauffmann (1996)
- (28) Kauffmann, G. 1996, MNRAS, 281, 487 (astro-ph/9502096)
- Lonsdale & Barthel (1998)
- (30) Lonsdale, C. J., and Barthel, P. D. 1998, AJ, 115, 895
- McLeod et al. (1995)
- (32) McLeod, B. A., Bernstein, G. M., Rieke, M. J., Tollestrup, E. V., and Fazio, G. G. 1995, ApJS, 96, 117
- Poggianti (1997)
- (34) Poggianti, B. M. 1997, A&AS, 122, 399
- Rosati (1998)
- (36) Rosati, P., to appear in “Wide Field Surveys in Cosmology”, eds. S. Colombi and Y. Mellier (Gif-sur-Yvette: Editions Frontieres) (astro-ph/9810054)
- Sawicki & Yee (1998)
- (38) Sawicki, M., and Yee, H. K. C. 1998, AJ, 115, 1329 (astro-ph/9712216)
- Smail et al. (1998)
- (40) Smail, I., Ivison, R., Blain, A, & Kneib, J.-P. 1998, to appear in the proceedings of “After the dark ages: when galaxies were young (the universe at 25)” (astro-ph/9810281)
- Spinrad et al. (1997)
- (42) Spinrad, H., Dey, A., Stern, D., Dunlop, J., Peacock, J., Jimenez, R., & Windhorst, R. 1997, ApJ, 484, 581
- Steinmetz (1997)
- (44) Steinmetz, M. 1997, to appear in “Structure and Evolution of the IGM From QSO Absorption Line Systems”, eds. P. Petitjean and S. Charlot (Nouvelles Frontieres: Paris) (astro-ph/9709260)
- Yamada et al. (1998)
- (46) Yamada, T., et al. 1998, in The Young Universe, eds. S. D’Odorico et al. (ASP: San Francisco), 526
- Yee & Ellingson (1993)
- (48) Yee, H. K. C., and Ellingson, E., 1993, ApJ, 411, 43