SPECTRAL ENERGY DISTRIBUTIONS OF PASSIVE T TAURI DISKS: INCLINATION
Abstract
We compute spectral energy distributions (SEDs) for passive T Tauri disks viewed at arbitrary inclinations. Semi-analytic models of disks in radiative and hydrostatic equilibrium are employed. Over viewing angles for which the flared disk does not occult the central star, the SED varies negligibly with inclination. For such aspects, the SED shortward of 80 is particularly insensitive to orientation, since short wavelength disk emission is dominated by superheated surface layers which are optically thin. The SED of a nearly edge-on disk is that of a class I source. The outer disk occults inner disk regions, and emission shortward of 30 is dramatically extinguished. Spectral features from dust grains may appear in absorption. However, millimeter wavelength fluxes decrease by at most a factor of 2 from face-on to edge-on orientations.
We present illustrative applications of our SED models. The class I source 04108+2803B is considered a T Tauri star hidden from view by an inclined circumstellar disk. Fits to its observed SED yield model-dependent values for the disk mass of 0.015 and a disk inclination of 65∘ relative to face-on. The class II source GM Aur represents a T Tauri star unobscured by its circumstellar disk. Fitted parameters include a disk mass of 0.050 and an inclination of .
1 INTRODUCTION
Excess infrared (IR) emission from T Tauri stars is thought to originate from circumstellar disks (Mendoza 1968; Shu, Adams, & Lizano 1987; and references therein). Passive disks are the simplest to consider. By definition, they lack intrinsic luminosity and reradiate the energy they absorb from the central star.
Hydrostatic, radiative equilibrium models for passive T Tauri disks are derived by Chiang & Goldreich (1997, hereafter CG). The disk surface flares outward with increasing radius and intercepts more stellar radiation, especially at large distances from the central star, than a flat disk would (Kenyon & Hartmann 1987). An optically thin layer of superheated dust grains ensheaths the entire disk. Dust grains in this surface layer are directly exposed to central starlight and reradiate to space about half the stellar energy they absorb. The other half is emitted towards the midplane and regulates the temperature of the cooler disk interior. Vertical temperature gradients in externally illuminated disk atmospheres are calculated in detail by Calvet et al. (1991), Malbet & Bertout (1991), and D’Alessio et al. (1998).
CG compute spectral energy distributions (SEDs) of passive disks viewed face-on. The calculated SED is fairly constant over the thermal IR, in accord with the observed flattish excesses of T Tauri stars such as GM Aur. Spectral features from dust grains in the superheated layer appear in emission when the disk is viewed face-on, similar to solid-state emission lines evinced by T Tauri stars and Herbig Ae/Be stars (Cohen & Witteborn 1985; Waelkens et al. 1996; Waters & Waelkens 1998).
What is the spectrum of a passive disk whose midplane is inclined at an arbitrary angle, , to the plane of the sky? In §2, model assumptions and results pertaining to the continuum SED are set forth. In §3, we study how spectral signatures of some dust grain resonances change from emission to absorption as the disk is viewed increasingly edge-on. Applications to observations are contained in §4. There, we assess the possibility that the relatively low 12 flux of GM Aur might be caused by a non-zero disk inclination, as opposed to a central AU-sized gap. We close by considering whether differences between class I and class II SEDs might reflect differences in viewing angle rather than evolutionary status.111In the classification scheme of Lada & Wilking (1984; see also Lada 1987), class I sources exhibit SEDs which rise from 2 to 10, i.e., where . For class II sources, .
2 INCLINATION DEPENDENCE OF CONTINUUM SED
2.1 Model Assumptions
We consider a passive disk in radiative and hydrostatic balance around a T Tauri star. The model employed is identical to that derived in §2.1 and §2.3 of CG. Symbols and values of free parameters are listed here in Table 1, and henceforth are used without explanation. We measure position by cylindrical radius, , and vertical distance above the disk midplane, .222The disk radius in astronomical units is denoted by .
| Symbol | Meaning | Value |
|---|---|---|
| Stellar Mass | ||
| Stellar Radius | ||
| Stellar Effective Temperature | ||
| Disk Surface Density | ||
| Inner Disk Radius | ||
| Outer Disk Radius | ||
| Dust Opacity at Visual WavelengthsaaAbsorption by dust grains is assumed to dominate the continuum opacity from visible through millimeter wavelengths. | ||
| Grain Emissivity | ||
| Grain Radius | ||
| Grain Emissivity Index | 1 | |
Derived disk properties relevant to our present investigation are summarized as follows. At each radius we distinguish two regions: the superthermal surface layer which is directly exposed to light from the central star, and the cooler, diffusively heated interior which the surface encases. Variables evaluated in the former region are denoted by a subscript , while those in the latter region carry a subscript . Pertinent results from CG include the dust temperature at the surface
| (1) |
and the gas density in the interior
| (2) |
Both the gas scale height, , and interior temperature, , take on different forms depending on the vertical optical depth of the interior. Inside 84, the interior is opaque to its own reprocessed radiation, and
| (3a) | |||
| (3b) |
Between 84 and 209 , the interior is optically thin to its own radiation but still thick to radiation from the surface; here
| (3c) |
| (3d) |
Finally, in the outermost regions of the disk, the encased material is transparent to radiation from the surface, and
| (3e) |
| (3f) |
Boundary conditions are as follows. The superheated layer is located at . Its visual optical depth normal to its flared surface is equal to the angle at which stellar rays penetrate the disk (refer to Figure 3 of CG):
| (4) |
Radially, the disk extends from the silicate condensation boundary at , to an outer radius, , at which .
The occulting angle,
| (5) |
is a natural angle with which to compare the viewing angle . For , both the central star and most of the disk surface are in direct view. For , star and inner disk are blocked from view by the flared outer “wall”.
2.2 Interior SED vs.

For clarity, we first consider only the disk interior. Figure 1 depicts the viewing geometry and coordinate system. Define and to be orthogonal spatial axes in the plane of the sky, centered on the star. The SED is the integral of specific intensity over projected disk area, viz.,
| (6) |
where
| (7) |
traces the disk boundary on the sky, measures distance to the source from Earth, and is the specific intensity;
| (8) |
with
| (9) |
Here is the Planck function, and , both measure line-of-sight distance from the observer. Since temperature, density, and opacity are specified by our model, calculating the SED at arbitrary inclination is primarily an exercise in multidimensional integration. We perform these integrals numerically using standard techniques (Press et al. 1992). Optical depths are evaluated using a Romberg integrator with a mandated fractional accuracy of . Specific intensities are computed on an adaptive stepsize grid, where the source function () changes by no more than 20% between adjacent grid points. Integrals over are performed using either a Romberg integrator or, in cases where the integrand is very sharply peaked and the Romberg integrator takes prohibitively many steps, a 60-point Gaussian quadrature routine. The final integration over employs the trapezoidal rule on a 60-point logarithmic grid. Answers are routinely checked for robustness against changes in stepsize. We verify that the SED for computed using the multi-dimensional integration code matches the SED for face-on disks computed using the 1-dimensional integrator of CG.
Figure 2 displays a family of interior SEDs for different . First consider SEDs for angles . Radiation at wavelengths shorter than 100 comes mainly from optically thick regions; consequently, is approximately proportional to the areal projection factor . At longer wavelengths, the radiation is emitted by increasingly transparent material, so that tends to be independent of orientation.

For angles , short wavelength emission from the inner disk is strongly extincted by the intervening outer disk. However, millimeter (mm) wavelength fluxes only drop by a factor of 1.8 as the disk is viewed increasingly edge-on, since about half of the outer disk remains visible in that limit.
2.3 Superthermal + Interior SED vs.
Next we compute the total SED. The superheated layer is treated as a plane-parallel atmosphere having visual optical depth normal to the surface. Whenever a line-of-sight intersects the surface, we increment the specific intensity from the interior by333This prescription fails for lines-of-sight which graze the surface tangentially. However, their fractional contribution to the integrated flux is of order , where is the geometrical thickness of the surface, and is the radius of curvature of . Since this fraction is less than , for computational simplicity we let the intersected optical depth of the surface be .
| (10) |
Here, and are unit vectors normal to the surface and parallel to the line-of-sight, respectively, is the Planck-averaged dust emissivity at the surface, and is the intervening optical depth between disk surface and observer.

Figure 3 displays a family of total disk SEDs labeled by . The behavior of the SED for is similar to that described in §2.2, since the interior dominates emission at those wavelengths.
Shortward of , emission from the superheated surface makes a qualitative difference to the appearance of the SEDs. One difference is that for angles , the flux is remarkably insensitive to viewing geometry.444Slight reductions in mid-infrared flux still occur for , both because surface layers intermediate in radius are seen through the outer disk’s atmosphere and because emission from the optically thick interior is proportional to the projected area. This is because shorter wavelength radiation emerges primarily from the superheated surface layers, which are optically thin along most lines of sight.
For angles , the intervening outer disk dramatically extinguishes surface radiation at the shortest wavelengths. However, the total disk SED between 30 and 80 is relatively robust to changes in inclination; it decreases by less than a factor of 3 between face-on and edge-on orientations. Radiation at these wavelengths originates from surface layers at large radii and is only slightly obscured by the tenuous interior at still larger radii.
Finally, in Figure 4, we add the contribution from the central star to the SED. The stellar flux fades rapidly with increasing beyond .

3 Spectral Dust Features
When viewed nearly face-on, passive disks exhibit emission lines associated with dust grain resonances. These features arise from material along the line-of-sight which is optically thin: line-to-continuum flux ratios are of the same order as the percentage enhancement in line opacity. Emission lines may originate from both the optically thin superheated surface (as discussed in CG) and the optically thin interior.
How do such lines vary as the disk is viewed increasingly edge-on? Might they appear in absorption instead, as Cohen & Witteborn (1985) find for 7 of the 32 T Tauri stars they survey spectrophotometrically? To address these questions, we add 6 Gaussian-shaped spectral resonances to our grain emissivity law. In choosing resonant wavelengths and strengths, we aim to illustrate the range of effects which occur with variable viewing angle. Roughly, our 6 lines can be associated with crystalline H2O ice at 60 and 100 (Waters & Waelkens 1998), amorphous silicates at 10 and 20 (Mathis 1990), and small carbon-rich grains or PAHs (polycyclic aromatic hydrocarbons) at 3.3 and 6.2 (Waelkens et al. 1996).

Solid-state line spectra at various disk inclinations are displayed in Figure 5. Emission at all wavelengths varies little with viewing geometry for angles . This is true particularly at the shortest wavelengths where lines arise largely from the optically thin surface layers. At wavelengths progressively longer than 30, the optically thin interior at large radius contributes increasingly to line emission. The drop in the long wavelength continuum with increasing inclination reflects the dependence of radiation emitted by the optically thick interior.
Emission lines at 60 and persist at angles , although their fluxes are lower by a factor 2 for edge-on as compared to face-on disks. For edge-on orientations, only about half of the optically thin interior remains visible. Emission around is more robust to changes in inclination; most of this radiation emerges from the superheated surface at large radii and passes through the rarefied disk interior at yet larger radii with little attenuation.
At the shortest wavelengths, where occultation of the inner disk is significant, lines indeed appear in absorption, though only over a limited range of inclinations between and 90∘. For a dust grain resonance to appear in absorption, disk inclinations must be sufficiently high that line emission from the superheated surface is extinguished. However, cannot be so high that line and continuum optical depths both exceed unity at large radius where the disk interior is nearly isothermal. Only over an intermediate range of inclinations does radiation on and off the resonant wavelength probe a variety of interior disk temperatures. For the resonance to appear in absorption, . At , opacities are lower, and inclinations needed for absorption higher: . In principle, near-infrared line spectra may provide a sensitive diagnostic of disk inclination.
While the trends outlined above apply qualitatively to all passive disks, quantitative conclusions are model-dependent. For example, in our standard model, no absorption line at appears because line-of-sight optical depths are too small to extinguish emission from the superthermal surface. However, such an absorption line would appear in the SED of a sufficiently massive, inclined disk.
4 Applications to Observations
4.1 GM Aurigae and Central Holes
GM Aur is a particularly clean, well-studied T Tauri system to which we can apply our SED models. The single central star has mass , luminosity , and age (Beckwith et al. 1990). Aperture synthesis maps in evince a rotating circumstellar gas disk having approximate projected dimensions 950 , inclined at (Koerner, Sargent, & Beckwith 1993). Hubble Space Telescope (HST) images in scattered visible light reveal the disk surface to be flared, and suggest is closer to (Koerner 1997; Stapelfeldt et al. 1995). These same observations detect no outflow or remnant envelope surrounding this relatively evolved system.
CG model the SED of GM Aur, but with a face-on disk. They suggest that a non-zero disk inclination might cause line-of-sight radiation from the inner disk to be absorbed by the outer disk, thereby explaining the relatively low flux without invoking a central hole. Here we investigate this possibility by refitting the SED with an inclined disk.

Figure 6 displays our new fit with a disk inclined at . Despite the non-zero inclination, none of our fit parameters changes significantly from those given by CG for the face-on case. Fluxes at IRAS (Infrared Astronomical Satellite) wavelengths emerge mainly from the optically thin surface layers, and those at mm wavelengths emerge mostly from the optically thin interior; neither is sensitive to viewing angles near or less than . 555 for this disk equals .
Our model reproduces the observed modest extinction to the central star of magnitudes, but at the cost of still requiring a large central gap having a radius times greater than the dust sublimation radius: , where the uncertainty reflects that of the IRAS point. There is no inclination for which the outer edge of our model disk attenuates the flux without also extinguishing central starlight by several magnitudes. Line-of-sight column densities to surface regions inside 5 AU (where most of the emission originates) are only greater than the column density to the star. This small difference in the amount of obscuring material is completely insignificant; the opacity at is times lower than at visible wavelengths. Thus, the low visual extinction to the central star implies that we should have a clear view of disk regions inside a few AU at near-infrared wavelengths.
In spite of these considerations, we remain skeptical of the existence of such a large central gap devoid of dust. A more palatable alternative might be that the inner disk’s aspect ratio does not increase monotonically with radius. Such undulations in the height of the surface would shadow annular regions from the central star and lower their temperatures. In addition, those ripples nearest the observer would hide their warmer, starlit sides when viewed at non-zero inclination. Accretional heating may be responsible for such changes in surface geometry, as mentioned in CG (see their §3.5); as estimated there, enhancements in disk thickness due to heating of the midplane may become significant inside a few . For an accretion disk which derives its luminosity solely from local viscous dissipation, the aspect ratio indeed decreases with radius whenever opacities increase steeply with temperature, as demonstrated by Bell et al. (1997).
4.2 Class I Sources As Inclined Class II Sources
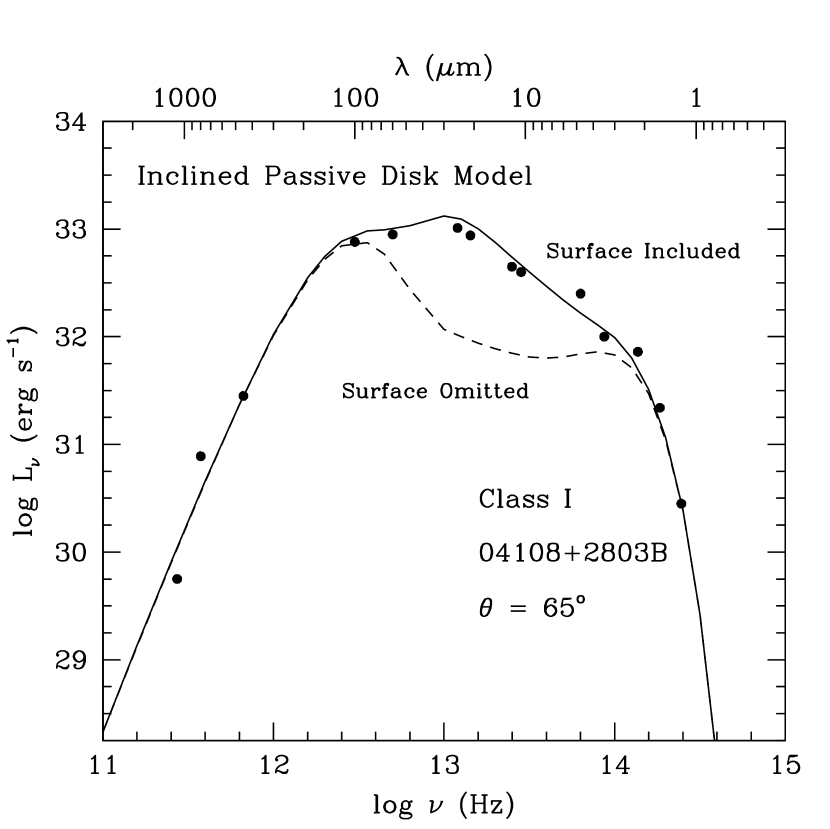
Might some class I spectra represent T Tauri stars obscured by inclined disks? The possibility should be entertained for sources such as 04108+2803B; Figure 7 demonstrates that a passive disk inclined at provides a reasonable fit (to within factors of 2) to this class I SED. Fit parameters are similar to those of our standard model, and are listed in the figure caption. For this particular model, near-IR emission at J, H, and K is interpreted as central starlight extincted by the disk’s outer edge; inclusion of starlight scattered off the disk surface would imply a larger inclination. To highlight the contribution from the superheated surface, we also plot the SED with the surface emission removed. Fluxes between 3 and 60 arise primarily from the superthermal surface, seen both through and over the lip of the outer disk atmosphere (refer to Figure 1).
Clearly, a class I SED does not imply a unique distribution of circumstellar material. High angular resolution images provide additional clues. Many class I sources exhibit near-IR nebulosity on scales ranging from 1500 to 3000 AU (Kenyon et al. 1993; and references therein); for these sources, an additional, non-disk component of dust is needed. Kenyon, Calvet, & Hartmann (1993) model class I SEDs using rotationally flattened, infalling envelopes that are passively heated by central stars. These envelopes extend out to larger radii than do our disks, typically 3000 AU, but contain roughly the same amount of mass, about 0.1. Bipolar holes empty of material, presumably evacuated by outflows, are invoked so that central starlight may scatter off cavity walls towards Earth, thereby explaining the observed near-IR fluxes. In imaging observations of three class I sources using HST/NICMOS (Near Infrared Camera and Multi-Object Spectrometer), Padgett et al. (1998) discover nearly edge-on, flared circumstellar disks having diameters 300–750 AU. Near-IR emission is observed to be scattered not only off upper and lower disk surfaces, but also off “dusty material within or on the walls of outflow cavities.”
In general, a combination of an inclined, passively heated disk, and a dusty bipolar outflow or partially evacuated envelope may best describe class I sources. Since 04108+2803B reveals no optical or near-IR emission beyond 140 AU from its central star (Kenyon, Calvet, & Hartmann 1993), it is consistent with being a limiting example of a simple inclined disk. Two other examples for which this limiting case scenario may also apply include the embedded sources 04295+2251 and 04489+3042. Both sources exhibit nearly flat excesses between 3 and 100 which may arise from flared circumstellar disks. Neither source betrays extended near-IR emission on scales greater than a few hundred AU, or high-velocity molecular gas from an outflow (Kenyon et al. 1993).
Near-IR polarimetry also addresses the possible presence of envelopes. Whitney, Kenyon, & Gómez (1997) determine that linear polarizations greater than 20% at J, H, and K characterize the largest reflection nebulae associated with class I sources. Such large polarizations are interpreted as arising from the scattering of central starlight off cavity walls in envelopes. In contrast, 04108+2803B evinces fractional polarizations of 5.1% and 1.6% at H and K, respectively (Whitney, Kenyon, & Gómez 1997)—levels more comparable to those in class II sources than in truly younger, more embedded protostars, and which may arise from starlight scattered off the disk surface. Resolved polarimetry maps of 04108+2803B can test our hypothesis.
Degeneracies inherent in models deduced from a SED may also be broken by kinematic studies. Interferometric radial velocity maps in molecular lines may distinguish between an infalling envelope (e.g., Hayashi, Ohashi, & Miyama 1993; Ohashi et al. 1997), and a rotating disk (e.g., Koerner & Sargent 1995).
Finally, we note that the inverse problem to 04108+2803B is presented by the star HK Tau B: a system observed to possess an edge-on () circumstellar disk and no observable envelope, but whose infrared SED is not well measured because of confusion from an infrared-bright companion (Stapelfeldt et al. 1998; Koresko 1998). We await SIRTF (Space Infrared Telescope Facility) which can provide both the SED between 3 and 180 microns and also images of the superheated disk surface in thermal emission.
References
- (1) Beckwith, S. V. W., Sargent, A. I., Chini, R. S., & Gusten, R. 1990, AJ, 99, 924
- (2) Bell, K. R., Cassen, P. M., Klahr, H. H., & Henning, Th. 1997, ApJ, 486, 372
- (3) Calvet, N., Patiño, A., Magris, G., & D’Alessio, P. 1991, ApJ, 380, 617
- (4) Chiang, E. I., & Goldreich, P. 1997, ApJ, 490, 368 (CG)
- (5) Cohen, M., & Witteborn, F. C. 1985, ApJ, 294, 345
- (6) D’Alessio, P., Cantó, J., Calvet, N., & Lizano, S. 1998, ApJ, 500, 411
- (7) Hayashi, M., Ohashi, N., & Miyama, S. M. 1993, ApJ, 418, L71
- (8) Kenyon, S. J., Calvet, N., & Hartmann, L. 1993, ApJ, 414, 676
- (9) Kenyon, S. J., & Hartmann, L. 1987, ApJ, 323, 714
- (10) Kenyon, S. J., Whitney, B. A., Gomez, M., & Hartmann, L. 1993, ApJ, 414, 773
- (11) Koerner, D. W. 1997, Origins of Life and Evolution of the Biosphere, 27, 157
- (12) Koerner, D. W., & Sargent, A. I. 1995, Ap&SS, 223, 169
- (13) Koerner, D. W., Sargent, A. I., & Beckwith, S. V. W. 1993, Icarus, 106, 2
- (14) Koresko, C. D. 1998, ApJ, 507, L145
- (15) Lada, C. J. 1987, in IAU Symp. 115, Star Forming Regions, ed. M. Peimbert & J. Jugaku (Dordrecht:Reidel), 1
- (16) Lada, C. J., & Wilking, B. A. 1984, ApJ, 287, 610
- (17) Malbet, F., & Bertout, C. 1991, ApJ, 383, 814
- (18) Mathis, J. M. 1990, ARA&A, 28, 37
- (19) Mendoza, E. E. V. 1968, ApJ, 151, 977
- (20) Ohashi, N., Hayashi, M., Ho, P.T.P., & Momose, M. 1997, ApJ, 475, 211
- (21) Padgett, D., Brandner, W., Stapelfeldt, K., Koerner, D., Terebey, S., Strom, S., & Kenyon, S. 1998, American Astronomical Society Meeting, 192, #10.04
- (22) Press, W. H., Teukolsky, S. A., Vetterling, W. T., & Flannery, B. P. 1992, Numerical Recipes in Fortran (Cambridge University Press)
- (23) Shu, F. H., Adams, F. C., & Lizano, S. 1987, ARA&A, 25, 23
- (24) Stapelfeldt, K., Burrows, C. J., Koerner, D., Krist, J., Watson, A. M., Trauger, J. T., & WFPC2 IDT 1995, American Astronomical Society Meeting, 187, #113.04
- (25) Stapelfeldt, K. R., Krist, J. E., Ménard, F., Bouvier, J., Padgett, D. L., & Burrows, C. J. 1998, ApJ, 502, L65
- (26) Waelkens, C., et al. 1996, A&A, 315L, 245
- (27) Waters, L.B.F.M., & Waelkens, C. 1998, ARA&A, in press.
- (28) Whitney, B. A., Kenyon, S. J., & Gómez, M. 1997, ApJ, 485, 703