Extended X-ray emission from the BL Lac object PKS 0521365
Abstract
Models that seek to unify BL Lacs and low-power radio galaxies predict that the two types of object should show similar isotropically emitted X-ray emission. Testing this is usually limited by difficulties in separating strong X-ray emission from a BL Lac nucleus and surrounding low-surface brightness emission. In this paper we report ROSAT HRI observations of the BL Lac object PKS 0521365. We are able to separate a luminous extended X-ray component from the bright nucleus. Using a new radio map, we show that it is unlikely that the extended emission is due to inverse-Compton scattering of photons from the active nucleus, and instead interpret it as thermal emission from dense, rapidly cooling gas. This is a more extreme environment than is found in typical FRI radio galaxies, and may pose a problem for unified models.
keywords:
X-rays: galaxies – galaxies: individual: PKS 0521365 – galaxies: active1 Introduction
In unified models for radio sources, BL Lac objects are the low-power radio galaxies whose jets are the most highly beamed along our line of sight (e.g. Browne 1983; Antonucci & Ulvestad 1985; Ulrich 1989; Urry & Padovani 1995). Their rapid variability, apparent superluminal motion, strong point-like emission in radio, optical and X-ray, and the detection of some sources in -rays, are all explained if we are seeing emission from a relativistic jet closely aligned with our line of sight. Low-power radio galaxies then represent the ‘parent population’ of unaligned objects whose jets are less favourably aligned. These low-power radio galaxies are likely mostly to be Fanaroff & Riley (1974) class I (FRI) objects, but the parent population may also include some transitional objects and low-excitation FRII radio galaxies.
An important test of this unified model is the degree to which the isotropic (alignment-independent) properties of BL Lacs are similar to those of the parent population of radio galaxies. Such tests have been made, on the whole successfully, by looking at the extended radio emission (e.g. Antonucci & Ulvestad 1985; Kollgaard et al. 1992; Perlman & Stocke 1993, 1994) and properties of the host galaxies (e.g. Ulrich 1989; Abraham, McHardy & Crawford 1991; Wurtz, Stocke & Yee 1996; Falomo 1996) although there is some evidence that there are too few BL Lacs associated with the most luminous host galaxies (Wurtz et al. 1996).
Another isotropic indicator is the clustering environment. Using two-point correlation analysis of optical fields, it has been shown that FRI radio galaxies are normally found in groups or clusters of galaxies (Longair & Seldner 1979; Prestage & Peacock 1988) and BL Lacs seem also to inhabit groups or poor clusters (Pesce, Falomo & Treves 1995; Smith, O’Dea & Baum 1995; Wurtz, Stocke & Ellingson 1997) though it appears that, at least at low redshift, BL Lacs are not often found in the dominant galaxies of rich clusters (Prestage & Peacock 1988; Owen, Ledlow & Keel 1996; Wurtz et al. 1997); for example, Owen et al. (1996) find no BL Lacs at the centres of Abell clusters, a result inconsistent at the 95% confidence level with the numbers expected from the unified models of Urry & Padovani.
Clustering environment may also be investigated by X-ray observations. It has long been known that many objects close to the FRI-FRII luminosity boundary are associated with rich clusters having luminous X-ray haloes. Recent observations with ROSAT have shown that more typical FRI radio galaxies have extended thermal X-ray emission on scales characteristic of groups or poor clusters (Worrall & Birkinshaw 1994). This offers a new way to test the unification hypothesis; such emission should be isotropic, and so we expect all BL Lacs to have X-ray haloes comparable to those of FRIs. This test is difficult because it requires us to separate any extended X-ray emission from the bright unresolved emission of the BL Lac nucleus. In this paper we describe such an analysis of ROSAT observations of the BL Lac PKS 0521365.
PKS 0521365 is a well-studied BL Lac with a redshift of 0.055, comparable to the redshifts of the radio galaxies studied by Worrall & Birkinshaw (1994). It is variously described in the literature as a blazar, a BL Lac object, or an N-galaxy, and on multifrequency spectral index plots like those of Sambruna, Maraschi & Urry (1996) is placed among radio-selected BL Lacs. Its host galaxy is easily detectable in the optical [contributing per cent of the source luminosity at 5500 Å in an arcsec effective aperture; Falomo, Scarpa & Bersanelli (1994)] and it exhibits strong, variable broad emission lines (Scarpa, Falomo & Pian 1995). The host galaxy is a giant elliptical (Wurtz et al. 1996). Pesce et al. (1995) suggest that the excess galaxy count around the object corresponds to a cluster of Abell richness 0 or more; they identify at least one, and up to four associated galaxies within 100 kpc. However, the cross-correlation analysis of Wurtz et al. (1997) suggests a poorer cluster, with richness class .
In the radio, the source has a 408-MHz flux of 36.1 Jy (Wright & Otrupcek 1990), corresponding to a power at that frequency of W Hz-1 sr-1; this places it slightly above the nominal FRI-FRII luminosity boundary ( W Hz-1 sr-1 at this frequency), though of course some of the 408-MHz emission is contributed by the core, presumed to be beamed. It exhibits a core-halo-hotspot morphology on arcsecond scales (Wardle, Moore & Angel 1984; Ekers et al. 1989; see also section 4), which, together with its comparatively high radio power, may suggest that it is an aligned version of a transitional FRI-FRII object. The prominent radio jet is also seen in optical synchrotron emission, extending about 6 arcsec from the nucleus (e.g. Keel 1986, Macchetto et al. 1991). No motion of the core components was detected in VLBI observations (Tingay et al. 1996) and this, together with the comparatively low ratios of nuclear to host-galaxy optical emission (Falomo et al.) and radio core to extended radio flux (Antonucci & Ulvestad 1985), suggests a source that is only moderately relativistically boosted along the line of sight compared to the most extreme BL Lacs. It was for this reason that we selected it as a suitable candidate for an X-ray search for extended emission with the ROSAT HRI. PKS 0521365 has already been extensively observed at X-ray wavebands, with Einstein (Worrall & Wilkes 1990), EXOSAT (Sambruna et al. 1994) and the ROSAT PSPC (Pian et al. 1996), and was detected in -rays by EGRET (Lin et al. 1996), but none of these observations provides the resolution necessary to separate compact from extended structure. The source appears to have a concave spectrum in the X-ray waveband; the energy index is in the soft band, flattening to at higher energies.
Throughout the paper we use a cosmology in which km s-1 Mpc-1, . At the distance of PKS 0521365 1 arcsec corresponds to 1.475 kpc.
2 Observations
We observed PKS 0521365 with the ROSAT HRI for 46.6 ks between 1995 Feb 09 and 1995 Feb 11. The data were analysed using the IRAF Post-Reduction Off-line Software (PROS).
PKS 0521365 is detected at net counts in a 2.5-arcmin radius circle with background taken from an annulus between 2.5 and 3.5 arcmin. The source circle was chosen by expanding the radius until the background-subtracted counts enclosed stayed constant within the errors. A 25-arcsecond radius circle around a nearby point source (1 arcmin to the north) was excluded from the analysis. The detected counts correspond to a rate of counts s-1. The source centroid is consistent to within a few arcseconds with the best available optical and radio positions.
A simple analysis, binning the data into 1-ks intervals, suggests that the source was not strongly variable during the 110 ks that contain our observations. To compare the source flux with the earlier ROSAT PSPC observations, we re-analysed the 4.8 ks of PSPC data from the ROSAT public archive, taking account of the nearby background sources. We detect the source at PSPC counts in the same source region, or counts s-1. A spectral fit to a power-law model between 0.1 and 2.4 keV using the galactic ( cm-2) of Elvis, Lockman & Wilkes (1989) gives an energy spectral index of ( with 32 d.o.f.; errors are for one interesting parameter), consistent with the results of Pian et al. (1996) and Sambruna (1997); the unabsorbed 1-keV flux density from the PSPC data is then Jy, while the flux density from the HRI data on the same assumptions is Jy. If is allowed to vary the best-fit spectral index is with cm-2 ( with 31 d.o.f.; errors for two interesting parameters). Incorporating the spectral uncertainties, the flux in the 0.1–2.4 keV ROSAT band seems to be per cent lower in the HRI data than it was at the epoch of the PSPC observations (1992 Aug 29). We return to this point below.
3 Analysis
Fig. 1 (left) shows that the source is approximately symmetrical; radial profiling is therefore appropriate. To search for extension in PKS 0521365 we first compared its radial profile with the standard empirical expression (David et al. 1997) for the HRI point response function (PRF). It will be seen from Fig. 2 (left) that the radial profile is not well fitted by a standard ROSAT PRF (normalised to the central regions, which we expect to be dominated by the point source); there is a deficit of counts at small radii and an excess of counts at large ones.
It is well known that images from the HRI can be badly affected by errors in the ROSAT aspect correction; the effect is to produce spurious elongation (‘smearing’) in the images of point sources, thus broadening the effective, azimuthally-averaged PRF. Such smearing is likely to be significant compared to the detector and instrument point response on scales of arcsec. As shown in Fig. 1, the source appears elongated, in its central regions, in position angle roughly ; aspect smearing could therefore be responsible for some of the deviations from the nominal PRF shown in Fig. 2.
The aspect errors are thought to arise because the star tracking system does not always calculate positions correctly, due to variations in the gains of the pixels of the star tracker CCD. The spacecraft wobble exacerbates this problem because it causes the guide stars to move across the tracking CCD on short timescales. Methods for correcting aspect smearing (e.g. Morse 1994) therefore rely on binning the data according to the phase of the wobble; so long as the satellite roll angle and the properties of the CCD are constant, the aspect error should be a function of the wobble phase only. To do this, we applied iraf/PROS scripts provided by J. Silverman and D. Harris, based on suggestions by G. Hasinger (for more details see Harris et al. 1998). We first established that all our data were taken at the same roll angle; this, along with the relatively small number of closely spaced observation intervals, allowed us to analyse all the data together. The scripts bin the data as a function of wobble phase, utilising the fact that the relative wobble phase at any time is given simply by the spacecraft clock (modulo clock resets, none of which occured during our observation). We chose to divide the data into 20 phase bins, giving approximately 500 counts per binned observation; with 20 phase bins there are enough counts for centroiding in each bin, and examination of images derived from each bin showed them to be circular. A centroid was then found, using the detect suite of tasks within PROS, for each individual bin, and the images were restacked so that the centroids aligned.
The resulting image (Fig. 1, right) appears less elliptical than the uncorrected image (Fig. 1, left) and is considerably better fit, in its inner regions, by the nominal HRI PRF (Figure 2, right); it appears that the stacking procedure has made the core slightly narrower than the nominal PRF, which is of course derived from observations that may themselves have been affected by aspect uncertainties. We conclude that the inner regions of PKS 0521365 are well described as a point source. More importantly, even after dewobbling we still see an excess of counts over the PRF at radii of 10-40 arcsec. There is no reason to doubt that this corresponds to real extended emission.
To characterise the scale size of this extended emission we fit models consisting of a -model (Sarazin 1986) and a point-source component, both convolved with the nominal PRF, to the background-subtracted radial profile of the dewobbled image. To avoid large contributions to the fitting statistic due to the fact that the restacked data are narrower than the nominal PRF, we sampled the radial profile more coarsely in its central regions for these fits. We performed fits for various different values of the parameter and the core radius. Figure 3 shows a plot of as a function of and core radius; the best fit ( with 15 degrees of freedom) has and a core radius of 8 arcsec, with a central normalisation of the -model of counts arcsec-2. Figure 4 shows the best-fit model plotted with the data. Fitting a point source alone to the data gives unacceptably high values of the fitting statistic ().
For comparison, we fitted a similar range of -models to the archival PSPC dataset. Because of the broader intrinsic PRF of the PSPC, smearing is not considered to be a problem with this instrument. The best-fitting point source and -model had a core radius of 35 arcsec with , as shown in Fig. 5. The data are better fit with this model than with a point-source model alone (best-fit with 9 degrees of freedom), although the point-source fit is formally acceptable ( with 10 degrees of freedom). A large range of possible core radii are acceptable, and the HRI best-fitting model is among those consistent with the PSPC data within the 90 per cent confidence contour; the normalisations of the models are also consistent. If an appropriately normalised -model with core radius 8 arcsec and is subtracted from the PSPC data the remaining emission is adequately modelled as a point source with no significant support for an additional extended component. We therefore conclude that the extended emission is well represented by the HRI best-fit model. The best-fit point-source count rates in this model in the PSPC and HRI data are consistent to within a few per cent, suggesting that the inconsistency between the total PSPC and HRI count rates (section 2) is a result of our not having taken into account the two spectral components corresponding to compact and extended emission.
4 Discussion
The -model fits to the HRI data described above imply that the extended X-ray emission has a core radius of 12 kpc and contributes counts to the total in a 2.5-arcmin radius circle. The corresponding 0.2-1.9 keV luminosity, assuming a Raymond-Smith model with keV and using galactic , is approximately W. This is considerably more luminous than the extended emission seen in most of the radio galaxies of Worrall & Birkinshaw (1994), although the FWHM of 14 kpc is comparable to some of the smaller objects. The central cooling time, on the same temperature assumption, is yr, which, if the emission were thermal, would imply rapid cooling, with expected mass deposition rates of yr-1. The radius at which the cooling time is comparable to the Hubble time would be kpc, larger than the core radius, which means that a simple single-temperature model of the extended emission is not self-consistent. Cooling takes place for any reasonable choice of temperature of the X-ray gas.
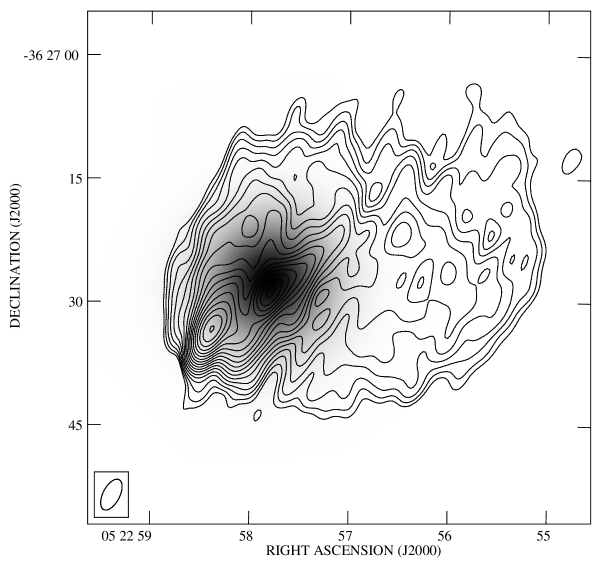
The extended X-ray component detected by the HRI is comparable in size to the extended radio emission in PKS 0521365 which might be thought to suggest an explanation in terms of inverse-Compton (IC) scattering by the energetic electrons in the radio lobes of photons from the cosmic microwave background radiation (CMB) and from the BL Lac nucleus itself (cf. Brunetti, Setti & Comastri 1997). Fig. 6 shows the X-ray image superposed on a 1.4-GHz VLA radio map made from data supplied by G.G. Pooley. Since the flux on the shortest baselines of this radio observation (made at BnA configuration) is equal to the single-dish Parkes radio flux (Wright & Otrupcek 1990) of 16.3 Jy, we can be confident that the extended structure is well represented. The largest angular size (LAS) of the radio emission is about 50 arcsec, whereas the FWHM of the extended X-ray component is 10 arcsec, and Fig. 6 shows that the radio emission is quite asymmetrically distributed around the nucleus, in contrast to the symmetry of the X-ray emission. However, we note that inverse-Compton emission would come preferentially from the parts of the radio lobes closest to the active nucleus, so this in itself does not make an inverse-Compton model implausible. Since we do not know the unprojected geometry of the source, we model the extended radio-emitting component crudely as a uniform sphere centred around the nucleus. The flux density from the core is 2.7 Jy [consistent with the value of Antonucci & Ulvestad (1985)] leaving 13.6 Jy in extended emission. Projection effects make it difficult to assess the true size (and therefore volume) of the lobes, but the flux expected from IC scattering from an object of a given synchrotron (radio) flux is only weakly dependent on the object’s size, and so we assume a radius for the sphere of half the LAS. Because the frequency of a scattered photon is raised by approximately the square of the Lorentz factor () of the scattering electron, and because the electron energy spectrum is dominated by electrons with [i.e. electrons near the assumed low-energy cutoff in the energy distribution; cf. Carilli et al. (1991)] the most significant contribution in the X-ray band from the IC process is due to far-IR photons. We accordingly model the spectrum of the BL Lac’s nucleus in this region as a power law with spectral index 0.78 normalised to the measured 100-m flux of Impey & Negebauer (1988). Pian et al. (1996) argue that the Doppler factor in the nucleus is of order unity, based on the relatively low radio core prominence discussed in section 1 and on models for the nuclear X-ray and -ray emission, and we adopt this value in order to infer a luminosity from the observed flux; we neglect the effects of possible circumnuclear obscuration, so that our source model is effectively an isotropically radiating central source surrounded by a uniform, spherically symmetrical electron distribution. Using a modified version of the code of Hardcastle, Birkinshaw & Worrall (1998a) we find that the IC process in this model cannot produce enough X-rays to account for the observed flux unless the lobes have magnetic field strength approximately an order of magnitude weaker than the value implied by equipartition of energy between magnetic field and relativistic electrons (for electron filling factor unity); this is relatively much weaker than fields that have been inferred in other sources from observations of X-ray emission attributed to inverse-Compton or synchrotron-self-Compton emission (Harris et al. 1994; Feigelson et al. 1995; Hardcastle et al. 1998a; Brunetti et al. 1998). At equipartition, the X-rays from the IC process contribute at most 2 per cent of the observed flux, or less if the filling factor is lower or there is a significant contribution from relativistic protons.
As a result of this simple analysis, we believe that it is unlikely that the extended X-rays seen around the source are due in large part to inverse-Compton emission. Instead, it seems more likely that they are indeed thermal emission from a rapidly cooling central region, and that PKS 0521365 inhabits a cooling flow; this means that its environment is significantly different from those of the FRIs observed by Worrall & Birkinshaw (1994), which tended to lie in less dense environments with much longer cooling times. This model is qualitatively consistent with the bright extended emission line region seen in PKS 0521365 (Boisson, Cayatte & Sol 1989) and with the strong polarization asymmetry seen in the radio observations.
We attempt to fit the radial profile of the source with a cooling flow model based on that described by Hardcastle, Lawrence & Worrall (1998b). In this version of the model, the outer regions of the source are fit with an isothermal model while the temperature and density inside the cooling radius () are power law functions of radius. The electron density follows
while the temperature is given by
Here is the core radius of the model, and is the inner limiting radius of the cooling flow, allowing us to avoid infinities at . , and are scale electron densities and , and scale temperatures; corresponds to the temperature of the non-cooling gas. It is clear that matching temperatures and densities allows us to write all the scale factors in terms of and . The results are only weakly dependent on so long as it is small and we fix it at a value corresponding to 0.01 arcsec in what follows.
The parameters and set the slope of the density and temperature distributions; for a realistic cooling model we expect and , so that density increases and temperature decreases with decreasing radius. The ideal gas law implies that pressure goes as . If the atmosphere is required to be close to hydrostatic equilibrium, then matching mass as a function of radius inside and outside the cooling zone leads to a constraint on as a function of and :
and if we assume some law for the radial dependence of pressure ( is consistent with observations of other cooling regions) then the model has only five free parameters: , , , and , the last being a normalisation parameter that can be determined in the fit. In addition, such a model can only be physically realistic if the cooling time at is comparable to the system lifetime, or the Hubble time:
(Sarazin 1986) where is in years, in keV and in cm-3.
We fit a range of representative cooling models to the data. As before, was chosen from a small number of possible values (0.5, 0.667, 0.9) while ranged from 1–1000 arcsec. We tried values of 1, 1.5, 2, 5 and 10 keV for . was allowed to take the values 1.5, 1.75 or 2.0. No model consisting of a cooling flow alone was a good fit to the data. A number of models consisting of a cooling flow and a central point source were comparable in goodness of fit to the combination of -model and point source discussed above, but most of these were ruled out by the constraint on cooling time. Those that were not have small core radii, low external temperatures and steep temperature and density power laws: for example, the model with keV, , , arcsec is an acceptable fit to the HRI radial profile (). In this model just under 10 per cent of the total counts () are assigned to the cooling flow component. The nominal cooling time at the core radius is years; the mass deposition rate is approximately yr-1 and the implied densities at 20 kpc correspond roughly with those required for pressure equilibrium with the cold gas inferred from observations of the extended emission-line region (Boisson et al. 1989). Though the details of the model may not be correct, this shows that the extended emission of PKS 0521365 can plausibly be modelled as a cooling flow of this type. A strong nuclear source is still necessary; the flux of the point-like component in the cooling-flow model is reduced by only per cent compared to that derived from the simple -model fits of section 3.
5 Conclusions
We have carried out the first separation of nuclear and galaxy-scale extended X-ray emission in a BL Lac object and found evidence that PKS 0521365 inhabits a dense and, presumably, rapidly cooling region of X-ray emission, a much more extreme environment than those found for ‘typical’ FRI radio galaxies; we have shown that it can be modelled as a cooling flow in low-temperature cluster gas. If this result were extended to other BL Lac objects, it would cause difficulties for models that seek to unify FRIs and BL Lacs, and might imply some causal relationship between a dense and rapidly cooling atmosphere and the BL Lac phenomenon. However, it may be that PKS 0521365, with its high power and intermediate radio structure, is not representative of the BL Lac class. Further observations are planned both to verify the thermal nature of the galaxy-scale halo and to see whether PKS 0521365 is unusual among BL Lacs in this respect.
Acknowledgements
We are grateful to Guy Pooley for allowing us to use his VLA observations of PKS 0521365, and to the VLA Analysts for help in recovering the VLA data from the archive. This research has made use of the NASA/IPAC Extragalactic Database (NED) which is operated by the Jet Propulsion Laboratory, California Institute of Technology, under contract with NASA. The Digitized Sky Surveys were produced at the Space Telescope Science Institute under U.S. Government grant NAG W-2166. The National Radio Astronomy Observatory is operated by Associated Universities Inc., under co-operative agreement with the National Science Foundation. This work was supported by NASA grant NAG 5-2312 and PPARC grant GR/K98582.
References
- [] Abraham R.G., McHardy I.M., Crawford C.S., 1991, MNRAS, 252, 482
- [] Antonucci R.R.J., Ulvestad J.S., 1985, ApJ, 294, 158
- [] Boisson C., Cayatte V., Sol H., 1989, A&A, 211, 275
- [] Browne I.W.A., 1983, MNRAS, 204, 23p
- [] Brunetti G., Setti G., Comastri A., 1997, A&A, 325, 898
- [] Brunetti G., Comastri A., Setti G., Feretti L., 1998, A&A, in, press
- [] Carilli C.L., Perley R.A., Dreher J.R., Leahy J.P., 1991, ApJ, 383, 564
- [] David L.P., Harnden F.R., Kearns K.E., Zombeck M.V., Harris D.E., Prestwich A., Primini F.A., Silverman J.D., Snowden S.L., 1997, U.S. ROSAT Science Data Center report, available at URL: http://hea-www.harvard.edu/rosat/rsdc_www/hricalrep.html
- [] Ekers R.D., Wall J.V., Shaver P.A., Goss W.M., Fosbury R.A.E., Danziger I.J., Moorwood A.F.M., Malin D.F., Monk A.S., Ekers J.A., 1989, MNRAS, 236, 737
- [] Elvis M., Lockman F.J., Wilkes B.J., 1989, AJ, 97, 777
- [] Falomo R., 1996, MNRAS, 283, 241
- [] Falomo R., Scarpa A., Bersanelli M., 1994, ApJS, 93, 125
- [] Fanaroff B.L., Riley J.M., 1974, MNRAS, 167, 31P
- [] Feigelson E.D., Laurent-Muehleisen S.A., Kollgaard R.I., Fomalont E., 1995, ApJ, 449, L149
- [] Hardcastle M.J., Birkinshaw M., Worrall D.M., 1998a, MNRAS, 294, 615
- [] Hardcastle M.J., Lawrence C.R., Worrall D.M., 1998b, ApJ, 504, 743
- [] Hardcastle M.J., Worrall D.M., Birkinshaw M., 1998c, MNRAS, 296, 1098
- [] Harris D.E., Carilli C.L., Perley R.A., 1994, Nat, 367, 713
- [] Harris D.E., Silverman J.D., Hasinger G., Lehman I., 1998, A&AS, 133, 431
- [] Impey C.D., Negebauer G., 1988, AJ, 95, 307
- [] Keel W.C., 1986, ApJ, 302, 296
- [] Kollgaard R.I., Wardle J.F.C., Roberts D.H., Gabuzda D.C., 1992, AJ, 104, 1687
- [] Lin Y.C., Bertsch D.L., Dingus B.L., Esposito J.A., Fichtle C.E., Hartman R.C., Hunter S.D., Kanback G., Kniffen D.A., Mayer-Hasselwander H.A., Michelson P.F., von Montigny C., Mukherjee R., Nolan P.L., Scheid E., Sreekumar P., Thompson D.J., 1995, ApJ, 442, 96
- [] Longair M.S., Seldner M., 1979, MNRAS, 189, 433
- [] Macchetto F., Albrecht R., Barbieri C., Blades J.C., Boksenberg A., Crane P., Deharveng J.M., Disney M.J., Jakobsen P., Kamperman T.M., King I.R., Mackay C.D., Paresce F., Weigelt G., Baxter B., Greenfield P., Jedrzejewski R., Nota A., Sparks W.B., 1991, ApJ, 369, L55
- [] Morse J.A., 1994, PASP, 106, 675
- [] Owen F.N., Ledlow M.J., Keel W.C., 1996, AJ, 111, 530
- [] Perlman E.S., Stocke J.T., 1993, ApJ, 406, 430
- [] Perlman E.S., Stocke J.T., 1994, AJ, 106, 56
- [] Pesce J.E., Falomo R., Treves A., 1995, AJ, 110, 1554
- [] Pian E., Falomo R., Ghisellini G., Maraschi L., Sambruna R.M., Scarpa R., Treves A., 1996, ApJ, 459, 169
- [] Prestage R.M., Peacock J.A., 1988, MNRAS, 230, 131
- [] Sambruna R.M., 1997, ApJ, 487, 536
- [] Sambruna R.M., Barr P., Giommi P., Maraschi L., Tagliaferri G., Treves A., 1994, ApJ, 434, 468
- [] Sambruna R.M., Maraschi L., Urry C.M., 1996, ApJ, 463, 444
- [] Sarazin C.L., 1986, Rev. Mod. Phys., 58, 1
- [] Scarpa R., Falomo R., Pian E., 1995, A&A, 303, 730
- [] Smith E.P., O’Dea C.P., Baum S.A., 1995, ApJ, 441, 113
- [] Tingay S.J., Edwards P.G., Costa M.E., Lovell J.E.J., McCulloch P.M., Jauncey D.L., Reynolds J.E., Tzioumis A.K., Migenes V., Gough R., King E.A., Jones D.L., Preston R.A., Murphy D.W., Meier D.L., van Ommen T.D., St. John M., Hoard D.W., Nicolson G.D., Wan T.-.S., Shen Z.-.Q., 1996, ApJ, 464, 170
- [] Ulrich M.-.H., 1989, in Maraschi L., Maccacaro T., Ulrich M.-H., eds, BL Lac objects, Springer-Verlag, Heidelberg, p. 47
- [] Urry C.M., Padovani P., 1995, PASP, 107, 803
- [] Wardle J.F.C., Moore R.L., Angel J.R.P., 1984, ApJ, 279, 93
- [] Worrall D.M., Birkinshaw M., 1994, ApJ, 427, 134
- [] Worrall D.M., Wilkes B.J., 1990, ApJ, 360, 396
- [] Wright H.E., Otrupcek R., 1990, Parkes Catalogue, Australia Telescope National Facility, available at http://wwwpks.atnf.csiro.au/databases/surveys/pkscat90/pkscat90.html
- [] Wurtz R., Stocke J.T., Yee M.K.C., 1996, ApJS, 103, 109
- [] Wurtz R., Stocke J.T., Ellingson E., 1997, ApJ, 480, 547