Hot Stars in Globular Clusters††thanks: Based on observations obtained at the ESO La Silla Observatory, the German-Spanish Calar Alto Observatory and with the Hubble Space Telescope
Abstract
Blue horizontal branch and UV bright stars in several globular clusters are analysed spectroscopically and the results are compared with predictions of stellar evolutionary theory. We find that the distribution of temperatures and surface gravities of the blue HB stars may be explained by the effects of deep mixing. The masses derived for these stars are too low unless one uses the long distance scale for globular clusters. First results on blue HB stars in metal rich clusters are presented.
Analyses of hot UV bright stars in globular clusters uncovered a lack of genuine post-asymptotic giant branch stars which may explain the lack of planetary nebulae in globular clusters seen by Jacoby et al. (1997). Abundance analyses of post-AGB stars in two globular clusters suggest that gas and dust may separate during the AGB phase.
“As the series on metal-poor stars was originally conceived, this paper was to present the final solution to the appearance of the horizontal branch in the H-R diagram. Since that time, however, there have been several developments which obfuscate our understanding of these stars” (Rood 1973)
1 Historical Background
Today we know that galactic globular clusters are old stellar systems and people are therefore often surprised by the presence of hot stars in these clusters. As the following paragraphs will show hot stars have been known to exist in globular clusters for quite some time:
Barnard (1900) reports the detection of stars in globular clusters that were much brighter on photographic plates than they appeared visually: “Of course the simple explanation of this peculiarity is that these stars, so bright photographically and so faint visually, are shining with a much bluer light than the stars which make up the main body of the clusters”.
In 1915 Harlow Shapley started a project to obtain colours and magnitudes of individual stars in globular and open clusters (Shapley 1915a) hoping that “considerable advance can be made in our understanding of the internal arrangement and physical characteristics” of these clusters. In the first globular cluster studied (M 3, Shapley 1915b) he found a double peaked distribution of colours, with a red maximum and a blue secondary peak. He noticed that - in contrast to what was known for field dwarf stars - the stars in M 3 became bluer as they became fainter. Ten Bruggencate (1927, p.130) used Shapley’s data on M 3 and other clusters to plot magnitude versus colour (replacing luminosity and spectral type in the Hertzsprung-Russell diagram) and thus produced the first colour-magnitude diagrams111Shapley (1930, p.26, footnote) disliked the idea of plotting individual data points - he thought that the small number of measurements might lead to spurious results. (“Farbenhelligkeitsdiagramme”). From these colour-magnitude diagrams (CMD’s) ten Bruggencate noted the presence of a giant branch that became bluer towards fainter magnitudes, in agreement with Shapley (1915b). In addition, however, he saw a horizontal branch (“horizontaler Ast”) that parted from the red giant branch and extended far to the blue at constant brightness.
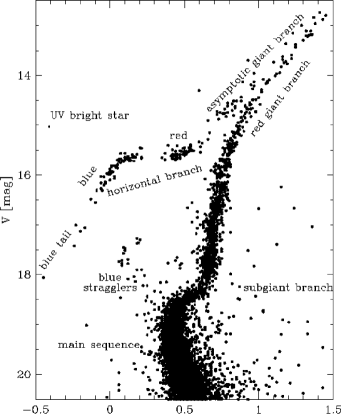
Greenstein (1939) produced a colour-magnitude diagram for M 4 (again noting the presence of a sequence of blue stars at constant brightness) and mentioned that “the general appearance of the colour-magnitude diagram of M4 is almost completely different from that of any galactic (i.e. open) cluster”. He also noticed that - while main-sequence B and A type stars were completely missing - there existed a group of bright stars above the horizontal branch and on the blue side of the giant branch. Similar stars appeared also in the CMD’s presented by Arp (1955). As more CMD’s of globular clusters were obtained it became apparent that the horizontal branch morphology varies quite considerably between individual clusters. The clusters observed by Arp (1955) exhibited extensions of the blue horizontal branch towards bluer colours and fainter visual magnitudes, i.e. towards hotter stars222The change in slope of the horizontal branch is caused by the decreasing sensitivity of BV to temperature on one hand and by the increasing bolometric correction for hotter stars on the other hand. (see Fig. 1). In some of Arp’s CMD’s (e.g. M 15, M 2) these blue tails are separated from the horizontal part by gaps (see also Fig. 3).
About 25 years after their discovery first ideas about the nature of the horizontal branch stars began to emerge: Hoyle & Schwarzschild (1955) were the first to identify the horizontal branch with post-red giant branch (RGB) stars that burn helium in their cores.
Sandage & Wallerstein (1960) noted a correlation between the metal abundance and the horizontal branch morphology seen in globular cluster CMD’s: the horizontal branch became bluer with decreasing metallicity. Faulkner (1966) managed for the first time to compute zero age horizontal branch (HB) models that qualitatively reproduced this trend of HB morphology with metallicity (i.e. for a constant total mass stars become bluer with decreasing metallicity) without taking any mass loss into account but assuming a rather high helium abundance of Y = 0.35. Iben & Rood (1970), however, found that “In fact for the values of Y and Z most favored (Y 0.25 0.28, Z = ), individual tracks are the stubbiest. We can account for the observed spread in color along the horizontal branch by accepting that there is also a spread in stellar mass along this branch, bluer stars being less massive (on the average) and less luminous than redder stars. It is somewhat sobering to realize that this conclusion comes near the end of an investigation that has for several years relied heavily on aesthetic arguments against mass loss and has been guided by the expectation of obtaining, as a final result, individual tracks whose color amplitudes equal the entire spread in color along the observed horizontal branches”. In the same paper they found that “During most of the double-shell-source phase, models evolve upwards and to the red along a secondary giant branch333This secondary giant branch is called asymptotic giant branch (AGB) later in the text and consists of stars with a hydrogen and a helium burning shell. that, for the models shown, approaches the giant branch defined by models burning hydrogen in a shell.”
Comparing HB models to observed globular cluster CMD’s Rood (1973) found that an HB that “…is made up of stars with the same core mass and slightly varying total mass, produces theoretical c-m diagrams very similar to those observed. …A mass loss of perhaps 0.2 M⊙ with a random dispersion of several hundredths of a solar mass is required somewhere along the giant branch.” The assumption of mass loss also diminished the need for very high helium abundances.
Sweigart & Gross (1974, 1976) computed HB tracks including semi-convection and found that this inclusion considerably extends the temperature range covered by the tracks. However, Sweigart (1987) noted that “For more typical globular cluster compositions, however, the track lengths are clearly too short to explain the observed effective temperature distributions along many HB’s, and thus semiconvection does not alleviate the need for a spread in mass (or some other parameter), a point first emphasized by Rood (1973)”.
Caloi (1972) investigated zero age HB locations of stars with very low envelope masses ( 0.02 ; extended or extreme HB = EHB) and found that they can be identified with subdwarf B stars in the field (Greenstein 1971). Sweigart et al. (1974) and Gingold (1976) studied the post-HB evolution and found that – in contrast to the more massive blue HB stars – EHB models do not ascend the second (asymptotic) giant branch (AGB).
Thus our current understanding sees blue horizontal branch stars as stars that burn helium in a core of about 0.5 and hydrogen in a shell. Their hydrogen envelopes vary between 0.02 (less massive envelopes belong to EHB stars which do not have any hydrogen shell burning) and 0.1 – 0.15 . Depending on the mass of their hydrogen envelopes they evolve to the asymptotic giant branch (BHB stars) or directly to the white dwarf domain (EHB stars, AGB manqué stars). For a review see Sweigart (1994).
But blue horizontal branch stars are neither the brightest nor the bluest stars in globular clusters: Already Shapley (1930, p.30) remarked that “Occasionally, there are abnormally bright blue stars, as in Messier 13, but even these are faint absolutely, compared with some of the galactic B stars”. This statement refers to stars like those mentioned by Barnard (1900) which in colour-magnitude diagrams lie above the horizontal branch and blueward of the red giant branch (see Fig. 1). This is also the region where one would expect to find central stars of planetary nebulae, which are, however, rare in globular clusters: Until recently Ps1 (Pease 1928), the planetary nebula in M 15 with its central star K 648, remained the only such object known in globular clusters (see also Jacoby et al. 1997).
The bright blue stars are clearly visible in the colour-magnitude diagrams of Arp (1955). Apart from analyses of individual stars like vZ 1128 in M 3 (Strom & Strom 1970, and references therein) and Barnard 29 in M 13 (Traving 1962, Stoeckley & Greenstein 1968) the first systematic work was done by Strom et al. (1970). All stars analysed there show close to solar helium content, contrary to the blue horizontal branch stars, which in general are depleted in helium (Heber 1987). Strom et al. identified the brightest and bluest stars with models of post-AGB stars (confirming the ideas of Schwarzschild & Härm 1970) and the remaining ones with stars evolving from the horizontal branch towards the AGB. This means that all of the stars in this study are in the double-shell burning stage. Zinn et al. (1972) performed a systematic search for such stars using the fact that they are brighter in the U band than all other cluster stars. This also resulted in the name UV Bright Stars for stars brighter than the horizontal branch and bluer than the red giant branch. Zinn (1974) found from a spectroscopic analysis of UV bright stars in 8 globular clusters “a strong correlation between the presence of supra-HB stars in a globular cluster and the presence of HB stars hotter than log = 4.1”. Harris et al. (1983) extended the compilation of UV bright stars in globular clusters and de Boer (1987) gave another list of UV bright stars in globular clusters, together with estimates of effective temperatures and luminosities.
De Boer (1985) found from analyses of IUE spectra of UV bright stars in 7 globular clusters that their contribution to the total cluster intensity ranges “from, on average, over 50% at 1200 Å to a few percent at 3000 Å.” Most of the UV bright stars found in ground based searches are cooler than 30,000 K, although theory predicts stars with temperatures up to 100,000 K (e.g. Schönberner 1983) The ground based searches, however, are biased towards these cooler stars due to the large bolometric corrections for hotter stars. It is therefore not very surprising that space based searches in the UV (Ultraviolet Imaging Telescope, Stecher et al. 1997) discovered a considerable number of additional hot UV bright stars in a number of globular clusters.
Space based observatories also contributed a lot of other information about hot stars in globular clusters: UIT observations showed the unexpected presence of blue HB stars in metal-rich globular clusters like NGC 362 (Dorman et al. 1997) and 47 Tuc (O’Connell et al. 1997). At about the same time Hubble Space Telescope (HST) observations of the core regions of globular clusters showed long blue tails in metal-rich bulge globular clusters (Rich et al. 1997). Observations of the very dense core regions of globular clusters show that the colour-magnitude diagrams seen there may differ considerably from those seen in the outer regions of the same clusters (e.g. Sosin et al. 1997). The most recent addition to the family of hot stars in globular clusters are the white dwarfs seen in HST observations of M 4 (Richer et al. 1995, 1997), NGC 6752 (Renzini et al. 1996) and NGC 6397 (Cool et al. 1996), which unfortunately are at the very limit for any spectroscopic observations even with 10m class telescopes.
The interest in old hot stars like blue horizontal branch and UV bright stars has been revived and extended by the discovery of the UV excess in elliptical galaxies (Code & Welch 1979; de Boer 1982) for which they are the most likely sources (Greggio & Renzini 1990, Brown et al. 1997).
2 Spectroscopic Analysis Methods
Much of the discussion and findings described above are based solely on the photometric properties of hot stars in globular clusters. Much more physical information regarding their evolutionary status can be gained from spectroscopic analyses: From spectra of various resolutions in combination with photometric data we can determine their atmospheric parameters (effective temperature, surface gravity, and helium abundance) and compare those to the predictions of the stellar evolutionary theory. The disadvantage of spectroscopic observations (compared to photometric ones) is the fact that they require larger telescopes and/or more observing time: For the observations of the blue HB stars in M 15 we used the 3.5m telescope of the German-Spanish Calar Alto observatory in Spain and the targets in NGC 6752 were mostly observed with the NTT at the ESO La Silla observatory in Chile.
To determine effective temperatures and surface gravities we compare various spectroscopic and photometric observations to their theoretical counterparts. Depending on the available observational and theoretical data and the amount of software sophistication a wide variety of analysis methods is currently available. The following paragraphs attempt to give an overview that allows to judge our results – for detailed information we refer the reader to the cited papers.
2.1 Effective Temperature
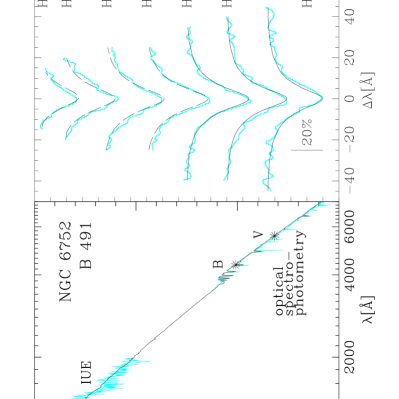
The ideal temperature indicator is insensitive to variations of surface gravity because it then allows to derive the effective temperature independently from the surface gravity. The UV flux distribution meets this requirement for all blue HB stars and the Balmer jump fulfills it for stars with effective temperatures between about 11,000 K and 30,000 K444Johnson UBV photometry becomes rather gravity independent for temperatures above about 20,000 K - at the same time, however, it also loses temperature sensitivity. Strömgren uvby photometry stays temperature sensitive up to higher effective temperatures but is not available for most globular clusters.. As interstellar extinction changes (reddens) the flux distribution of a star the observational data must be corrected for this effect. We dereddened the observed spectra using the extinction law of Savage & Mathis (1979) and the appropriate reddening values for the respective globular cluster. For the analysis published ATLAS9 model spectra (Kurucz 1992) for the metallicity closest to the globular cluster metallicity were used. If not mentioned otherwise the quality of the fit was judged by eye. An example is shown in Fig. 2. Temperature determinations that include UV data (e.g. IUE spectrophotometry) are in general more reliable than those relying solely on optical observations, as the UV flux distribution is more sensitive to temperature variations than the optical continuum. However, as only a very limited amount of UV spectrophotometry is available such data were used only by Heber et al. (1986), de Boer et al. (1995), Cacciari et al. (1995), and Moehler et al. (1997b).
If only optical spectrophotometry is available (most stars in NGC 6752 and M 15) the overall continuum slope and the Balmer jump should be fitted simultaneously, including - if possible - optical photometric data as well. It turns out that straylight from red (i.e. cool) neighbours can cause problems for optical spectrophotometry555This problem does not affect the IUE data as the flux of cool stars decreases rapidly towards shorter wavelengths.: A model that fits the Balmer jump (and the BV photometry) cannot fit the spectrophotometric continuum longward of 4000 Å but instead predicts too little flux there - the straylight from the cool star causes a red excess. An attempt to quantify these effects is described in Moehler et al. (1997b).
Crocker et al. (1988) fit the continuum ( 3450–3700 Å and 4000–5100 Å) in their spectrophotometric data and employ a test to find the best fit. In addition they use the star’s position along the observed HB to obtain another estimate of its temperature and finally average both values for .
2.2 Surface Gravity
Provided the effective temperature has been determined as described above the surface gravity can be derived by fitting the shape of the Balmer line profiles at a fixed temperature. For this purpose the spectra are normalized and corrected for Doppler shifts introduced by the radial velocities of the stars. The model spectra have to be convolved with a profile representing the instrumental resolution, which was generally determined from the FWHM of the calibration lines (for more details see Moehler et al. 1995). We computed (at fixed temperature) for Hβ to Hδ the squared difference between the observed spectrum and the theoretical line profile and used the sum of these differences as estimator for the quality of the fit (Moehler et al. 1995, 1997b, see also Fig. 2). Crocker et al. (1988) used the same lines and employed a test to determine . In addition they corrected their results for the subsolar helium abundance normally present in blue HB stars.
2.3 Simultaneous Determination of and
For the cooler stars (below about 20,000 K) one can use a combination of optical photometry and Balmer line profile fits to determine effective temperature and surface gravity simultaneously: Reddening free indices (Q for Johnson UBV photometry, Moehler et al. 1995; [c1], [u-b] for Strömgren uvby photometry, de Boer et al. 1995) in comparison with theoretical values allow to determine a relation between effective temperature and surface gravity. Fits to the lower Balmer lines (Hβ to Hδ) yield another relation between and and from its intersection with the photometric relation effective temperature and surface gravity can be derived (for examples see de Boer et al. 1995 and Moehler & Heber 1998).
For stars below about 8,500 K (Moehler et al. 1995, M 15) the Balmer lines depend more on than on . In these cases the Balmer lines are used to estimate the temperature and is derived from the Q value.
Including also the higher Balmer lines (Hϵ to H10) allows to derive effective temperature and surface gravity by fitting all Balmer lines (Hβ to H10) simultaneously (Bergeron et al. 1992; Saffer et al. 1994). This method has been used for the UV bright stars (Moehler et al. 1998a) and the blue HB stars in metal-rich globular clusters. We used the procedures developed by Bergeron et al. (1992) and Saffer et al. (1994), which employ a test to establish the best fit. Using only the lower Balmer lines (Hβ to Hδ) yields rather shallow minima of , which allow a large range of values for and .
2.4 Helium Abundances
Helium abundances were either derived from the simultaneous fitting of the Balmer and He i/He ii lines (Moehler et al. 1998a) or from measured equivalent widths that are compared to theoretical curves-of-growth for the appropriate values of effective temperature and surface gravity (Moehler et al. 1997b).
2.5 Model atmospheres
Most of the stars discussed here are in a temperature–gravity range where LTE (local thermal equilibrium) is a valid approximation for the calculation of model atmospheres (Napiwotzki 1997). For the older data published ATLAS model spectra were used: ATLAS6 (Kurucz 1979) by Crocker et al. (1988) resp. ATLAS9 (Kurucz 1992) by de Boer et al. (1995) and Moehler et al. (1995, 1997b). The stars in NGC 6752 (Moehler et al. 1997b) required an extension of the model atmosphere grid to higher surface gravities, for which we used an updated version of the code of Heber (1983). The new fit procedures (Bergeron et al. 1992; Saffer et al. 1994) which we employed for the recent data (Moehler et al. 1998a) required line profiles for the higher Balmer lines (shortward of Hδ) that are not available from Kurucz. We therefore calculated model atmospheres using ATLAS9 (Kurucz 1991, priv. comm.) and used the LINFOR program (developed originally by Holweger, Steffen, and Steenbock at Kiel university) to compute a grid of theoretical spectra that contain the Balmer lines Hα to H22 and He i lines. For those stars which show He ii lines in their spectra (and are thus considerably hotter than the bulk of our programme stars) it is necessary to take non-LTE effects into account (Napiwotzki 1997; Moehler et al. 1998a).
3 Gaps and Blue Tails
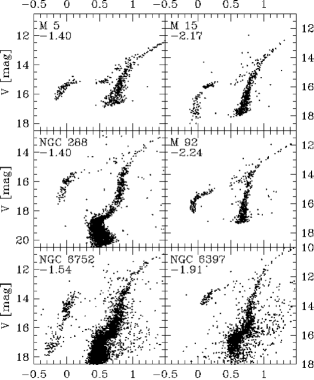
As mentioned above the blue tails seen in many CMD’s of globular clusters are often separated from the more horizontal part of the HB by gaps at varying brightness (examples are shown in Fig. 3; for a list of globular clusters with blue tails see Fusi Pecci et al. [1993]; Catelan et al. [1998] and Ferraro et al. [1998] give comprehensive lists of clusters that show gaps and/or bimodal horizontal branches). Such gaps can be found already in Arp’s (1955) CMD’s and have caused a lot of puzzlement, since they are not predicted by any canonical HB evolution. One of the first ideas was that the gaps are created by diverging evolutionary paths that turn a unimodal distribution on the ZAHB into a bimodal one as the stars evolve away from the ZAHB (Newell 1973; Lee et al. 1994). Evolutionary calculations, however, do not show any such behaviour as horizontal branch stars spend most of their lifetime close to the ZAHB (Dorman et al. 1991; Catelan et al. 1998). Rood & Crocker (1985) suggested that the gaps separate two groups of HB stars that differ in, e.g., CNO abundance or core rotation. A more extreme version of this idea was suggested by Iben (1990): blue tail stars are produced differently from the blue HB stars, e.g. by merging of two helium white dwarfs. So far, no precursor systems of such stars have been observed. Quite recently, Caloi (1999) proposed a change in the stellar atmospheres from convection to diffusion as an explanation for the gaps around (BV)0 = 0, whereas Catelan et al. (1998) suggested that at least some of the gaps may be due to statistical fluctuations. More detailed descriptions of possible explanations for the gaps can be found in Crocker et al. (1988), Catelan et al. (1998), and Ferraro et al. (1998).
The need for more information on the stars along the blue tails led to our project to obtain atmospheric parameters for blue HB and blue tail stars in several globular clusters: NGC 6397 (de Boer et al. 1995), NGC 6752 (Heber et al. 1986; Moehler et al. 1997b), and M 15 (Moehler et al. 1995, 1997a). To enlarge our sample we also used the data of NGC 288, M 5, and M 92 published by Crocker et al. (1988). The CMD’s of these clusters can be found in Fig. 3.
Evolutionary status
In Fig. 4 the physical parameters of the HB stars analysed by Crocker et al. (1988; M 5, M 92, NGC 288), de Boer et al. (1995; NGC 6397), and Moehler et al. (1995, 1997a, M 15; 1997b, NGC6752) are compared to evolutionary tracks. The zero-age HB (ZAHB) marks the position where the HB stars have settled down and started to quietly burn helium in their cores. The terminal-age HB (TAHB) is defined by helium exhaustion in the core of the HB star. The distribution of stars belonging to an individual cluster is hard to judge in this plot but it is obvious that the observed positions in the (, )-diagram fall mostly above the ZAHB and in some cases even above the TAHB666Preliminary results of Bragaglia et al. (1999) indicate deviations from this trend. An indication of a low-temperature gap can be seen at 4.1. The gaps seen in the CMD of NGC 6752 and in the M 15 data of Durrell & Harris 1993 (from which the two hottest stars in M 15 were selected) are visible in the (, ) plane at about 24,000 K, where they separate BHB from EHB stars. In all other clusters the stars above and below the gaps are blue horizontal branch stars cooler than 20,000 K.

Independent of the occurrence of any gaps stars with temperatures between 11,000 ( = 4.04) and 20,000 K ( = 4.30) show lower gravities than expected from canonical scenarios, whereas stars outside this temperature range are well described by canonical HB and EHB evolutionary tracks. The UIT observations of M 13 (Parise et al. 1998) and the HUT spectra of M 79 (Dixon et al. 1996) also suggest lower than expected gravities for blue HB stars. Whitney et al. (1998) use UIT observations of the hot stars in Cen to claim that the extreme HB stars – which agree with theoretical expectations in our results – have lower than expected luminosities, which would mean higher than expected gravities. These deviations in could indicate that some assumptions used for the calculations of model atmospheres may not be appropriate for the analysis of the BHB stars (see also de Boer et al. 1995, Moehler et al. 1995):
Diffusion might lead to peculiar abundance patterns, because radiative levitation might push up some metals into the atmospheres whereas other elements might be depleted due to gravitational settling. Line blanketing effects of enhanced metals may change the atmospheric structure. We found, however, that even an increase of 2 dex in [M/H] results in an increase of only 0.1 dex in 777This is consistent with the findings of Leone & Manfrè (1997) that Balmer-line gravities can be underestimated by 0.25 dex if a solar metal abundance is assumed for metal-rich helium weak stars.. Another effect of diffusion might be a stratification of the atmosphere, i.e. an increase of helium abundance with depth, which has been predicted for white dwarf atmospheres (Jordan & Koester, 1986). In order to affect the Balmer jump significantly the transition from low to high He abundance must take place at an optical depth intermediate between the formation depths of the Paschen and the Balmer continua. Such a fine tuning is unlikely to occur.
Rapid rotation rotation of the stars – if neglected in the model atmospheres – would lower the determined gravities. This effect, however, becomes significant only if the rotation velocity exceeds about half of the break-up velocity. As measured rotation velocities for HB stars are small (Peterson et al. 1995) this possibility can be ruled out as well.
As we did not find any systematic effects in our analysis that are large enough to explain the observed offsets in surface gravity we assume for now that the physical parameters are correct and look for a scenario that can explain them888Scenarios like the merging of two helium white dwarfs (Iben & Tutukov 1984) or the stripping of red giant cores (Iben & Tutukov 1993, Tuchman 1985) may produce stars that deviate from the ZAHB. Such stars, however, are either too hot (merger) or too short-lived (stripped core) to reproduce our results.:
Deep mixing
Abundance variations (C, N, O, Na, Al) in globular cluster red giant stars (Kraft 1994, Kraft et al. 1995, Pilachowski et al. 1996) suggest that nuclearly processed material from deeper regions is mixed to the surface of the stars. Depending on the element considered this mixing has to reach down into varying depths. The enhancement of aluminium, for instance, requires the mixing to extend down into the hydrogen burning (= helium producing) shell (e.g. Cavallo et al. 1998). This means that any mixing that dredges up aluminium will also dredge up helium (helium mixing or deep mixing). Table 1 lists the evidence for deep mixing for the clusters shown in Fig. 3.
| Cluster | Mixing | Reference |
|---|---|---|
| NGC 6752 | probable | Shetrone 1997, IAU Symp. 189(P), 158 |
| NGC 6397 | probable | Bell et al. 1992, AJ 104, 1127 |
| M 92 | probable | Shetrone 1996, AJ 112, 1517 |
| M 15 | probable | Sneden et al. 1997, AJ 114 1964 |
| M 5 | unlikely | Sneden et al. 1992, AJ 104, 2121 |
| NGC 288 | unlikely | Dickens et al. 1991, Nature 351, 212 |
Such “helium mixed” red giant stars evolve to higher luminosities and therefore lose more mass than their canonical counterparts. The resulting HB stars then have less massive hydrogen envelopes and are thus hotter than in the canonical case. In addition the higher helium abundance in the hydrogen envelopes of the HB stars increases the efficiency of the hydrogen shell burning and thereby leads to higher luminosities at a given effective temperature. This increase in luminosity leads to lower gravities for “deep mixed” HB stars than predicted by canonical evolution. For a more detailed discussion of the effects of deep mixing on post-RGB evolution see Sweigart (1997, 1999).

From Fig. 5 it can be seen that most stars hotter than 11,000 K are well fitted by tracks that assume deep mixing999The good fit of the helium-mixed tracks to the stars in NGC 288 is problematic as there is no evidence for deep mixing in this cluster (cf. Table 1).. The cooler stars, however, are better explained by canonical evolution. As deep mixing leads to hotter and brighter blue HB stars it is possible that cool blue HB stars result from unmixed RGB stars. Unfortunately it is not possible to determine the envelope helium abundance of a blue HB star because almost all of these stars are helium-deficient due to diffusion (Heber 1987). As it remains unclear what causes deep mixing (although rotation probably plays a role, Sweigart & Mengel 1979) we do also not know whether all RGB stars within one cluster experience the same degree of mixing.
Masses
Knowing effective temperatures and surface gravities of the stars allows to determine the theoretical brightness at the stellar surface, which together with the absolute brightness of the star yields its radius and thus its mass (see de Boer et al. 1995, Moehler et al. 1995, 1997b). The distances to the globular clusters (necessary to determine the absolute brightnesses of the stars) were taken from the compilation of Djorgovski (1993). The results are plotted in Fig. 6 and can be summarized as follows:

While the masses of the stars in M 5 and NGC 6752 scatter around the canonical values the blue HB stars in all other clusters show masses that are significantly lower than predicted by canonical HB evolution - even for temperatures cooler than 11,000 K where we saw no deviation in surface gravity from the canonical tracks. The fact that the stars in two of the clusters show “normal” mass values makes errors in the analyses an unlikely cause for the problem (for a more detailed discussion see Moehler et al. 1995, 1997b, and de Boer et al. 1995). Also the merger models of Iben (1990) cannot explain these masses since the resulting stars are much hotter. However, if some of the distance moduli we used were too small this could cause such an effect – larger distances would result in brighter absolute magnitudes, i.e. larger radii and thus larger masses.
Distances to Globular Clusters
Using Hipparcos data for local subdwarfs several authors (Reid 1997, 1998; Gratton et al. 1997; Pont et al. 1998) determined distances to globular clusters by main sequence fitting. The results are given in Table 2 and show that the new distance moduli are in general larger than the old ones, in some cases by up to …101010An increase of in (m-M)V increases the mass of a cluster star by 20%..
| Cluster | [Fe/H] | (m-M)0 | |||||
|---|---|---|---|---|---|---|---|
| ZW84 | CG97 | D93 | R97 | R98 | G97 | P98 | |
| 47 Tuc | 0.71 | 0.67 | 13.31 | 13.56 | 13.64 | ||
| M 71 | 0.58 | 0.70 | 12.96 | 13.19 | |||
| NGC 288 | 1.40 | 1.05 | 14.62 | 15.00 | 14.96 | ||
| M 5 | 1.40 | 1.10 | 14.40 | 14.45 | 14.62 | ||
| NGC 362 | 1.28 | 1.12 | 14.67 | 15.06 | |||
| M 13 | 1.65 | 1.41 | 14.29 | 14.48 | 14.45 | 14.47 | |
| NGC 6752 | 1.54 | 1.43 | 13.12 | 13.20 | 13.16 | 13.34 | |
| NGC 6397 | 1.91 | 1.82 | 11.71 | 12.24 | |||
| M 30 | 2.13 | 1.88 | 14.35 | 14.95 | 14.96 | ||
| M 68 | 2.09 | 1.95 | 14.84 | 15.29 | 15.33 | ||
| M 15 | 2.15 | 2.12 | 15.11 | 15.38 | |||
| M 92 | 2.24 | 2.15 | 14.38 | 14.93 | 14.82 | 14.70 | |
| Cluster | [Fe/H] | |||
|---|---|---|---|---|
| NGC 288 | 1.40 | 1.05 | 0.52 0.12 | 0.69 0.16 |
| M 5 | 1.40 | 1.10 | 0.87 0.21 | 0.95 0.22 |
| NGC 6752 | 1.54 | 1.43 | 1.04 0.52 | 1.10 0.55 |
| NGC 6397 | 1.91 | 1.82 | 0.62 0.16 | 0.78 0.20 |
| M 15 | 2.15 | 2.12 | 0.81 0.49 | 1.10 0.67 |
| M 92 | 2.24 | 2.15 | 0.66 0.25 | 1.10 0.42 |

It is interesting to note that for M 5 and NGC 6752 (where the masses almost agree with the canonical expectations) the new distances are close to the old ones, whereas for the metal poor clusters M 15, M 92, and NGC 6397 the new distance moduli are – larger than the old ones, thereby greatly reducing the mass discrepancies (see also Heber et al., 1997). The resulting new masses are plotted in Fig. 7 and in Table 3 we list the average ratio between the mass calculated for an HB star (as described in the text) and the supposed ZAHB mass for its temperature (from Dorman et al. 1993). It can be seen that in all cases (except NGC 6752) the agreement between expected and calculated mass improves with the new distance moduli, although the masses in NGC 288 remain significantly too low. From our observations we therefore favour the longer distance scale for globular clusters as suggested by most analyses of the Hipparcos data.
4 Blue HB Stars in Metal-Rich Globular Clusters
As mentioned in Section 1 metal-rich globular clusters tend to have red horizontal branches. This is plausible as according to canonical stellar evolutionary theory metal-rich HB stars have to have much smaller envelope masses than metal-poor HB stars to achieve the same temperature. Therefore a fine tuning of mass loss is required to produce blue HB stars in metal-rich environments in the framework of classical stellar evolution. Deep mixing or the merging of two helium white dwarfs offer other, more exotic, possibilities to produce hot stars. Yi et al. (1997, 1998) discuss possible mechanisms to produce blue HB stars in elliptical galaxies and d’Cruz et al. (1996) describe mechanisms to create extreme HB stars in metal-rich open clusters like NGC 6791, where Liebert et al. (1994) found subdwarf B stars. Despite this recent theoretical work it came as a surprise when blue HB stars really showed up in metal-rich globular clusters:
UIT images of 47 Tuc ([Fe/H] = 0.71; O’Connell et al. 1997) and of NGC 362111111While not exactly metal-rich NGC 362 has been famous as part of the second-parameter pair NGC 288/NGC 362: Both clusters have similar metallicities, but NGC 288 shows a well populated blue HB, whereas NGC 362 shows almost only red HB stars. ([Fe/H] = 1.28; Dorman et al. 1997) show the presence of blue stars. Colour-magnitude diagrams of the central regions of NGC 6388 ([Fe/H] = 0.60) and NGC 6441 ([Fe/H] = 0.53) obtained with the Hubble Space Telescope (HST) show sloped blue HB’s and long blue tails in both clusters (Rich et al. 1997). The slope means that in these clusters bluer HB stars are visually brighter than redder ones, in contrast to canonical expectations. Their brighter luminosities require the blue HB stars to have lower gravities, which can be caused by rotation, deep mixing and/or higher primordial helium abundance (Sweigart & Catelan 1998).

To find out what really causes the unexpected presence of blue HB stars in these metal-rich clusters we decided to perform a spectroscopic investigation. Unfortunately we were not too lucky with weather and technical conditions and the number of observed stars is small. In addition, some of the blue stars in 47 Tuc and NGC 362 turned out to be field HB stars or SMC main sequence stars. Those stars, that are members of the clusters, are confirmed to be blue HB stars with effective temperatures between 7,500 K and 15,000 K. Due to the weather conditions we could not observe the fainter and therefore hotter stars in these clusters, which would be especially interesting for the question of deep mixing. More details can be found in the forthcoming papers Moehler, Landsman, Dorman (47 Tuc, NGC 362) and Moehler, Catelan, Sweigart, Ortolani (NGC 6388, NGC 6441). The results of our spectroscopic analyses are plotted in Fig. 8 and show that so far there is no evidence for deep mixing or primordial helium enrichment in these stars121212The helium white dwarf merging model of Iben (1990) is unable to produce stars with so low temperatures, because available hydrogen envelope masses are small ( ).. More spectra, especially of fainter stars, are necessary to verify this statement.
5 Hot UV Bright Stars in Globular Clusters
As mentioned in Section 1 optical searches for UV bright stars in globular clusters yielded mainly stars cooler than 30,000 K (the majority of which was even cooler than 15,000 K) due to the increasing bolometric corrections for hotter stars. The vast majority of stars selected this way will evolve either from the blue HB to the asymptotic giant branch or from there to the white dwarf domain. It is rather unlikely to find post-EHB stars this way as they spend only short time in such cool regions (if they reach them at all, see Fig. 9). In addition their overall fainter magnitudes work against their detection. Searches in the ultraviolet regime, on the other hand, will favour hotter stars and thereby increase the chance to detect post-EHB stars. We therefore decided to spectroscopically analyse the many hot UV bright stars that were found in globular clusters by the Ultraviolet Imaging Telescope. Details of the observations, reduction, and analyses can be found in Moehler et al. (1998a). The main goal was to find out how the physical parameters of these stars compare to evolutionary tracks.
The derived effective temperatures and gravities of the target stars are plotted in Fig. 9 and compared to various evolutionary tracks. Three of the stars (in NGC 6121 and NGC 6723) appear to fit the post-early AGB131313Post-early AGB stars left the asymptotic giant branch before the thermally pulsing stage track, while the remaining targets (in NGC 2808 and NGC 6752141414including three stars analysed by Moehler et al. (1997b)) are consistent with post-EHB evolutionary tracks. Like the extreme HB stars themselves (Moehler et al. 1997b) the post-EHB stars show subsolar helium abundances probably caused by diffusion. In contrast the three post-early AGB stars - which are supposed to be successors to helium-deficient blue HB stars - have approximately solar helium abundances. This agrees with the expectation that already during the early AGB stages convection is strong enough to eliminate any previous abundance patterns caused by diffusion.

As expected, the two clusters with populous EHB’s (NGC 2808 and NGC 6752) have post-EHB stars but no post-AGB stars. The number ratio of post-EHB to EHB stars in NGC 6752, however, is much lower than expected from stellar evolutionary theory: 6% instead of 15 – 20%. This discrepancy has first been noted by Landsman et al. (1996) and has been confirmed by our studies, which verified all four post-EHB candidates, but found no additional ones (Moehler et al. 1997b, 1998a). The clusters NGC 6723 and M 4, on the other hand, do not have an EHB population, although they do have stars blueward of the RR Lyrae gap (which are potential progenitors of post-early AGB stars). The lack of genuine post-AGB stars may be understood from the different lifetimes: The lifetime of Schönberner’s (1983) post-early AGB track is about 10 times longer than that of his lowest mass post-AGB track. Thus, even if only a small fraction of stars follow post-early AGB tracks, those stars may be more numerous than genuine post-AGB stars. Due to their relatively long lifetime, post-early AGB stars are unlikely to be observed as central stars of planetary nebulae since any nebulosity is probably dispersed before the central star is hot enough to ionize it. These different life times in combination with the fact that a considerable number of globular clusters stars (all post-EHB stars and some post-BHB stars) do not reach the thermally pulsing AGB stage could be an explanation for the lack of planetary nebulae in globular clusters reported by Jacoby et al. (1997).
6 Abundance Patterns of UV Bright Stars in Globular Clusters
Up to now detailed abundance analyses have been performed mainly for post-AGB stars in the field of the Milky Way (McCausland et al. 1992 and references therein; Conlon 1994; Napiwotzki et al. 1994; Moehler & Heber 1998), for which the population membership is difficult to establish. The summarized result of these analyses is that the abundances of N, O, and Si are roughly 1/10 of the solar values, while Fe and C are closer to 1/100 solar. McCausland et al. (1992) and Conlon (1994) interpret the observed abundances as the results of dredge-up processes on the AGB, i.e. the mixing of nuclearly processed material from the stellar interior to the surface. Standard stellar evolutionary theories (Renzini & Voli 1981; Vassiliadis & Wood 1993) do not predict any dredge-up processes for the low-mass precursors of these objects. Nevertheless the planetary nebula Ps 1 in M 15 as well as the atmosphere of its central star K 648 are both strongly enriched in carbon when compared to the cluster carbon abundance151515A preliminary analysis of ZNG1 in M 5 also shows evidence for a third dredge-up, but no trace of a nebula (Heber & Napiwotzki 1999). (Adams et al. 1984; Heber et al. 1993), pinpointing the dredge-up of triple processed material to the stellar surface and suggesting a possible connection between dredge-up and planetary nebula ejection (Sweigart 1998). This discrepancy may be solved by newer evolutionary calculations which are able to produce a third dredge-up also in low-mass AGB stars (Herwig et al. 1997).
Napiwotzki et al. (1994) on the other hand suggest that the photospheric abundances are caused by gas-dust separation towards the end of the AGB phase: If the mass loss at the end of AGB ceases rapidly gas can fall back onto the stellar surface while the dust particles are blown away by radiative pressure. This process has been proposed by Bond (1991) to explain the extreme iron deficiencies seen in some cooler post-AGB stars and is described in more detail by Mathis & Lamers (1992).
As iron is very sensitive to depletion by gas-dust separation the iron abundance is the crucial key to the distinction between dredge-up and gas-dust separation. To verify any elemental depletion, however, one has to know the original abundance of the star, which is generally not the case for field stars. Therefore UV bright stars in globular clusters with known metallicities provide ideal test cases for this problem and we started a project to derive iron abundances from high-resolution UV spectra obtained with HST.
Abundance analysis of Barnard 29 in M 13 and ROA 5701 in Cen

For Barnard 29 a detailed abundance analysis from optical spectra has been done by Conlon et al. (1994) and we use their results for and for our analysis. For ROA 5701 we determined these parameters from IUE low-resolution spectra, optical photometry, and optical spectroscopy. For the iron abundances of both stars we used GHRS spectra of 0.07 Å resolution that cover the range 1860 1906 Å. The abundances have been derived using the classical curve-of-growth technique. We computed model atmospheres for the appropriate values of effective temperature, surface gravity, and cluster metallicity and used the LINFOR spectrum synthesis package (developed originally by Holweger, Steffen, and Steenbock at Kiel university) for the further analysis. A more detailed description of our analysis can be found in Moehler et al. (1998b).
For ROA 5701 we find an iron abundance of ([Fe/H] = 2.61) and for Barnard 29 we get ([Fe/H] = 2.12). Both stars thus show iron abundances significantly below the mean cluster abundances of [Fe/H] 1.5 …1.7. To look for any abundance trends in Barnard 29 and ROA 5701 in comparison with other stars in these clusters we used the abundances of C, N, O, Si in addition to iron. For ROA 5701 we determined these abundances from optical high-resolution spectra. Abundance analyses of Barnard 29 have been performed by Conlon et al. (1994, N, O, Si) and Dixon & Hurwitz161616They also give an iron abundance of , somewhat higher than ours. (1998, C).

It can be seen in Fig. 10 that N, O, and Si in our two objects show a behaviour similar to that in red giant stars. C seems to be depleted in ROA 5701, but this abundance is based on an upper limit for one line only (4267 Å) which may be affected by non-LTE effects. One should note here, however, that Gonzalez & Wallerstein (1994) find strong enhancements of CNO and s-process elements for the brightest of the cool UV bright stars in Cen which they interpret as evidence for a third dredge-up. Taking the sum of C+N+O as indicator for the original iron abundance (cf. Fig. 11) shows that ROA 5701 and Barnard 29 were not born iron depleted and – contrary to the brightest cool UV bright stars in Cen – also do not show any evidence for a third dredge up. The results of our analysis thus favour the gas-dust separation scenario as explanation for the abundance patterns of low-mass post-AGB and post-early AGB stars.
7 Summary
About nine years ago we began a spectroscopic study of blue horizontal branch stars to find the reason for the gaps seen in the CMD’s of many globular clusters. While we haven’t yet achieved this goal the study led to others which altogether resulted in some interesting findings about the evolutionary status of hot stars in globular clusters:
Blue Horizontal Branch Stars
We studied stars above and below the gaps seen along the blue horizontal branch in the CMD’s of many globular clusters (cf. Fig. 3) and found that most of the stars below the gaps are physically the same as the stars above the gaps, i.e. blue horizontal branch stars with a helium burning core and a hydrogen burning shell. So far extreme horizontal branch stars have been verified spectroscopically only in two clusters (NGC 6752 and M 15).
The blue HB stars with temperatures between 11,000 K and 20,000 K show lower gravities than expected from canonical stellar evolution, which can be explained by deep mixing. The lower than expected masses that are found for most stars cooler than 20,000 K can be understood if we assume that the distance moduli to the globular clusters are larger than previously thought. Analyses of BHB and EHB stars within the same cluster will provide a crucial test of these two hypotheses.
We verified that most of the blue stars seen in the colour-magnitude diagrams of several metal-rich globular clusters are indeed blue horizontal branch stars in these clusters. We did so far not find any significant evidence for deep mixing or a higher primordial helium abundance in these metal-rich globular clusters but have currently too few data to draw any firm conclusions.
UV Bright Stars in Globular Clusters
Analyses of hot UV bright stars in globular clusters uncovered a lack of genuine post-AGB stars – we found only post-early AGB and post-EHB stars. This may be an explanation for the lack of planetary nebulae in globular clusters seen by Jacoby et al. (1997). Abundance analyses of post-AGB stars in two globular clusters suggest that gas and dust separate during the AGB phase.
Acknowledgements
I want to thank M. Catelan, K.S. de Boer, U. Heber, W.B. Landsman, M. Lemke, R. Napiwotzki, S. Ortolani, and A.V. Sweigart for their collaboration on these projects. Thanks go also to the staff of the La Silla, ESO, and Calar Alto, DSAZ, and HST observatories for their support during and after observations. I gratefully acknowledge support for this work by the DFG (grants Mo 602/1,5,6), DARA (grant 50 OR 96029-ZA), Alexander von Humboldt-Foundation (Feodor Lynen fellowship) and Dr. R. Williams as director of the Space Telescope Science Institute (DDRF grant).
References
-
Adams S., Seaton M.J., Howarth I.D., Auriére M., Walsh J.R., 1984, MNRAS 207, 471
-
Alcaino G., Buonanno R., Caloi V., Castellani V., Corsi C.E., Iannicola G., Liller W., 1987, AJ 94, 917
-
Arp H.C., 1955, AJ 60, 317
-
Barnard E.E., 1900, ApJ 12, 176
-
Bell R.A., Briley M.M., Norris J.E., 1992, AJ 104, 1127
-
Bergeron, P., Saffer, R.A., Liebert, J., 1992, ApJ 394, 228
-
Bond H.E., 1991, in Evolution of Stars: the Photospheric Abundance Connection, eds. G. Michaud, A. Tutukov, IAU Symp. 145 (Kluwer: Dordrecht) p. 341
-
Bragaglia, A., C. Cacciari, C., Carretta, E., Fusi Pecci, F., 1999, in The 3rd Conf. on Faint Blue Stars, eds. A.G.D. Philip, J. Liebert & R.A. Saffer (Cambridge:CUP), p. 447
-
Brown J.A., Wallerstein G., Cunha K., Smith V.V., 1991, A&A 249, L13
-
Brown J.A., Wallerstein G., 1993, AJ 106, 133
-
Brown T.M., Ferguson H.C., Davidsen A.F., Dorman B., 1997, ApJ 482, 685
-
Buonanno R., Corsi C.E., Fusi Pecci F., 1981, MNRAS, 196, 435
-
Buonanno R., Buscema G. Corsi C., Iannicola G., Fusi Pecci F., 1983a, A&AS 51, 83
-
Buonanno R., Buscema G. Corsi C., Iannicola G., Smriglio F., 1983b, A&AS 53, 1
-
Buonanno R., Corsi C.E., Fusi Pecci F., Alcaino G., Liller W., 1984, A&AS 57, 75
-
Buonanno R., Caloi V., Castellani V., Corsi C.E., Fusi Pecci F., Gratton R., 1986, A&AS 66, 79
-
Buonanno R., Corsi C.E., Buzzoni A., Cacciari C., Ferraro F.R., Fusi Pecci F., 1994, A&A 290, 69
-
Cacciari C., Fusi Pecci F., Bragaglia A., Buzzoni A., 1995, A&A 301, 684
-
Caloi V., 1972, A&A 20, 357
-
Caloi V., 1999, A&A in press
-
Carretta E., Gratton R.G. 1997, A&AS 121, 95
-
Catelan M., Borissova J., Sweigart A.V., Spassova N., 1998, ApJ 494, 265
-
Cavallo R.M., Sweigart A.V., Bell R.A., 1998, ApJ 492, 575
-
Code A.D., Welch G.A., 1979, ApJ 228, 95
-
Conlon E.S., 1994, in Hot Stars in the Galactic Halo, eds. S. Adelman, A. Upgren, C.J. Adelman, CUP, p. 309
-
Conlon E.S., Dufton, P.L., Keenan, F.P., 1994, A&A 290, 897
-
Cool A.M., Piotto G., King I.R., 1996, ApJ 468, 655
-
Crocker D.A., Rood R.T., O’Connell R.W., 1988, ApJ 332, 236
-
d’Cruz N.L., Dorman B., Rood R.T., O’Connell R.W., 1996, ApJ 466, 359
-
de Boer K.S., 1982, A&AS 50, 247
-
de Boer K.S., 1985, A&A 142, 321
-
de Boer K.S., 1987, in The 2nd Conference on Faint Blue Stars, eds. A.G.D. Philip, D.S. Hayes, J. Liebert, Davis Press, p. 95
-
de Boer K.S., Schmidt J.H.K., Heber U., 1995, A&A 303, 95
-
Dickens R.J., Croke B.F.W., Cannon R.D., Bell R.A., 1991, Nature 351, 212
-
Dixon W.V., Davidsen A.F., Dorman B., Ferguson H.C., 1996, AJ 111, 1936
-
Dixon W.V., Hurwitz M., 1998, ApJ 500, L29
-
Djorgovski S., 1993, in Structure and Dynamics of Globular Clusters, eds. S.G. Djorgovski & G. Meylan, ASP Conf. Ser. 50, p. 373
-
Dorman, B., Lee Y.-W., VandenBerg D.A., 1991, ApJ 366, 115
-
Dorman, B., Rood, R.T., O’Connell, W.O., 1993, ApJ 419, 596
-
Dorman B., Shah R.Y., O’Connell R.W., Landsman W.B., Rood R.T., et al., 1997, ApJ 480, L31
-
Durrell P.R., Harris W.E., 1993, AJ 105, 1420
-
Faulkner J., 1966, ApJ 144, 978
-
Ferraro F.R., Paltrinieri B., Fusi Pecci F., Dorman B., Rood R.T., 1998, ApJ 500, 311
-
Fusi Pecci F., Ferraro F.R., Bellazzini M., Djorgovski S., Piotto G., Buonanno R., 1993, AJ 105, 1145
-
Gingold R.A., 1976, ApJ 204, 116
-
Gonzalez G., Wallerstein G., 1994, AJ 108, 1325
-
Gratton R.G., Fusi Pecci F., Carretta E., Clementini G., Corsi C.E., Lattanzi M. 1997, ApJ 491, 749
-
Greenstein J.L., 1939, ApJ 90, 387
-
Greenstein J.L., 1971, in White Dwarfs, ed. W.J. Luyten, IAU Symp. 42, (Reidel), p. 46
-
Greggio L., Renzini A., 1990, ApJ 364, 35
-
Harris H.C., Nemec J.M., Hesser J.E., 1983, PASP 95, 256
-
Heber U., 1983, A&A 118, 39
-
Heber U., 1987, Mitt. Astron. Ges. 70, 79
-
Heber U., Kudritzki R.P., Caloi V., Castellani V., Danziger J., Gilmozzi R., 1986, A&A 162, 171
-
Heber U., Kudritzki R.P., 1986, A&A 169, 244
-
Heber U., Dreizler S., Werner, K., 1993, Acta Astron. 43, 337
-
Heber U., Moehler S., Reid I.N., 1997, in HIPPARCOS Venice ’97, ed. B. Battrick, ESA-SP 402, p. 461
-
Heber U., Napiwotzki R., 1999, in The 3rd Conf. on Faint Blue Stars, eds. A.G.D. Philip, J. Liebert & R.A. Saffer (Cambridge:CUP), p. 439 (astro-ph/9809129)
-
Herwig F., Blöcker T., Schönberber D., El Eid M., 1997, A&A 324, L81
-
Hoyle F., Schwarzschild M., 1955, ApJS 2, 1
-
Iben I. Jr., 1990, ApJ 353, 215
-
Iben I.Jr., Rood R.T., 1970, ApJ 161, 587
-
Iben I. Jr., Tutukov A.V., 1984, ApJS 54, 335
-
Iben I. Jr., Tutukov A.V., 1993, ApJ 418, 343
-
Jacoby G.H., Morse J. A., Fullton L.K., Kwitter K.B., Henry R.B.C, 1997, AJ 114, 2611
-
Jordan S., Koester D., A&AS 65, 367
-
Kraft R.P., 1994, PASP 106, 553
-
Kraft R.P., Sneden C., Langer G.E., Shetrone M.D., Bolte M., 1995, AJ 109, 2586
-
Kraft R.P., Sneden C., Smith G.H., Shetrone M.D., Langer G.E., Pilachowski C.A., 1997, AJ 113, 279
-
Kurucz R.L., 1979, ApJS 40, 1
-
Kurucz R.L., 1992, in The Stellar Populations of Galaxies, eds. B. Barbuy & A. Renzini, IAU Symp. 149 (Kluwer:Dordrecht), 225
-
Landsman W.B., Sweigart A.V., Bohlin R.C., Neff S.G., O’Connell R.W., et al., 1996, ApJ 472, L93
-
Lee Y.-W., Demarque P., Zinn R., 1994, ApJ 423, 248
-
Leone F., Manfrè M., 1997, A&A 320, 257
-
Liebert J., Saffer R.A., Green E.M., 1994, AJ 107, 1408
-
Mathis J.S., Lamers, H.J.G.L.M., 1992 A&A 259, L39
-
McCausland R.J.H., Conlon E.S., Dufton P.L., Keenan F.P., 1992, ApJ 394, 298
-
Moehler S., Heber U., de Boer K.S., 1995, A&A 294, 65
-
Moehler S., Heber U., Durrell P., 1997a, A&A 317, L83
-
Moehler S., Heber U., Rupprecht G., 1997b, A&A 319, 109
-
Moehler S., Landsman W., Napiwotzki R., 1998a, A&A 335, 510
-
Moehler S., Heber U., 1998, A&A 335, 985
-
Moehler S., Heber U., Lemke M., Napiwotzki R., 1998b, A&A 339, 537
-
Napiwotzki R., 1997 A&A 322, 256
-
Napiwotzki R., Heber U., Köppen, J., 1994, A&A 292, 239
-
Newell E.B., 1973, ApJS 26, 37
-
O’Connell R.W., Dorman B., Shah R.Y., Rood R.T., Landsman W.B., et al., 1997, AJ 114, 1982
-
Paczynski B., 1971, Acta Astron. 21, 1
-
Paltoglou G., Norris J.E., 1989, ApJ 336, 185
-
Parise R.A., Bohlin R.C., Neff S.G., O’Connell R.W., Roberts M.S., et al., 1998, ApJ 501, L67
-
Pease F.G., 1928, PASP 40, 342
-
Peterson R.C., Rood R.T., Crocker D.A., 1995, ApJ 453, 214
-
Pilachowski C.A., Sneden C., Kraft R.P., Langer G.E., 1996, AJ 112, 545
-
Pont F., Mayor M., Turon C., VandenBerg D.A. 1998, A&A 329, 87
-
Reid I.N. 1997, AJ 114, 161
-
Reid I.N. 1998, AJ 115, 204
-
Renzini A., Voli, M., 1981, A&A 94, 175
-
Renzini A., Bragaglia A., Ferraro F.R., Gilmozzi R., Ortolani S., et al., 1996, ApJ 465, L23
-
Rich R.M., Sosin C., Djorgovski S.G., Piotto G., King I.R., et al., 1997, ApJ 484, L25
-
Richer H.B., Fahlmann G.G., Ibata R.A., Stetson P.B., Bell R.A., et al., 1995, ApJ 451, L17
-
Richer H.B., Fahlmann G.G., Ibata R.A., Pryor C., Bell R.A., et al., 1997, ApJ 484, 741
-
Rood R.T., 1973, ApJ 184, 815
-
Rood R.T., Crocker D.A., 1985, in Horizontal-Branch and UV-Bright Stars”, ed. A.G.D. Philip (Schenectady: L.Davis Press), p. 99
-
Saffer R.A., Bergeron P., Koester D., Liebert J., 1994, ApJ 432, 351
-
Sandage A.R., Wallerstein G., 1960, ApJ 131, 598
-
Savage B.D., Mathis F.S., 1979, ARAA 17,73
-
Schönberner D., 1983, ApJ 272, 708
-
Schwarzschild M., Härm R., 1970, ApJ 160, 341
-
Shapley H., 1915a, Contr. Mt. Wilson 115
-
Shapley H., 1915b, Contr. Mt. Wilson 116
-
Shapley H., 1930, Star Clusters, The Maple Press Company, York, PA, USA,
-
Shetrone M.D., 1996, AJ 112, 1517
-
Shetrone M.D., 1997, in Fundamental Stellar Properties: The Interaction between Observation and Theory, IAU Symp. 189 (poster proceedings) (Kluwer: Dordrecht), p. 158
-
Smith V.V., Cunha K., Lambert D.L., 1995, AJ 110, 2827
-
Smith G.H., Shetrone M.D., Bell R.A., Churchill C.W., Briley M.M., 1996, AJ 112, 1511
-
Sneden C., Kraft R.P., Prosser C.F., Langer G.E., 1992, AJ 104, 2121
-
Sneden C., Kraft R.P., Shetrone M.D., Smith G.H., Langer G.E., Prosser C.F., 1997, AJ 114, 1964
-
Sosin C., Piotto G., Djorgovski S.G., King I.R., Rich R.M., Dorman B., Liebert J., Renzini A., 1997, in Advances in Stellar Evolution, eds. R.T. Rood & A. Renzini, CUP, p. 92
-
Stecher T., Cornett R.H., Greason M.R., Landsman W.B., Hill J.K., et al., 1997, PASP 109, 584
-
Stoeckley R., Grennstein J.L., 1968, ApJ 154, 909
-
Strom S.E., Strom K.M., 1970, ApJ 159, 195
-
Strom S.E., Strom K.M., Rood R.T., Iben I.Jr., 1970, A&A 8, 243
-
Sweigart A.V., 1987, ApJS 65, 95
-
Sweigart A.V., 1994, in Hot Stars in the Galactic Halo, eds. S. Adelman, A. Upgren, C.J. Adelman, CUP, p. 17
-
Sweigart A.V., 1997, ApJ 474, L23
-
Sweigart A.V. 1998, to appear in New Views on the Magellanic Clouds, eds. Y.-H. Chu, J. Hesser & N. Suntzeff, IAU Symp. 190 (ASPC)
-
Sweigart A.V. 1999, in The 3rd Conf. on Faint Blue Stars, ed. A.G.D. Philip, J. Liebert & R.A. Saffer (Cambridge:CUP), 3 (astro-ph/9708164)
-
Sweigart A.V., Mengel J.G., Demarque P., 1974, A&A 30, 13
-
Sweigart A.V., Gross P.G., 1974, ApJ, 190, 101
-
Sweigart A.V., Gross P.G., 1976, ApJS 32, 367
-
Sweigart A.V., Mengel J.G., 1979, ApJ 229, 624
-
Sweigart A.V., Catelan M., 1998, ApJ 501, L63
-
ten Bruggencate P., 1927, Sternhaufen, Julius Springer Vlg., Berlin
-
Traving G., 1962, ApJ 135, 439
-
Tuchman Y., 1985, ApJ 288, 248
-
Vassiliadis E., Wood P.R., 1993, ApJ 413, 641
-
Whitney J.H., Rood R.T., O’Connell R.W., D’Cruz N.L., Dorman B., et al., 1998, ApJ 495, 284
-
Yi S., Demarque P., Kim Y.-C., 1997, ApJ 482, 677
-
Yi S., Demarque P., Oemler A. Jr., 1998, ApJ 492, 480
-
Zinn R., 1974, ApJ, 193, 593
-
Zinn R.J., Newell E.B., Gibson J.B., 1972, A&A 18, 390
-
Zinn R., West M.J. 1984, ApJS 55, 45