Abstract
Bulges, often identified with the spheroidal component of a galaxy, have a complex pedigree. Massive bulges are generally red and old, but lower mass bulges have broader dispersions in color that may be correlated with disk colors. This suggests different formation scenarios. I will review possible formation sequences for bulges, describe the various signatures that distinguish these scenarios, and discuss implications for the high redshift universe.
1 Three Scenarios for Bulge Formation
We consider the following possibilities for bulge formation: bulges form before, contemporaneously with, or after disks.
Bulges are old: Monolithic collapse (Eggen, Lynden-Bell and Sandage 1962) described the formation of population II prior to disk formation. Evidence on the age of the inner Milky Way bulge stars generally supports an old population that formed before the disk. Galaxies with massive bulges would have necessarily formed by primordial collapse, major mergers at high redshifts, or infall of satellite galaxies (Pfenniger 1992).
The chemical evidence is less clear: the predictions of a simple monolithic formation model cannot be easily reconciled with the observed abundance spread in bulge stars. Indeed theory has largely supplanted a monolithic collapse picture with a clumpy collapse model. The theory of galaxy formation has had considerable success in predicting various properties of large-scale structure. Hierarchical formation is closer in spirit to the Searle-Zinn view of halo and bulge formation in which many globular cluster mass clumps merge together. We regard bulge and luminous halo formation as closely related phenomena, the bulge simply being the core of the field star halo. Hierarchical galaxy formation involves a sequence of successive mergers of larger and larger subgalactic scale clumps. At any given stage, gas dissipation and settling produces disks that are destroyed in subsequent mergers. Not all disk structure is erased: dwarf satellites and even globular clusters may be substructure relics. The disk only forms after the last massive merger via gas infall. In environments such as rich clusters disk infall is largely suppressed and the cluster cores are dominated by spheroidal galaxies. Bulges are inevitably older than disks, and formed on a dynamical time scale. Their formation is characterized by a series of intense formation episodes or starbursts, produced by each merger. Most stars that are now in the bulge formed during the process of bulge accumulation.
Bulges are of intermediate age: One can also envisage the following prescription for bulge formation. Merging of dwarf irregular galaxies with a massive disk galaxy will result in the dwarf being stripped of gas. The angular momentum of the gas guarantees that it will eventually dissipate to provide infall into the disk. The stellar component, however, as it interacts with the disk is partially tidally disrupted, to form the thick disk, but the dense cores undergo dynamical friction, spiraling into the center to form the bulge. While this may not be appropriate to the inner Milky Way bulge, such a picture may be relevant to the outer spheroid. There is evidence for tidal streams that are continuously generated by disruption of satellites such as the LMC. The age spread of the globular star clusters is consistent with a model in which bulges and disks would be of similar age.
Bulges are young: Bulges may also form slowly by dynamical instabilities of disks. Secular evolution of disks has occurred in at least some galaxies, particularly in late-type galaxies (Kormendy 1992; Courteau 1996). The secular evolution of a cold disk inevitably results in gravitational instability. On galaxy scales this is dominated by the non-axisymmetric modes that induce formation of a bar. Tidal torques are expected by the bar on the disk gas, which consequently suffers angular momentum transfer and forms a massive central concentration. This in turn eventually tidally disrupts the bar, as well as undergoes a central starburst and forms the bulge. This process can repeat as infall of gas continues and the disk becomes sufficiently massive to again be gravitationally unstable. Bar disruption takes up to 100 bar dynamical timescales.
2 Signatures of Bulge Formation
The observed properties of bulges provide a fossil testament to their formation. The various signatures do not lead to any unique conclusion, however. Consider first the Milky way as a prototype for bulge formation, bearing in mind that our local neighborhood is necessarily limited in scope. The following remarks are largely summarized from an excellent review of the Milky Way bulge by Wyse, Gilmore and Franx (1997).
Ages: This should be the cleanest signature. The Milky Way bulge appears to be indistinguishable in age from the inner globular clusters that form a flattened subsystem and appear to be Gyr younger than the oldest globular cluster systems. However the colors of other bulges,especially in late-type disks, show a broad dispersion which may reflect age differences.
Abundances: The observed abundances of Milky Way bulge stars show a broad dispersion, suggestive of inhomogeneous enrichment, and the mean metallicity is lower than that of the disk, but higher than that of the halo. This supports the inference of an old bulge from observed ages in localized regions. In particular the outer bulge appears to be more metal-poor than the old disk. If age traces metallicity, one infers that the bulge precedes the disk. However dynamical processes could delay bulge star formation without inducing chemical evolution.
Angular momentum: The angular momentum distribution of the inner bulge resembles that of the halo (or outer bulge), rather than that of the disk. This is suggestive of a sequential formation process.
Other bulges provide a broader basis with which to search for clues to bulge formation.
Profiles: Core radii of bulges and disks are well correlated. This suggests that the formation of the two components is closely coupled.
Colors: Bulge colors show a broad dispersion, but generally track disk colors. Both metallicity and age must therefore be correlated.
Dynamics: Low luminosity bulges are rotationally supported, as are disks, but luminous bulges generally are supported by anisotropic velocity dispersion. Bulges overlap with, but generally have lower anisotropic velocity dispersion support (i. e. ) than do ellipticals. This suggests that massive bulges are distinct from disks and closer to ellipticals in dynamical origin, whereas low luminosity bulges are more closely associated with disk star formation.
Fundamental plane: Bulges lie in the identical fundamental plane as ellipticals, although there is a slight offset of the zero point. This is suggestive of a similar early formation phase for bulges to that for ellipticals.
The signatures provide mixed signals on the epoch of bulge formation. It is probably true that many bulges, especially if massive, form early, while some, especially if associated with later-type spirals, form late. The age differences provide an interesting environment with which to probe bulge formation models.
3 Bulges at High Redshift
The high redshift universe potentially provides a unique discriminant. The differences between the bulge models described above are magnified at high redshift.
We may broadly classify these bulge formation scenarios into three types: secular evolution in which bulges form relatively late by a series of bar-induced starbursts, one in which bulges form simultaneously with disks, and an early bulge formation model in which bulges form earlier than disks. Adjusting the three models to produce optimal agreement with observations, we compare their high-redshift predictions with present-day observations, in particular, with data compiled in various studies based on the CFRS (Schade et al. 1996; Lilly et al. 1998) and the HDF (Abraham et al. 1998). We have developed a simple scheme for simulating the rival models and comparing bulge colors and sizes with observations. Hubble Space Telescope photometry and color information is available for galaxy samples that extend up to redshift unity and beyond. At this epoch one may hope to detect the difference between old and young bulge models.
For the purposes of normalizing our models, we examine two local samples (de Jong & van der Kruit 1994; hereinafter, DJ; Peletier & Balcells 1996, hereinafter, PB). Both are diameter-limited samples but differ in orientation selection, so that edge-on disks in the PB sample are simply redder and less prominent relative to the bulges.
Starting with the local properties of disks and a reasonable distribution of formation times, we construct a fiducial disk evolution model, to which we add three different models for bulge formation, the principle difference being simply the time the bulges form relative to that of their associated disks. We do not attempt to model the internal dynamics or structure of spirals (e.g., Friedli & Benz 1995). We adopt the usual Sabc and Sdm luminosity functions (LFs) for disk galaxies (Binggeli, Sandage, and Tammann 1988). We evolve these galaxies backwards in time and in luminosity according to their individual star formation histories without number evolution. We take halo formation time to equal the time over which 0.25 of the final halo mass is assembled. We normalize by assuming a constant mass-to-light ratio where corresponds to and we adopt the usual CDM matter power spectrum. We take star formation in the disk to commence at the halo formation time with an e-folding time that depends on the galaxy luminosity, to roughly fit the colour-magnitude relationship. We assume exponential profiles for the disks with a central surface brightness modified to account for the observed correlation between surface brightness and luminosity (e.g., de Jong 1996; McGaugh & de Blok 1997). We compute bulge spectra for the purposes of determining colours and magnitudes using the Bruzual & Charlot instantaneous-burst metallicity-dependent spectral synthesis tables (Leitherer et al. 1996).
To calibrate our fiducial disk evolution models, we compare the model predictions to both the colour-magnitude relationship of disks in spirals and the cosmic history of luminosity density. There is good agreement with the colour-magnitude relationship. All models, for which bulge, disk, and E/S0 contributions have been considered, produce fair agreement with the luminosity density of the universe at all redshifts for which observable constraints are available (Lilly et al. 1996; Madau et al. 1996; Connolly et al. 1997).
If bulges form through the merging of disk galaxies, the formation of the stars found in bulges is expected to precede the formation of stars in the disks which form out of gas that accretes around the spheroid (e.g., Kauffmann & White 1993; Frenk et al. 1996). For simplicity, we commence star formation in the bulge 4 Gyr prior to the formation of disks in our fiducial model and suppose that it continues for Gyr.
Suppose next that star formation in the bulge commences at the formation time of disks, for example because high angular momentum gas forms the disk while low angular momentum gas simultaneously forms the bulge which undergoes a mild starburst. One can imagine gas-rich satellite infall. The gas is tidally stripped and accreted onto the disk at large radii, whereas the dense cores lose angular momentum by dynamical friction and are incorporated into the bulge. A refinement of this model would allow for a sequence of early mergers that formed the bulge. However the final merger dominates the luminosity and therefore the spectral evolution, since the star formation efficiency is greatest for the most massive systems.
Finally, in secular evolution, bulges form after disks, with gas accretion onto the disk triggering the formation of a bar that drives gas inflow into the center followed by star formation (Friedli & Benz 1995). The build-up of a central mass destroys the bar and inhibits gas inflow (Norman, Sellwood, & Hasan 1996), consequently stopping star formation in the bulge until enough gas accretes onto the galaxy to trigger the formation of a second bar, followed by a second central starburst. Somewhat arbitrarily, we suppose that the first central starbursts occur some 2 Gyr after disk formation in our fiducial model, that central starbursts last = 0.1 Gyr, as in the simulations by Friedli & Benz (1995), and that 2.4 Gyr separate central starbursts, in order to illustrate the general effect of a late secular evolution model for the bulge. We assume that the star formation rate follows an envelope with an e-folding time equivalent to the history of disk star formation. We thereby force star formation in the disk and the bulge to follow very similar time scales, given the extent to which they are both driven by gas infall processes.
We add a simple model for E/S0 galaxies to aid with the interpretation of observed high redshift, high systems, somewhat arbitrarily assuming that the distribution of formation redshifts for the population is scaled to be at exactly twice the distribution of formation redshifts.
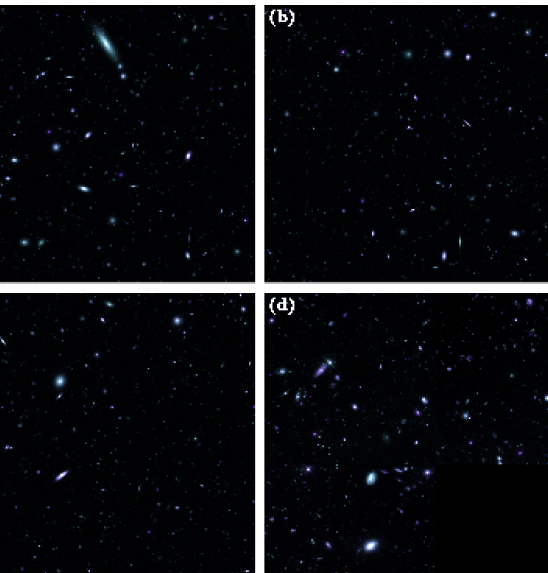
We perform all our calculations using a galaxy evolution software package written by one of the authors for calculating how the gas, metallicity, star formation, luminosity, and colours vary as a function of time for a wide variety of morphological types, formation times, and star formation histories. With this software package, we present representative HDF simulations for our three bulge formation models in Figure 1 for comparison with the observations.
Clearly the secular evolution model, with late bulge formation, has a paucity of large B/T objects relative to the other models (Figure 2). The simultaneous bulge formation model has a large number of such galaxies simply because a large number of bulges were forming at this time, while the early bulge formation model has a slightly lower value due to the fact that bulges in this model had long been in place within their spiral hosts.
As expected, in all redshift bins, bulges are slightly bluer in the late bulge formation models than are the disks (Figure 3). A blue tail may be marginally detectable in the Schade et al. data in the highest redshift bins. Unfortunately, given the extremely limited amount of data and uncertainties therein, little can be said about the comparison of the models in all three redshift bins, except that the range of bulge and relative bulge-to-disk colours found in the data appears to be consistent with that found in the models.
While consistent with currently available data, our models for bulge formation are schematic and are intended to illustrate the observable predictions that will eventually be made when improved data sets are available in the near future. Our models are still quite crude, assuming among other things that the effects of number evolution on the present population of disks can be ignored to as suggested, for example, in Lilly et al. 1998. In contrast, one recent analysis (Mao, Mo, & White 1998) has argued that observations favor the interpretation that a non-negligible amount of merging has taken place in the disk population from to . For this particular interpretation, it remains to be seen how all the present stellar mass in disks could have built up if disks were continually destroyed by merging to low given the constraints on the cosmic star formation history. Infall of metal-poor gas provides a non-destructive alternative that is supported by chemical evolution modeling of the old disk and even by observations of a reservoir of high velocity outer halo clouds.
Acknowledgements
We thank our collaborator Laura Cayon for many inspiring discussions of bulge issues. This research has been supported in part by NSF.
4 References
References
- [Abraham et al. 1998] Abraham, R.G., Ellis, R.S., Fabian, A.C., Tanvir, N.R., & Glazebrook, K. 1998, MNRAS, submitted.
- [Bingelli et al. 1988] Binggeli, B., Sandage, A., & Tammann, G.A. 1988, ARAA, 26, 509.
- [Bouwens et al. 1999] Bouwens, R., Cayon, L. and Silk, J. 1999, ApJ, in press.
- [Connolly 1997] Connolly, A.J., Szalay, A.S., Dickinson, M., Subbarao, M.U., & Brunner, R.J. 1997, ApJ, 486, L11.
- [Courteau 1996] Courteau, S. 1996, to appear in ”Morphology and Dust Content in Spiral Galaxies”, Kluwer, Dordrecht, eds. D. Block & M. Greenberg.
- [de Jong & van der Kruit 1994] de Jong, R.S. & van der Kruit, P.C. 1994, A&AS, 106, 451.
- [de Jong 1995b] de Jong, R.S. 1996, A&A, 313, 45.
- [Eggen et al. 1962] Eggen, O., Lynden-Bell, D., & Sandage, A. 1962, ApJ, 136, 748.
- [friedli] Friedli, D., & Benz, W. 1995, A&A, 301, 649.
- [kauffman 1993] Kauffmann, G. & White, S.D.M. 1993, MNRAS, 261, 921.
- [Kormendy 1992] Kormendy, J. 1992, in Proc IAU Symp.153, “Galactic Bulges”, p. 209, Kluwer, Dordrecht, eds. Dejonghe, H. & Habing, H.
- [Leitherer et al. 1996] Leitherer et al. 1996, PASP, 108, 996.
- [Lilly et al. 1996] Lilly, S.J., LeFevre, O., Hammer, F., & Crampton, D. 1996, ApJ, 460, L1.
- [Lilly et al. 1997] Lilly, S.J., et al. 1998, ApJ, submitted.
- [Madau et al. 1996] Madau, P., Ferguson, H.C., Dickinson, M.E., Giavalisco, M., Steidel, C.C., & Fruchter, A. 1996, MNRAS283, 1388.
- [Mao, Mo, & White 1998] Mao, S., Mo, H.J., & White, S.D.M. 1998, ApJ, submitted, astro-ph/9712167.
- [McGaugh & de Blok 1997] McGaugh, S.S., & de Blok, W.J.G. 1997, ApJ, 481, 689.
- [Norman, Sellword, & Hasan] Norman, C.A., Sellwood, J.A., & Hasan, H. 1996, ApJ, 462, 114.
- [Peletier & Balcells 1996] Peletier, R.F. & Balcells, M. 1996, AJ, 111, 2238-2242.
- [Pfenniger 1992] Pfenniger, D. 1992, in Proc IAU Symp.153, “Galactic Bulges”, p. 387, Kluwer, Dordrecht, eds. Dejonghe, H. & Habing, H.
- [Schade et al. 1996] Schade, D., Lilly, S.J., Le Fevre, O., Hammer, F., & Crampton, D. 1996, ApJ, 464, 79.