Differential Astrometry over 15∘
Abstract
We observed the pair of radio sources 1150+812 and 1803+784 in November 1993 with a VLBI array, simultaneously recording at 8.4 and 2.3 GHz. We determined the angular separation between the two sources with submilliarcsecond accuracy by using differential techniques. This result demonstrates the feasibility of high precision differential astrometry for radio sources separated in the sky by almost 15∘, and opens the avenue to its application to larger samples of radio sources.
keywords:
astrometry , techniques: interferometric , quasars: individual (1150+812) , BL Lacertae objects: individual (1803+784)PACS:
95.10.Jk , 95.75.Kk , 98.54.Gr1 Introduction
Very Long Baseline Interferometry (VLBI) is a powerful astrometric technique. Centimeter-wavelength VLBI group-delay astrometry of extragalactic radio sources routinely provides precisions at the milliarcsecond (mas) level, thus allowing a celestial reference frame to be built with milliarcsecond accuracy (Ma et al. 1990). One step further in high precision astrometry is phase-delay differential astrometry, in which the differences between the phase delays of two radio sources are used to determine their relative separation. For close source pairs, this technique yields accuracies of a few microarcseconds (), i.e. the case of the double quasar 1038+528 A and B (Marcaide & Shapiro, 1983), whose components are separated by less than an arcminute. For sources separated up to a few degrees, accuracies of about 0.1–0.3 mas are achieved (Guirado et al. 1995, Lara et al. 1996, Ros et al. 1999a). The basic idea underlying differential astrometry is that the differenced phase-delays from the source pair will be largely free of unmodelled systematic effects. If the sources are very close, cancellation of systematic effects is almost complete, whereas if the sources lie at increasingly angular distances, the cancellation is less perfect, and the determination of their angular separation is correspondingly less accurate.
In this contribution, we address the question of the applicability of the differential astrometric technique to a pair of strong radio sources, 1150+812 and 1803+784, separated by almost 15∘. We demonstrate the feasibility of the technique for this pair of radio sources, and measure their relative separation with submilliarcsecond accuracy. In addition, we show that the standard errors are dominated by uncertainties in the coordinates of the reference source.
2 Observations
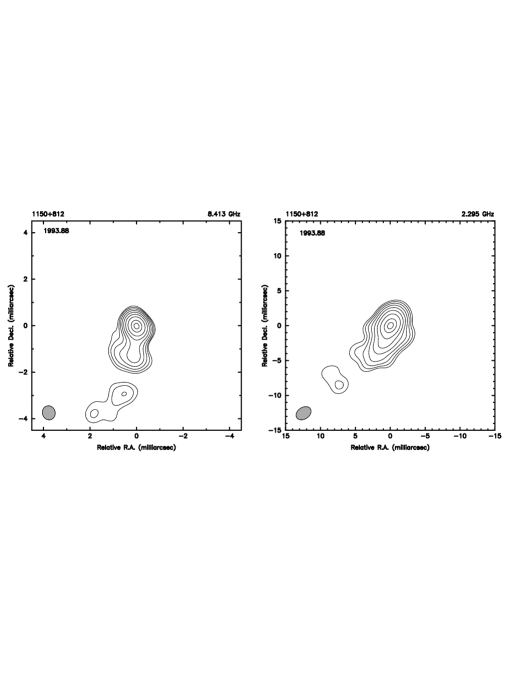
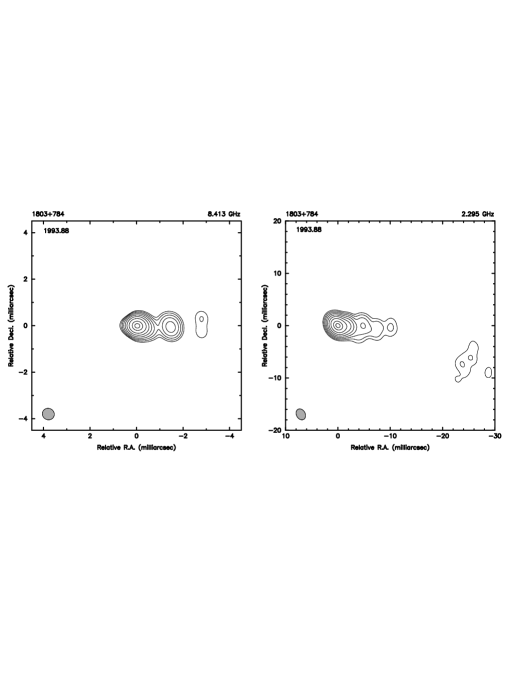
We observed the radio sources 1150+812 (QSO) and 1803+784 (BL Lac) on November 1993 during 12 hours, simultaneously recording at 8.4 GHz and 2.3 GHz. We used the following antennas: Effelsberg, Medicina, Onsala, Fort Davis, Hancock, Los Alamos, North Liberty, Owens Valley, and the Phased VLA. The data were correlated at the Max-Planck-Institut für Radioastronomie, Bonn, Germany. We used an observing cycle of 7 min, consisting of 2 min observing 1150+812, 1.5 min of antenna slew, 2 min observing 1803+784, and 1.5 min slew back to 1150+812. Since both sources were strong ( 1 Jy) at the epoch of observation, we have detected the radio sources for all of the baselines, with high signal-to-noise-ratio (SNR) at both frequencies.
After correlation, we exported the data and constructed the interferometric visibilities using the calibration information provided by the staff at the observing antennas. We used the software package DIFMAP (Shepherd et al., 1995) to obtain images of both sources at each frequency. The images (Figs. 1 and 2) clearly show the typical core-jet structure for this kind of radio sources, the brightest spot being usually associated with the flat-spectrum core, and the others with steeper spectrum components of a jet. 1150+812 displays a southeastward jet, while 1803+784 displays a westward jet.
3 Astrometric Data Reduction
The goal of the data reduction is to obtain a data set of differenced phase-delays on which a weighted-least-squares algorithm can be applied to determine the relative position of the sources. To obtain this data set, we went through several steps, namely, phase connection (or correction of the ambiguities of the phases; Shapiro et al., 1979), structure correction, and removal of opacity and propagation medium effects. In the astrometric process, we used data from the antennas with best performance (Effelsberg, Medicina, Fort Davis, Los Alamos, North Liberty, and Owens Valley).
We used our hybrid maps to correct for the source structure contribution to the phase delays, using as reference point the peak of the brightness distribution of each map. Most of the propagation medium effects are caused by the troposphere and the ionosphere. We accurately modelled the tropospheric behaviour from detailed information of the weather parameters at each of the antenna sites. The ionosphere is a refractive plasma that introduces a dispersive contribution to the phase delays, which scales as . Thus, we used our dual-frequency data to estimate and remove such contribution. For it, the reference points on the 2.3 GHz maps should correspond to those chosen on the 8.4 GHz maps. We took into account opacity effects to obtain a reliable map registration (Guirado et al., 1998).
In this way, we obtained a set of (undifferenced) phase delays, free of structure and propagation medium effects. However, the existence of unmodelled systematic effects was evident from a visual inspection of the data. We formed a set of differenced phase delays by subtracting the delay of each observation of 1150+812 from the delay of the previous observation of 1803+784. Although the sources are separated by 15∘ , this procedure largely cancelled out systematic effects still present in the undifferenced phase delays.
4 Relative position of the radio sources
Our estimates of the relative positions of 1150+812 and 1803+784, in right ascension and declination, are based on a weighted-least-squares analysis of the differenced phase delays. We also included the (undifferenced) phase delays for 1803+784 in the analysis to estimate the behaviour of the station clocks. The standard deviations of the differenced phase delays, and of the 1803+784 phase delays were scaled separately so that, for each baseline, the root-mean-square of the postfit residuals was unity. The difference between our estimates and those given by IERS (1996) are shown in Table 1.
| = | ||
| = |
The error bars include formal uncertainties from a covariance analysis, and residual errors of the geometry of the interferometric array, source position, source opacity, and atmosphere. The largest contributor to the error budget in the relative separation of the sources is the uncertainty in the a priori position of the reference radio source, 1803+784 (IERS, 1996).
5 The separation arclength
Since the angular separation between the two sources is very large, the use of the arclength, , between the sources could be a better estimate of their relative separation than and , since is invariant to rotations and, therefore, independent of the reference system where the source coordinates are defined. The arclength between the two radio sources, compared to the arclength as given by IERS is
The uncertainty of the arclength estimate is smaller than for and , as expected. However, the special geometry of the radio sources (see below) prevents it from being even smaller. To better clarify this point, we develop the expression for the uncertainty in the determination of the arclength, , using an error propagation equation (Bevington & Robinson, 1992), from
| (1) |
where is the covariance of coordinates and (each one taking the values ), are the a priori uncertainties of the source coordinates, and are the correlation coefficients. The North Celestial Pole, and the sources 1150+812 (source A) and 1803+784 (source B, taken as the reference source), form a triangle of at the North Celestial Pole. The geometry is such that . We can then write Eq. 1 approximately as
where . This gives mas. (Note that K=1 would imply ). This result shows that % of the overall standard deviation of the arclength is produced solely by the contribution of the a priori standard deviations of the source coordinates. We emphasize that this is a consequence of the location of the radio sources in the celestial sphere, and dominate by far the standard deviation of our astrometric determination.
6 Results and Conclusions
We observed the pair of strong radio sources 1150+812 and 1803+784 with an interferometric VLBI array on November 1993. The antennas simultaneously recorded data at 8.4 and 2.3 GHz, which allowed us to remove ionospheric contributions to the delays. We also estimated the contributions to the delays due to the troposphere, source structures, and source opacities. From geometric considerations, we infer that the main contribution to the uncertainty in the determination of the relative angular separation comes from the uncertainty in the a priori position of the reference source. We show that this uncertainty is further increased by the particular geometry of the radio source pair.
We determined with submilliarcsecond accuracy the angular separation of the pair of radio sources, separated by almost 15∘, and thus demonstrated the feasibility of using phase delays from dual-frequency VLBI measurements for very large angular separations. This accomplishment opens the applicability of the technique to a large sample of radio sources (Ros et al., 1999b). A final goal of building a quasi inertial celestial reference frame based on stationary radio source cores, with submilliarcsecond accuracy, appears within reach.
References
- Bevington & Robinson, (1992) Bevington, P.R. & Robinson, D.K., “Data Reduction and Error Analysis for the Physical Sciences”, 2nd Ed., McGraw Hill, New York, 1992
- Guirado et al., (1995) Guirado, J.C., Marcaide, J.M., Elósegui, P., Ratner, M.I., Shapiro, I.I., Eckart, A., Quirrenbach, A., Schalinski, C.J., & Witzel, A, 1995, A&A, 293, 613
- Guirado et al., (1998) Guirado, J.C., Marcaide, Ros, E., Ratner, M.I., Shapiro, I.I., Quirrenbach, & Witzel, A, 1998, A&A, 336, 385
- IERS Annual Report, (1996) IERS, IERS Annual Report 1995, Observatoire de Paris (1996)
- Lara et al., (1998) Lara, L., Marcaide, J.M., Alberdi, A., & Guirado, J.C., 1996, A&A, 314, 672
- Ma et al., (1990) Ma, C., Shaffer, D.B., de Vegt. C. Johnston, K.J., & Russell, J.L., 1990, AJ, 99, 1284
- Marcaide & Shapiro, (1983) Marcaide, J.M., & Shapiro, I.I., 1983, AJ, 88, 1133
- Ros et al., (1999) Ros, E., Marcaide, J.M., Guirado, J.C., Ratner, M.I., Shapiro, I.I., Krichbaum, T.P., Witzel, A., & Preston, R.A., 1999a, A&A, in press.
- Ros et al., (1999) Ros, E., Marcaide, J.M., Guirado, & Pérez-Torres, M.A., 1999b, A&SS, Proceedings of the 3rd Scientific Meeting of the Spanish Astronomical Society. Eds. Gorgas, J. & Zamorano, J., in press
- Shapiro et al., (1979) Shapiro, I.I., Wittels, J.J., Counselman III, C.C., Robertson, D.S., Whitney, A.R., Hinteregger, H.F., Knight, C.A., Rogers, A.E.E., Clark, T.A., Hutton, L.A., & Niell, A.E., 1979, AJ, 84, 1459
- Shepherd et al., (1995) Shepherd, M.C., Pearson, T.J., & Taylor, G.B. 1995, BAAS, 26, 987