On the origin of Damped Lyman– systems: a case for LSB galaxies?
Abstract
We use a model of galaxy disk formation to explore the metallicities, dust content, and neutral-gas mass density of damped Lyman- (DLy) absorbers. We find that the [Zn/H] abundance measurements of DLy systems now available can be reproduced either by a population of low surface brightness (LSB) galaxies forming at redshifts , whose chemical contents evolve slowly with time and whose star formation rates are described by continuous bursts, or by high surface brightness (HSB) galaxies which form continuously over an interval of (and no higher). Although, in reality, a mixture of galaxy types may be responsible for low DLy systems, our models predict that HSB galaxies form more dust, more rapidly, than LSB galaxies, and that HSB galaxies may therefore obscure background QSOs and not give rise to DLy lines, as suggested by other researchers. Significantly, we find that the rate at which HSB disks consume neutral gas is too fast to explain the observed evolution in the neutral gas mass density with redshift, and that the consumption of hydrogen by LSB galaxies better fits the data. This further suggests that LSB disks may dominate the DLy population at high-redshift.
1 Introduction
Since bright spiral disk galaxies contain most of the H I mass in the nearby universe (Rao & Briggs (1993)), it has always seemed likely that these types of galaxies — or at least their progenitors — would be the origin of the high-redshift DLy systems seen in background QSO spectra. The detection of DLy systems (Boisse et al. (1998); Turnshek (1997)) has now made it possible to search for the galaxies which cause the absorption. Although redshifts are largely unavailable for the objects imaged, recent observations suggest that a wide range of morphological types are responsible for the absorption (Lanzetta et al. (1997); Le Brun et al. (1997)), and that bright spiral galaxies do not dominate the DLy population. In particular, several low surface brightness (LSB) galaxies have been found close to QSO sightlines (Steidel et al. (1994); Le Brun et al. (1997)), while in one case, only an LSB or dwarf galaxy can account for the complete non-detection of a suitable galaxy responsible for a DLy line (Rao & Turnshek (1998)).
Further evidence that DLy systems may not originate in bright spiral galaxies, even at higher redshift, comes from measurements of the metallicity of the absorbing gas. The abundances of alpha elements in DLy systems do not appear to be enhanced relative to iron group elements but similar to the solar value (Molaro, Centurion & Vladillo 1998; Centurion et al. 1998), while the overall metallicity seems to remain low even at (Pettini et al. 1998). These results suggest that DLy lines may actually arise in systems which are less common than the main star-forming disks we see around us today. In this Letter we use our model of disk formation and evolution to explore differences in metallicity, dust content, and neutral-gas mass density between high surface brightness (HSB) and LSB galaxies. We find that we are able to better reproduce the observational data with models of LSB galaxies, and predict how future abundance measurements may be able to further differentiate between the two.
2 Disk Models
Several authors have shown how differences in surface brightness between galaxies can be readily understood if LSB galaxies are hosted in dark halos with values of the spin parameter, , of the dark halo (, where is the angular momentum, is the total energy and is the total mass of the halo) larger than those of HSB galaxies (Fall & Efstathiou (1980); Kashlinsky (1982); Dalcanton, Spergel & Summers (1997); Mo, Mao & White (1997); Jimenez et al. (1997)). Jimenez et al. (1998) used a detailed chemo-spectro-photometric disk model to show (abandoning the assumption of a constant ratio) that not only surface brightness, but also color, color gradients and metallicity of LSB disks can be explained if the spin parameter is larger for LSB than for HSB galaxies.
In order to investigate the properties of both HSB and LSB disks, and to determine whether their characteristics are akin to those identified in DLy systems, we have computed models of galactic disks with (HSBs) and (LSBs; see Jimenez et al. (1998)). The model is described in detail in Jimenez et al. (1997) and we only summarize it here. We assume that the specific angular momentum of baryonic matter is the same as the dark matter and that gas settles into a given dark halo until centrifugally supported . We also assume that the dark matter profile is that found in numerical simulations (Navarro, Frenk & White (1997)), although using the isothermal sphere profile does not significantly change the computed initial surface density for the settling disk. Once the initial surface density of the disks has been computed, we used the Schmidt law (Kennicutt (1998)) to compute the star formation rate. In particular, the SFR law adopted is , with and , and where is the gas surface density and is the total mass surface density. The HSB disks have a initial burst of star formation which then declines with time, while the LSB galaxies have constant, but less active, star-formation. The primordial gas infall rate in the disk is assumed to be the same function of total surface density as used in models of the Milky Way (see Jimenez et al. (1998)). The infall rate is higher in the center than in the outermost regions of the disk, with the infall law expressed as , where is the time-scale for the formation of the disk at a radius . The values of are chosen to fit the present time radial distribution of the gas surface density in the disk. In analogy with what is required for the disk of the Milky Way, we assumed is increasing towards larger radii (see Table 2 of Jimenez et al. (1998)). is the abundance of element in the infalling gas and the chemical composition is assumed to be primordial. The parameter is obtained by requiring the surface density now to be , so that . The evolution of several chemical species (H, D, He, C, N, O, Ne, Mg, Si, S, Ca, Fe and Zn), as well as the global metallicity , is followed by taking into account detailed nucleosynthesis prescriptions (Jimenez et al. 1998). The IMF is taken from Scalo (1986). For simplicity, we have adopted an Einstein-deSitter Universe (, , km s-1 Mpc-1). Non-zero values of actually strengthen the results discussed below.
3 Results
The initial goal of our modelling was to explore any differences in gas metallicity between HSB and LSB disks, to determine whether the measurements of [Zn/H] now available for DLy systems could discriminate between the two types of galaxies. In Figure 1 we plot the values of [Zn/H] found by Pettini et al. (1997 and refs. therein; 1998) against the redshift of the absorption systems. Our models enable us to plot the metallicity of gas disks as a function of redshift for both a given galactic radius, , and for a formation redshift. Hence, in Figure 1a, we plot the evolution in the metallicity of an LSB disk, forming at , at , 1.0, 2.5, and kpc. We take kpc to be the outer limit at which an LSB would still give rise to a DLy line; our models predict (H I) cm-2 at this radius for an LSB baryonic mass of . This agrees well with observed H I surface densities toward nearby LSB galaxies at similar radii (de Blok, McGaugh, & van der Hulst 1996).
In Figure 1b, we show the same variation in metallicity for 6 kpc but with the galaxy forming at 3.2, 2.2 and 1.4. Figure 1a clearly shows that the predicted metallicities of LSB galaxies fit the observed data very well, particularly at outer radii, where the absorption cross-section will be largest and hence where the majority of QSO sightlines will intercept. Figure 1b demonstrates, however, that such LSB disks must form at , and evolve slowly for such a model to be consistent with the data.
In contrast, Figure 1c shows the variation of metallicity with redshift for an HSB galaxy, again forming at , for 0, 4.0, 6.0 and kpc. The figure shows that HSB galaxies have enriched their ISMs much faster than LSB galaxies, leading to gas metallicities higher than observed. However, this does not rule out HSB disks as potential absorbers. Figure 1d shows that if HSB galaxy halos form over the range of redshifts measured for DLy systems, as is indeed the case in CDM cosmogonies (e.g., Peacock & Heavens (1985)), then it is possible to reproduce the [Zn/H] measurements. In this case, most of the DLy systems would be proto-galaxies in the very early stages of their evolution—it takes only 0.3 Gyr for HSB disks to reach [Zn/H] , close to the average measured value. We note that in our models, however, these proto-galaxies have not yet formed rotating disks, hence we would not expect the velocity profiles of metals absorption lines in DLy systems to be indicative of rotating disks. The fact that the profiles of metal lines do appear to support rotating thick-disk models (Wolfe & Prochaska (1998); Prochaska & Wolfe (1997)) tends to favor LSB disks. We note, however, that it remains possible that the initial merging of galaxy halos in a CDM-like scenario could still give rise to the observed line profiles (Haehnelt, Steinmetz, & Rauch 1998).
One possible way to distinguish between slowly evolving LSB disks and a continuously forming population of HSB galaxies is to consider the evolution of the dust content of each galaxy type. Figure 2 shows the dust formation rate for HSB and LSB disks at different radii (each radius normalized to M⊙). The amount of dust produced by each generation of stars was accounted for by using the model of Draine & Lee (1984). As expected, HSB disks form about twice as much dust as their LSB counterparts due to their higher metallicity. More importantly, however, HSB galaxies produce most of their dust during the first Gyr, reaching a maximum at an age of 0.3 Gyr. On the other hand, LSB galaxies produce virtually no dust at radii larger than kpc. Therefore, a population of continually forming proto-disks should quickly begin to obscure background QSOs, removing HSB disks from DLy samples, as suggested by other researchers (Fall & Pei (1993)). LSB galaxies, of course, remain largely unobscured, and would show up readily against background QSOs. If, in reality, it is a mixture of LSB and HSB galaxies which actually give rise to DLy systems, such an effect would at least explain why LSB galaxies have so readily been found responsible for low redshift DLy absorbers.
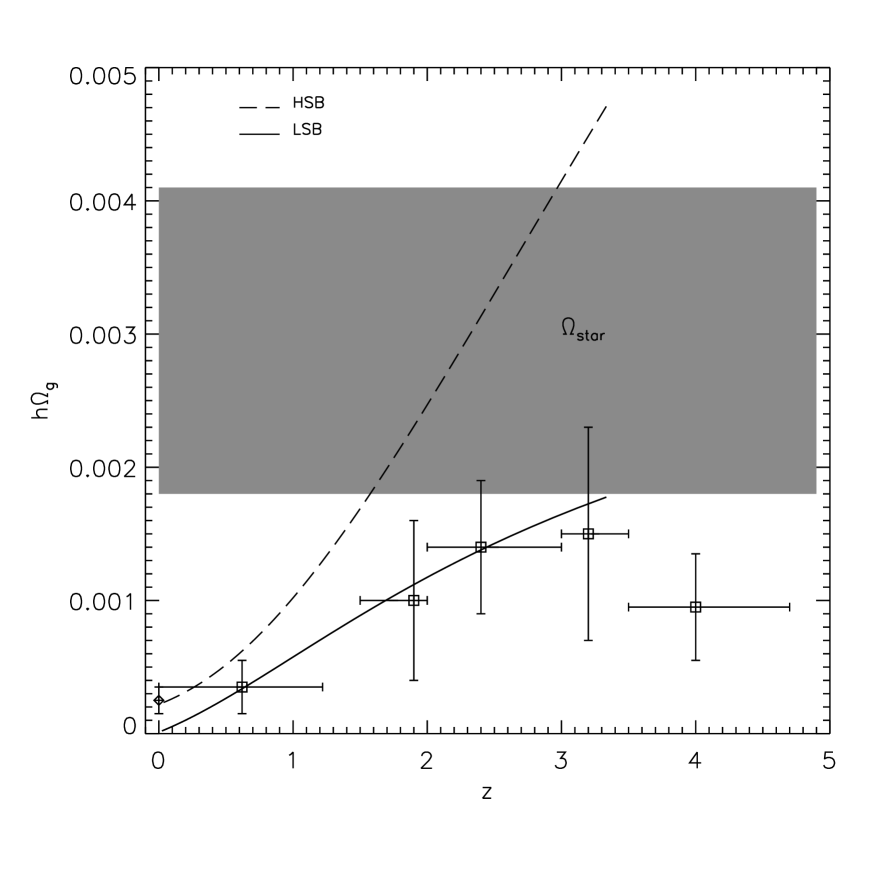
Our model predicts one more difference between the observable properties of DLy systems depending on whether HSB or LSB disks are responsible. DLy systems have been used to infer the evolution in the cosmological mass density of neutral gas in the universe, , from . In Figure 3 we reproduce the values of as a function of redshift (Storrie-Lombardi, McMahon & Irwin (1996)). We also show how H I gas is consumed by stars in our disk models, both for HSB (dashed line) and LSB (continuous line) galaxies. The curves are normalized such that that for LSB galaxies is zero at . The true value of for LSB galaxies clearly lies somewhere between 0 (an extreme limit which would assume that LSB disks have used up all their gas — at odds with the observations) and that observed for galaxies today, a value dominated by the contribution from spirals and irregular galaxies (Rao & Briggs 1993). As can be seen in Figure 3, however, this range is extremely small, and it matters little whether we set for LSB disks to zero or the value observed for all galaxy types. Surprisingly, the HSB galaxies do not reproduce the data particularly well—the amount of gas needed at high-redshift to reproduce the neutral gas density measured in the local universe is much higher than observed. On the other hand, LSB disks fit the data much better, since they have less efficient star formation and thus transform less H I into stars. It would seem, therefore, that DLy systems are very inefficient star producers.
The figure is also important in demonstrating that there need not be many LSB galaxies in the nearby universe to account for the number of DLy systems found at high redshift. Although plausible arguments have been made that the size and number density of LSB galaxies in the local universe are sufficient to explain the frequency of DLy systems at high redshift (Impey & Bothun (1997)), our models show that even if no LSB disks remained today, their gradual slow consumption of H I over time best fits the observed values of , and that HSB disks simply convert H I into stars too efficiently to account for those measurements.
4 Future work
Since the star formation histories in LSB and HSB galaxies are so different, our models make it possible to predict differences in the nucleid to iron-peak element ratios for the two types of galaxies. In particular, we would expect that at a fixed epoch HSB disks have [/Fe] ratios around zero or less and lower than [/Fe] ratios in LSB disks. This because at the same epoch LSB disks have lower Fe abundances than -element abundances relative to HSB disks. This difference is mostly due to the fact that -elements are produced on very short timescales by Type II SNe whereas Fe is produced on long timescales (from several tenths of million years to several Gyr) by Type Ia SNe. Therefore, the different star formation history affects iron more than -elements. This is contrary to what happens if one looks at the [/Fe] vs. [Fe/H] relation at a fixed [Fe/H] instead of at a fixed epoch. In this case, galaxies with lower star formation rate shows lower [/Fe] ratios (Matteucci (1991)) than systems with higher star formation rates.
This effect is clearly seen in Figure 4 where we plot the redshift evolution of [/Zn] for LSB (continuous line) and HSB (dashed line) galaxies formed at and 4.0, which encompasses a reasonable range in redshift for disk formation. As expected, the LSB disks have super-solar [/Zn] ratios during most of their evolution. The HSB galaxies exhibit super-solar ratios only during their first Gyr, but have mainly sub-solar ratios for the rest of their lives. It can be seen that any measured [/Zn] ratio at a given redshift is unique in determining whether the absorption originates in an LSB or HSB disk — although we only plot the curves after the first 0.4 Gyr of the disks’ formation, before which the [/Zn] ratio move vertically to higher values. Unfortunately, only two [/Zn] ratios have been measured in DLy systems (for systems), both of which are from observations of S II lines (see, e.g., Centurion et al. (1998) and refs. therein), plotted as diamonds in Figure 4. Both measurements have large errors, and it is clear that many, more accurate observations are needed in the future to determine the nature of the DLy population in the Universe.
References
- (1) de Blok, W. J. G., McGaugh, S. S., van der Hulst, J. M. 1996, MNRAS, 283, 18
- Boisse et al. (1998) Boisse P., Le Brun V., Bergeron J., Deharveng J.-M. 1998, A&A, 333, 841
- Centurion et al. (1998) Centurion M., Bonifacio P., Molaro P., Vladilo G. 1998, astro-ph/9807082
- Dalcanton, Spergel & Summers (1997) Dalcanton J. J., Spergel D. N., Summers F. J. 1997, ApJ, 482, 659
- Draine & Lee (1984) Draine B. T., Lee H. M. 1984, ApJ, 285, 89
- Fall & Efstathiou (1980) Fall S. M., Efstathiou G. 1980, MNRAS, 193, 189
- Fall & Pei (1993) Fall S. M., Pei Y. C. 1993, ApJ, 402, 479
- (8) Haehnelt, M. G., Steinmetz, M., & Rauch, M., 1998, ApJ, 495, 647
- Impey & Bothun (1997) Impey C., Bothun G. 1997, ARA&A, 35, 267
- Jimenez et al. (1997) Jimenez R., Heavens A., Hawkins M., Padoan P. 1997, MNRAS, 292, L5
- Jimenez et al. (1998) Jimenez R., Padoan P., Matteucci F., Heavens A. F. 1998, MNRAS, 299, 123
- Kashlinsky (1982) Kashlinsky A. 1982, MNRAS, 200, 585
- Kennicutt (1998) Kennicutt, Robert C. J. 1998, ApJ, 498, 541
- Lanzetta et al. (1997) Lanzetta K. M., Wolfe A. M., Altan H., Barcons X., Chen H.-W., Fernandez-Soto A., Meyer D. M., Ortiz-Gil A., Savaglio S., Webb J. K., Yahata N. 1997. AJ, 114, 1337
- Le Brun et al. (1997) Le Brun V., Bergeron J., Boisse P., Deharveng J. M. 1997, A&A, 321, 733
- Matteucci (1991) Matteucci F., 1991. In: Stellar evolution and galactic chemical evolution, SP Conf. Ser. 20: Frontiers of Stellar Evolution, pp 539.
- Mo, Mao & White (1997) Mo H. J., Mao S., White S. D. M. 1997, MNRAS, 295, 319
- Molaro, Centurion & Vladilo (1998) Molaro P., Centurion M., Vladilo G. 1998, MNRAS, 293, L37
- Navarro, Frenk & White (1997) Navarro J. F., Frenk C. S., White S. D. M. 1997, ApJ, 490, 493
- Peacock & Heavens (1985) Peacock J. A., Heavens A. F. 1985, MNRAS, 217, 805
- Pettini et al. (1998) Pettini M., Ellison S., Steidel C., Bowen D. 1998, astro-ph/9808017
- Prochaska & Wolfe (1997) Prochaska J. X., Wolfe A. M. 1997, ApJ, 487, 73
- Rao & Briggs (1993) Rao S., Briggs F. 1993, ApJ, 419, 515
- Rao & Turnshek (1998) Rao S., Turnshek D. 1998, astro-ph/9805093
- Roth & Blades (1995) Roth K. C., Blades J. C. 1995, ApJ, 445, L95
- Scalo (1986) Scalo J. M. 1986 Fundamentals of Cosmic Physics, 11, 1
- Steidel et al. (1994) Steidel C. C., Pettini M., Dickinson M., Persson S. E. 1994, AJ, 108, 2046
- Storrie-Lombardi, McMahon & Irwin (1996) Storrie-Lombardi L. J., McMahon R. G., Irwin M. J. 1996, MNRAS, 283, L79
- Turnshek (1997) Turnshek D. A., 1997. In: Structure & Evolution of the IGM from QSO Absorption Line Systems, 263, eds Petitjean P., Charlot S., France: Edit. Front.
- Wolfe & Prochaska (1998) Wolfe A. M., Prochaska J. X. 1998, ApJ, 494, L15
Figure Captions:
Figure 1: Redshift evolution of [Zn/H] for HSB (bottom panels) and LSB (upper panels) galaxies, as measured at different radii in a disk. a) The evolution in metallicity of LSB galaxies formed at well fits the values measured by Pettini et al. (1997; 1998). Also shown as a dashed box at is the range in metallicity of our own Galaxy (Roth & Blades (1995)); b) LSB disks that formed late, however, do not fit the data. c) Conversely, HSB disks that formed at become metal-rich too quickly to explain the observed values; d) only if there is a continuously forming population of HSB disks between can they account for the measured metallicities.
Figure 2: The dust formation rates for LSB and HSB galaxies, for several galactic radii. The dust production in LSB disks at kpc is negligible, while HSB disks produce a significant amount of dust at all radii in the early stages of their evolution. Such dust production may well obscure background QSOs and remove evolved HSB galaxies from DLy samples.
Figure 3: The evolution of neutral H I with redshift (Storrie-Lombardi, McMahon & Irwin (1996)) derived from DLy systems (squares). Also plotted are the predictions from our model for HSB (dashed line) and LSB (continuous line) galaxies, both normalized to the present day neutral H I abundances (Rao & Briggs (1993)). Both curves have been computed using an average of the radii larger than 6 kpc (HSB disks) and 2.5 kpc (LSB disks). We find that HSB galaxies require the existence of much more neutral gas at high redshift than is observed, because of their high star formation rates. LSB galaxies, however, provide an excellent fit to the data because their gas consumption is lower. This supports the idea that LSB galaxies may be responsible for most of the observed DLy lines even at high redshift.
Figure 4: Predictions from our models for [/Zn] ratios in DLy systems as a function of redshift. The diamonds correspond to measurements of [S/Zn] from the literature. LSB galaxies have super-solar values of [/Zn] since their low star formation rate means fewer Type Ia SNae produce smaller yields of Zn, even though the initial burst of star formation produced the same amount of elements from Type II SNae.