2 IPAC, California Institute of Technology, Pasadena, California 91125, US
3 Service d’Astrophysique/DAPNIA/DSM, CEA Saclay, 91191 Gif sur Yvette, France
4 Institut d’Astrophysique de Paris, 98 bis Boulevard ARAGO, 75014 Paris, France
5 Observatoire de Grenoble, BP 53, 414 rue de la piscine, 38041 Grenoble Cedex 9, France
6 Osservatorio Astronomico di Padova, 35122 Padova, Italy
7 ESO, Karl-Schwarzschild-Str, 2, D-85748 Garching bei Munchen
FIRBACK: I. A deep survey at 175 with ISO, preliminary results
1 Abstract
FIRBACK is a deep survey conducted with the ISOPHOT instrument aboard the Infrared Space Observatory (ISO) at an effective wavelength of 175 m. We present here results we have obtained on the first field, the so-called Marano1 which covers around 0.25 square degree. We find that the source density for objects with a flux above 200 mJy exceeds the counts expected for sources found in the IRAS deep surveys with a similar flux by about an order of magnitude. Such an excess was expected on the basis of the high far infrared background detected with the FIRAS and DIRBE instruments aboard the Cosmic Background Explorer (COBE). These sources are likely to be redshifted infrared galaxies. The steep number counts indicate strong cosmological evolution in this population. The detected sources account for only 10 of the cosmic IR background. An extrapolation of the counts down to about 10 mJy would be needeed to account for the whole background at this wavelength.
2 Introduction
New windows are opening in the nearly unexplored evolution of distant galaxies at infrared and submillimetre wavelengths. Significant progress in the knowledge of IR/submm emission of moderate – and high – redshift sources is now possible. Deep surveys in the mid infrared with the Infared Space Observatory camera (ISOCAM) (Cesarsky et al. 1996) and in the far infrared with the photometer ISOPHOT (Lemke et al. 1996) were designed to yield strong constraints on galaxy evolution at these wavelengths. In this paper we present the first results of a deep survey with ISOPHOT at m.
For some time, astronomers have suspected the importance of the “optically dark” side of galaxy evolution where stellar UV/optical light due to star formation is reprocessed to thermal radiation by dust (for example Setti and Woltjer 1970; Stecker, Puget and Fazio 1977). The IRAS all-sky survey unveiled a local population of infrared galaxies ranging from normal spirals to the spectacular luminous and ultraluminous infrared galaxies (resp. LIRGs and ULIRGs), but only a handful of these sources had a significant redshift. Thus, our knowledge of the dark side of galaxy evolution has so–far been limited to local or low–redshift galaxies. At present about one third of the bolometric luminosity released by stars finally escapes galaxies at IR/submm wavelengths (Soifer and Neugebauer, 1991). A large fraction of this is associated with star formation. With their limited sensitivity, deep IRAS surveys were unable to probe redshifts larger than (Ashby et al. 1996), although they already show a significant evolution in number counts (see e.g. Bertin et al. 1997).
A host of observational evidence seems to directly demonstrate the presence of dust at higher z. For instance, IRAS identified IRAS F10214+4724, a very peculiar, “hyperluminous” galaxy at (Rowan–Robinson et al., 1991). This object was detected by IRAS because it is strongly magnified by gravitational lensing (Serjeant et al. 1995, Eisenhardt et al., 1996). It probably has many counterparts which are so far undetected. About twenty radiogalaxies and quasars have also been observed at submm/mm wavelengths (see e.g. Hughes et al., 1997; and references therein). Although their evolutionary status is not completely understood, the most likely interpretation is that the submm emission is mostly due to dust heated by star formation in the host galaxies.
A spectacular breakthrough was recently achieved with the detection of the long–sought “Cosmic Infrared Background” (hereafter CIRB) in FIRAS residuals between 200 m and 2 mm (Puget et al., 1996; Guiderdoni et al., 1997, hereafter GBPLH; Fixsen et al., 1998; Lagache et al., 1998), and in DIRBE residuals at 140 and 240 m (Schlegel et al., 1997; Hauser et al., 1998; Dwek et al., 1998; Lagache et al., 1998). The background is produced by the line–of–sight accumulation of extragalactic sources. The level of the CIRB is significantly higher than the lower limits on the “Cosmic Optical Background” (hereafter COB) given by summing faint galaxy counts that probably lie close to convergence (Williams et al., 1996). This is a strong evidence that a significant fraction of star formation is hidden from optical observations and observable only at far infrared and submillimeter wavelengths.
With the rapid development of the case for dust at high redshift, theoretical efforts have led to detailed modelling of spectral evolution at IR/submm wavelengths (Franceschini et al. 1991, 1994, 1998). These spectral energy distributions can be consistently implemented in the general framework of hierarchical clustering (GBPLH; Guiderdoni et al., 1998). The generic prediction of these models is a high level of IR/submm emission due to the continuous formation of large galaxies through the merging of smaller ones. This model has allowed GBPLH to predict the decomposition of the CIRB into faint galaxy counts. A family of scenarios was generated that agree with local IR constraints (IRAS luminosty functions and faint counts), and various levels of evolution consistent with the observed CIRB in FIRAS residuals. The authors concluded their analysis by showing that, counts at 15 m and 60 m were relatively insensitive to the details of the scenarios, but that submm counts could provide constraints strong enough to break the degeneracy. There are three reasons for this specific behaviour: (1) The rest-frame wavelength range around 100 m encompasses the bulk of IR emission due to star formation, while the 15 m band probes the fraction of radiation absorbed by the Polycyclic Aromatic Hydrocarbons which is less directly related to the total output and thus not a reliable tracer of star formation. (2) The cosmic star formation rate density directly seen at UV wavelengths strongly increases between and 1.5 (Lilly et al. 1996). It is likely that similar behaviour appears in the IR. (3) Because of the shape of the spectral energy distribution, the –correction is negative at 175 m and the detection of galaxies at is favoured (Blain & Longair, 1996).
Consequently, GBPLH proposed the concept of a deep ISOPHOT survey with the C160 filter (effective wavelength 175 m). To provide sufficient constraints on the models, the exposure times per pointing had to reach to 20 mJy. This deep ISOPHOT survey was expected to yield a probe of galaxy evolution complementary to deep ISOCAM surveys. In the IR range, the ISO deep surveys follow-up has given number counts at 15 (Oliver et al., 1997; Désert et al., 1998; Aussel et al., 1998) and 7 (Taniguchi et al., 1998). Kawara et al. (1998) have conducted a deep survey at 175 in the Lockman Hole region. At the other end of the submillimetre decade, the first deep survey obtained with SCUBA on the JCMT has also unveiled a population of submm sources with number counts much larger than the no–evolution predictions (Smail et al., 1997,1998; Hughes et al., 1998; Barger et al., 1998).
Herein we present the first results of this ISOPHOT survey as implemented in the Marano field. An area of 0.25 square degree was covered and a detection level of 100 mJy (5) was reached. As anticipated from the level of the CIRB, a large number of sources was found, much larger than the predictions based on IRAS luminosity functions without strong evolution. Section 3 summarizes our observations. Section 4 explains the data reduction and calibration methods. Section 5 gives the resulting maps and source catalogs. These results are discussed in section 6, which compares the observed number counts with model predictions and IRAS 60 counts. Section 7 provides our provisional conclusions. Forthcoming papers in this series will present the complete survey, elaborate the constraints on the models and detail the identification and follow-up strategy and results.
3 Observations
The observations were performed at an effective wavelength of 175 with the C200 array (2x2 pixels) of ISOPHOT. The pixel field of view is 1.5 arcmin. The AOT PHT22 was used with the C160 filter. The observations consist of four 19x19 rasters centred on (RA,DEC) in J2000 equal to (03h13m25.6s, -55d03m43.9s), (03h13m9.6s, -55d01m26.0s), (03h12m53.6s, -55d03m43.9s) and (03h13m9.6s, -55d06m25.4s) respectively. Each raster was performed in the spacecraft (Y,Z) coordinate system which is parallel to the edges of the detector array. The field area covered by each raster is about 30’x30’. The exposure time is 16s per pixel. Rasters were performed with one pixel overlap in both Y and Z direction. Therefore, for the maximum redundancy region, the effective exposure time is 256 sec per sky position (16 sec per pixel, 4 rasters and redundancy of 4). Displacements between the four raster centers correspond to 2 pixels. This mode of observation, which does not provide proper sampling of the point-spread-function (PSF), was chosen to assess the reliability of faint source observations with ISOPHOT at a time when this was in question.
4 Data reduction
We use PIA, the ISOPHOT interactive analysis software version 6.4 (Gabriel et al., 1997), to correct for instrumental effects, the glitches induced by cosmic particles and to provide an initial calibration. First we apply the non-linearity correction due to 2 independent effects: the non-linearity of the Cold Readout Electronics and the downward curving ramp due to de-biasing. Deglitching is performed for each individual ramp and then the mean signal per position is derived by averaging the linear fit on each ramp (see Gabriel et al., 1997 for details). The signal shows a long term drift which is corrected by using the two internal calibration (FCS) measurements bracketing each individual observation. Inside each raster, the long term drift represents less than 10 of the signal. The calibration is performed by deriving the mean value of the two FCS measurements. The contribution of the long term drift is thus lower than 5. Flat fielding is achieved using the high redundancy in the measurements: we compare the fluxes over all positions (which have a redudancy of 4) and derive the difference in responsivity between the four pixels for each raster. Glitches inducing long term drifts are also corrected. The flux is finally projected on a 5”x5” coordinate grid using our own projection procedure.
We compare the average surface brightness as given by PIAv6.4 with that derived from an interpolation of DIRBE data at 100, 140 and 240. The value found by PIA is a factor 2.5 greater than that from DIRBE. This discrepancy results mainly from the fact that the solid angle used for the extended source calibration in PIAv6.4 is the solid angle of one pixel and not the integral of the Point Spread Function (PSF). When the solid angle is computed using the PSF wing measurements on Saturn (Toth et al., 1997), it is equal to 2.2 times the solid angle of the pixel. The PSF determined in this way is shown Fig. 1. When we correct the PIA calibration by this factor, this leads to a calibration difference with DIRBE of only , well within the combined uncertainties of the PHOT point source calibration and the solid angle. We conclude that the PHOT calibration established with strong sources can be extrapolated to lower fluxes, such as the flux from the background, but that the proper PSF must be taken into account. In the present work, we thus adopt a calibration based on the DIRBE fluxes. Errors estimates given by the PIA are much smaller than the systematic errors. The two mains ones are the photometric calibration uncertainty itself, which cannot be larger than 15 on the basis of the good agreement with the DIRBE brightness, and the uncertainty on the PSF. The PSF we use is based on the Saturn measurements and differs from the models (used in the most recent version of the PIA) by a factor around 1.3. Alltogether, for point sources, we thus estimate an uncertainty of about 30 .

5 Results
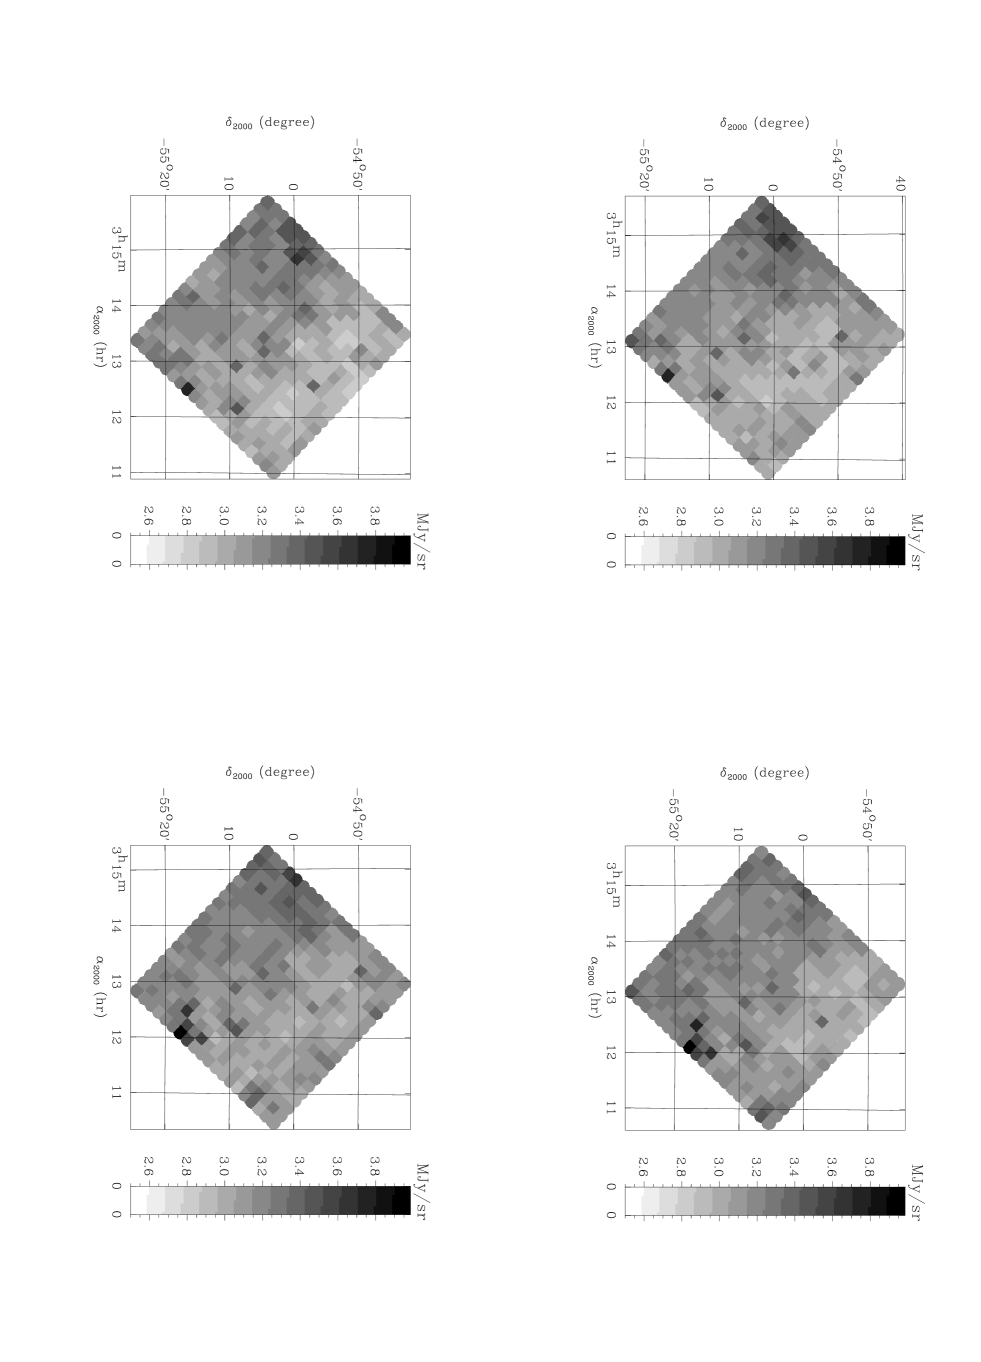
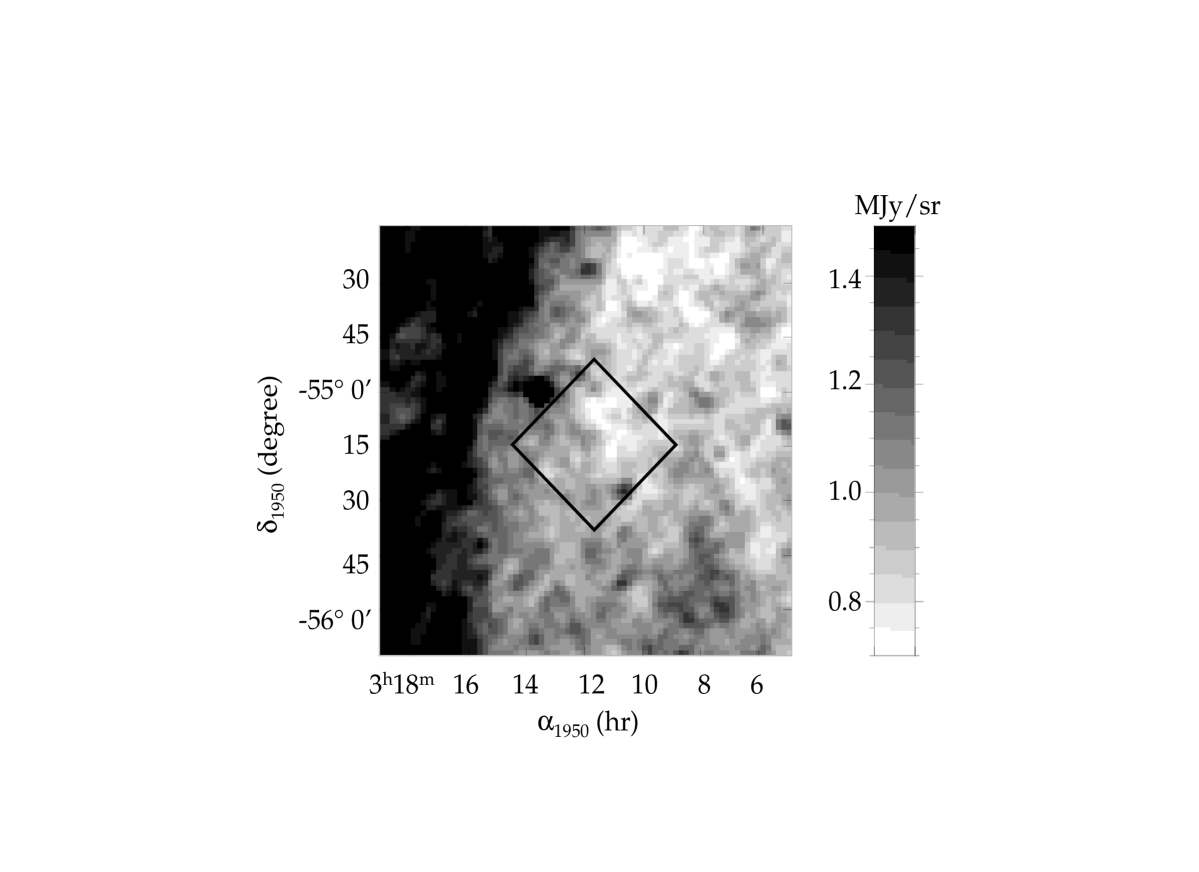
Fig. 2 shows 4 images each made from one individual raster. The comparison of these images shows a high degree of correlation. The same large scale structure is seen in the four rasters. This structure corresponds to the edge of a cirrus cloud already detected with IRAS data at 100 micron (Fig. 3). Smaller structures are also very well reproduced in the four rasters. These small scale structures are due to the combination of point sources, the background of unresolved sources and cirrus fluctuations. Differences between independent raster maps yield a residual rms fluctuation of 0.055 MJy/sr. This leads to a noise in the final four coadded maps 2 times smaller or 1.96 10-2 MJy/sr (3.7 mJy per 92” pixel) which is representative of the detector noise, but only an upper limit since it includes some residual differences in the response between individual rasters. The brightness variations in the maps have a rms value of 0.13 MJy/sr and are probably dominated by the cirrus component. Cirrus clouds are known to have a steep power spectrum (Gautier et al., 1992) proportional to and thus gives strong brightness variations only at large scales. The brightness is on average equal to 3.16 MJy/sr and varies from 2.9 to 3.3 MJy/sr for the diffuse emission. This brightness is composed of an extragalactic background of 1 MJy/sr (Lagache et al., 1998), zodiacal emission around 0.7 MJy/sr (based on the W.T. Reach model, private communication) and cirrus of around 1.46 MJy/sr. Most of the large scale variations is attributed to the cirrus component which varies from 1.2 and 1.6 MJy/sr. Point-like sources are also clearly visible.
We extract these sources by comparing the contrast between each pixel
on the sky with the surrounding ones. We keep only sources
for which the contrast is greater than 0.03 MJy/sr, the signal to noise ratio
greater than 3 and sources seen in at
least 3 rasters in the region of maximum
redundancy (observed 4 times)
and in all rasters available for regions on the edges.
The main limitation to the photometry of these sources
is the poor PSF sampling.
The determination of the flux is done
by using only the central part of the PSF. We do aperture photometry; we derive
the flux within an inner radius of 60” and remove a reference background
computed between the inner radius of 60” and an outer radius of 92”.
With the PSF such as the one displayed in Fig.1, the reference background is strongly
contaminated by the source.
The total flux from a source is 4.75 times the measured one obtained with the procedure
described just above.
Furthermore, the fluxes are also
multiplied by 1.1 to correct for the transient effect estimated to be about
. Thus, all the measured fluxes (and therefore the noise
mesurements) must be multiplied by 4.75 and 1.1.
| RA (J2000) | DEC (J2000) | Flux (mJy) | S/B | n1 | n2 | Comments | |
|---|---|---|---|---|---|---|---|
| 0 | 3 12 5.0 | -55 17 44.4 | 849 | 37.9 | 2 | 2 | region 2. Large spiral galaxy ESO155-10 |
| 1 | 3 12 28.9 | -55 16 40.5 | 479 | 21.4 | 4 | 4 | region 2 |
| 2 | 3 11 59.3 | -55 14 30.3 | 375 | 16.7 | 2 | 2 | region 2 |
| 3 | 3 12 33.3 | -54 57 5.9 | 337 | 15.0 | 4 | 4 | isolated |
| 4 | 3 12 8.5 | -55 08 55.2 | 323 | 14.4 | 4 | 4 | isolated |
| 5 | 3 13 5.6 | -55 26 50.2 | 312 | 13.9 | 1 | 1 | isolated |
| 6 | 3 12 53.9 | -55 09 5.3 | 265 | 11.8 | 4 | 4 | isolated |
| 7 | 3 13 11.3 | -54 49 33.8 | 246 | 11.0 | 4 | 4 | isolated |
| 8 | 3 12 26.3 | -54 47 7.4 | 212 | 9.5 | 2 | 2 | isolated |
| 9 | 3 14 50.0 | -54 59 33.6 | 201 | 8.9 | 4 | 4 | region 1 |
| 10 | 3 10 53.4 | -55 06 25.4 | 199 | 8.9 | 2 | 2 | region 3 |
| 11 | 3 14 8.8 | -55 15 58.3 | 191 | 8.5 | 2 | 2 | isolated |
| 12 | 3 13 9.8 | -55 04 50.2 | 184 | 8.2 | 4 | 4 | isolated |
| 13 | 3 15 18.9 | -55 01 37.2 | 180 | 8.0 | 2 | 2 | region 1 |
| 14 | 3 13 6.4 | -55 17 47.1 | 151 | 6.7 | 4 | 4 | not very isolated |
| 15 | 3 14 57.1 | -54 58 11.6 | 147 | 6.6 | 2 | 2 | region 1 |
| 16 | 3 13 50.5 | -54 50 53.6 | 146 | 6.5 | 4 | 4 | isolated |
| 17 | 3 14 57.6 | -55 00 48.4 | 142 | 6.3 | 4 | 4 | region 1 |
| 18 | 3 10 45.1 | -55 03 15.8 | 135 | 6.0 | 1 | 1 | isolated |
| 19 | 3 12 41.1 | -54 53 49.4 | 134 | 6.0 | 4 | 4 | isolated |
| 20 | 3 14 40.3 | -55 05 6.1 | 126 | 5.6 | 4 | 4 | in cirrus emission |
| 21 | 3 13 55.3 | -54 58 21.8 | 124 | 5.5 | 4 | 3 | not very isolated; double radio source ID |
| 22 | 3 13 25.4 | -55 04 41.6 | 108 | 4.8 | 4 | 3 | Near source number 12 |
| 23 | 3 12 49.1 | -55 03 45.2 | 107 | 4.7 | 4 | 4 | isolated |
Table 1 gives the catalog of the extracted sources. We have defined three
regions corresponding to higher IRAS 100 fluxes
in which several ISOPHOT sources are detected. These regions
are dominated by source confusion and not by the cirrus confusion.
The first one (region 1
in Table 1) is located around RA=3h14mn50s and DEC=-55d0’48”, the second
(region 2) around RA=3h12mn20s and DEC=-55d16’00” and the third (region 3)
around RA=3h11mn00s and DEC=-55d06’00”.
Region 2 corresponds to the IRAS faint source
F03108-5528 and is likely associated with the large spiral galaxy
ESO155-10. In this region, 3 sources are detected with ISOPHOT. Because
of the poor sampling, after extraction of the brightest sources (24 sources
included in the catalog), the extraction of potential weaker sources
becomes very dependant on the
poorly determined positions of the bright sources (eg. sources
number 15, 17 and 22). For this reason, more sources are
probably detectable with a similar integration time and proper sampling.
Although we do not expect
a significant number of spurious sources due
to small scale cirrus structures for a k-3 cirrus power spectrum, we
test this conclusion by comparing the
number of sources detected in the two halves
of the area observed defined by
their cirrus content. We separate the map into two equal parts:
the first where the cirrus flux is greater than the median flux of
the map, and the second where
the flux is lower. In the first part,
we detect 13 sources and in
the second, 11 sources. We do not detect significantly
more sources in the brightest part of the map.
The level of cirrus clouds fluctuations is known to increase with the
average brightness to the 3/2 power (Gautier et al., 1992).
For the variations of the cirrus brightness given above, we would expect a 50
excess in the cirrus fluctuation over the map. The excess found is only 18, which
is significantly smaller. This result is in agreement with the estimate of the cirrus
confusion noise quoted below which predicts a negligeable number of spurious
Galactic sources.
The measurement noise of the sources is estimated by computing the flux of the sources in the 16 independent maps obtained in the maximum redundancy region. We find a median rms noise of 2.48 mJy in the measured signal through our spatial filter which leads to an rms noise of 12.96 mJy on the source fluxes. This includes the detector noise but not the confusion noise from the combination of cirrus and weak sources. To estimate the total noise, we measure the rms fluctuations on the map after convolution with our aperture photometry filter. The histogram of this flux, centred on 0, has a dispersion of 4.30 mJy which is a good estimate of the total noise. Thus, the total noise in the measured fluxes is 22.47 mJy; detector noise in this measurement being 12.96 mJy, the total sky confusion noise is thus about 18.35 mJy. This shows that sky confusion is the dominant source of noise. For the fraction of the brightness attributed to the cirrus (1.46 MJy/sr on average) and assuming a power spectrum in k-3 (Gautier et al., 1992), for the spatial filter used, we predict a contribution to the sky confusion noise of only 4.70 mJy for the cirrus out of a total of 18.35 mJy. A detailed analysis of the various noise components has been performed (Lagache, 1998) and will be presented in a forthcoming paper. For sources at the five sigma level, we don’t expect any isolated sources to be of Galactic cirrus origin. Howevever, in region 1, where there is a peak of emission, one could question if the sources could be due to a strong cirrus peak. In this unlikely hypothesis, this would reduce at most the number of sources from 24 to 21.
6 Discussion
6.1 Galaxy counts
Fig. 4 shows the number counts obtained for sources above 120 mJy ( limit, 22 sources) and 200 mJy (10 sources). One sigma uncertainties on the fluxes are equal to 22.47 mJy. Uncertainties in the number counts are the statistical errors.

The signal to noise of our observation is large as shown by the reproductibility
(see Fig. 2) and the excellent agreement between the flux of the sources measured in the
four independent rasters (Sect.5). Thus, the main problem for the completness is
dominated by the effect of sources falling close to pixel edges, which can be
computed exactly, and the confusion between sources. The limited area in the present survey
do not allow a proper evaluation of the incompleteness due to sky confusion.
Thus, we have computed
the incompleteness correction for the beam pattern given in Fig. 1 and the
contrast criterium given in Sect.5.
For example at 120 mJy, 41 of sources are lost,
and 20 at 300 mJy. To correct the integral counts, we need to know
the slope which is
not strongly constrained by our limited statistic.
We show in section 6.2 that the IRAS counts at
60 m from the deep ecliptic pole survey
(Hacking & Houck, 1987) and the colors of the IRAS galaxies
can be used to demonstrate that counts at 175 m must have a slope steeper
than 1.5 to converge towards the IRAS counts extrapolated to 175 m.
Using the serendipity number counts at 175 (Stickel et al.,1998),
we obtain a slope of -1.9.
We choose to use a conservative 1.5 slope (that expected for a Euclidean
distribution) to fit our counts in order to compute our
incompleteness correction on the integral counts. We
use the following representation for the uncorrected data:
N() = 2.89 105
with = 120 mJy.
After correction for incompleteness the counts become
N()= 4.04 105
valid between 120 and 200 mJy.
Raw number counts in the Lockman Hole region, reported in Kawara et al. (1998),
are a factor 1.6, in number, or 1.4 in flux below our uncorrected counts.
This discrepancy is comparable with the statistical errors. Furthermore,
significant differences in calibration are likely to be present as
Kawara et al. have used the extrapolation of the spectrum of an
IRAS source to calibrate their point source fluxes.
Fig. 4 also shows predicted number counts from four models
already published (Franceschini et al., 1998 and
Guiderdoni et al., 1998).
Our number counts are above the two minimal models from Franceschini et al. (1997)
with no evolution and Guiderdoni et al. (1998) with no Ultra-Luminous IR Galaxies
(ULIRGs),
by a factor close to 10. Therefore,
the survey shows clear evidence for strong evolution of galaxies
at 175 .
Our counts are above model E of Guiderdoni et al. (1998) by a factor of 3,
and the evolution model of Franceschini et al. (1997) by a factor 2.
Sources above 120 mJy contribute for 0.1 MJy/sr which represents
10 of the best determination of the submillimeter extragalactic
background found in the FIRAS data
(GBPLH; Fixsen et al., 1998; Lagache et al., 1998). An extrapolation
of the counts given above finds that sources
brighter than 8.5 mJy can provide the whole background.
| name | 60/175 color | Log(Lir) (L⊙) | Nature |
|---|---|---|---|
| NGC 41021 | 2.3 | 10.02 | Starburst |
| NGC 44181 | 1.8 | 10.72 | |
| NGC 60001 | 1.7 | 10.62 | Starburst |
| Mrk 2311 | 2.7 | 12.12 | Seyfert |
| NGC 60903 | 0.7 | 10.6 | Merger |
| ARP 2204 | 2.2 | 12.1 | Merger |
| NGC 62434 | 2.0 | 11.7 | Merger |
| ARP 2444 | 0.8 | 10.8 | Merger |
1 Roche and Chandler (1993)
2 Roche et al. (1991)
3 Acosta-Pulido et al. (1996)
4 Klaas et al. (1998)
6.2 FIR properties
Deep IRAS galaxy counts at 60 go down to 110 mJy (Bertin et al., 1997).
These sources are dominated by low redshift sources (z0.2).
Such nearby galaxies have been shown to have a far-IR Spectral Energy
Distribution dependent on
the luminosity (Soifer and Neugebauer, 1991).
Using a combination of IRAS, ISO and
ground based measurements,
we deduce a 60/175 color ratio for a number of galaxies (Table 2).
The color ratios go from 0.7 to 2.7.
Using this constraint on the colors,
,
appropriate for starburst galaxies,
and galaxy counts from Lonsdale et al. (1990) and Bertin et al. (1997),
one can make a crude prediction for the 175 counts
due to low redshift IRAS galaxies. The number of galaxies
at 175 induced by these low redshift IRAS galaxies ()
is:
where is the number of IRAS galaxies. At 200 mJy, this contribution from 60 m detected IRAS galaxies is lower than the 175 counts by a factor larger than 10. Measurements at the same wavelength from the Serendipity ISOPHOT survey (Stickel et al., 1998), as shown in Fig.4, gives a mean 175 over 60 color ratio around 2. This sample selected on the 100 data give an upper limit for the color ratio. Even using this ratio, we still conclude that the 175 counts are a factor around 10 greater than the IRAS extrapolated counts.
7 Conclusion
We have conducted a deep survey at 175 m in search of the
objects responsible for the recently discovered CIRB. Our survey finds
a large population of point sources. Number counts for this population
are considerably in excess of those expected for the local FIR population
discovered by IRAS, but are in line with models that account for
the CIRB.
We have shown that most of the 175 sources detected
in this survey have a much higher
ratio than the IRAS galaxies.
These sources are thus
either a new population
of nearby very cold galaxies or, more likely, are more distant sources
(at typical redshifts 1 to 2). The models (Franceschini et al., 1998,
and Guiderdoni et al., 1998) predict
redshift distributions with a median around 1.
In view of the steepness of the counts, the sources which account
for the bulk of the far infrared background probably have fluxes
around 10 mJy. Several followup programmes are underway to identify
counterparts of these 175 m sources at other wavelengths,
whilst the
175 m survey program has been substantially expanded.
Acknowledgements:
We would like to thanks the ISOPHOT team for many helpful discussions and
anonymous referee for useful comments.
References
- [1996] Acosta-Pulido, J.A, et al. 1996, A&A 315, L121
- [1998] Aussel, H., Cesarsky, C. J., Elbaz, D. and Starck, J. L., A&A, 1998, in press
- [] Ashby, M.L.N., Hacking, P.B., Houck, J.R., Soifer, B.T., Weisstein, E.W., 1996, ApJ 456, 428
- [] Barger A.J., et al., 1998, Nature 394, 248
- [1997] Bertin, E., Dennefeld, M., Moshir, M., 1997, A&A 323, 685
- [] Blain, A.W., & Longair M.S., 1996, MNRAS 279, 847
- [1996] Cesarsky et al. 1996, A&A 315, L32
- [] Désert, F.X., et al., 1998, A&A, in press
- [1998] Dwek, E., et al., 1998, astro-ph/9806129
- [] Eisenhardt, P., Armus, L., Hogg, D.W., Soifer, B.T., Neugebauer, G., Werner, M.W., 1996, ApJ 461, 72
- [1997] Franceschini, A., et al. 1998, MNRAS 296, 709
- [1994] Franceschini, A., Mazzei, P., De Zotti, G., Danese, L. 1994, ApJ 427, 140
- [1991] Franceschini, A., Toffolatti, L., Mazzei, P., Danese, L., & De Zotti, G., 1991, ApJSS 89, 285
- [1998] Fixsen, D. J., Dwek, E. , Mather, J. C., Bennet, C. L. and Shafer R. A. 1998, astro-ph/9803021
- [1997] Gabriel, C., et al. 1997, ADASS VI, ASP Conference Series, vol 125, G. Hunt & H.E. Payne Ed., p108
- [1992] Gautier, T. N., III, Boulanger, F., Perault, M., Puget, J. L., 1992, AJ 103, 1313
- [1997] Guiderdoni et al., 1997, Nature, 390, 20-11-97 (GBPLH)
- [1997] Guiderdoni et al., 1998, MNRAS 295, 877
- [] Hacking, P., Houck, J.R., 1987, ApJS 63, 311
- [1998] Hauser, M.G. et al., 1998, ApJ, astro-ph/9806167
- [] Hughes, D.H., Dunlop, J.S., Rawlings, S., 1997, astro-ph/9705094
- [] Hughes, D.H., et al., 1998, astroph/9806297
- [] Kawara, K., et al., 1998, A&A 336, L9
- [1997] Klaas et al., 1997, A&A, 325, L21
- [1998] Lagache, G., Abergel, A., Boulanger, F. Desert, F. X. and Puget, J.L., 1998, accepted for publication in A&A
- [1998t] Lagache, G., 1998, PhD thesis, University of Paris XI
- [] Lemke, D.,S et al. 1996, A&A 315, L64
- [] Lilly, S.J., Le Fèvre, O., Hammer, F., Crampton, D., 1996, ApJ 460, L1
- [1998] Lonsdale, C.J. et al., 1990, ApJ 358, 80
- [] Oliver, S.J., Goldschmidt, P., et al., 1997, MNRAS 847, 1
- [] Puget, J.L., Abergel, A., Boulanger, F., Bernard, J.P., Burton, W.B., et al., 1996, A&A 308, L5
- [1993] Roche, P.F., Chandler, C.J., 1993, MNRAS 265, 486
- [1991] Roche, P.F. et al., 1991, MNRAS 248, 606
- [1991] Rowan–Robinson, M., et al., 1991, Nature 351, 719
- [1997] Schlegel, D. J., Finkbeiner, D. P. and Davis, M., 1997, AAS 191, 87.04S
- [1995] Serjeant, S., 1995, MNRAS 276, 31
- [1970] Setti, G. & Woltjer, L. 1970, Nature 227, 586
- [1997] Smail et al., 1997, ApJ 490, L5
- [1998] Smail et al., 1998, astro-ph/9806061
- [1991] Soifer, B.T. and Neugebauer, G. 1991, AJ 101, 1
- [1977S] Stecker, F. W. , Puget, J.L. and Fazio, G. G. 1977, ApJ 214, L51
- [] Stickel, M., et al., 1998, A&A 336, 116
- [1992] Toth, L. V., Abraham. P. and Stickel M. 1997, ISOPHOT internal report
- [1998] Taniguchi, Y., et al., 1998, A&A, in press
- [1996] Williams, R.E. et al., 1996, AJ 112, 1335