Rotation Curves and M/L Evolution for Galaxies to
Mass Estimates of Starbursting Galaxies: Line Widths versus Near-IR Luminosities
Galaxy Kinematics with Integral Field Spectroscopy
Abstract
We present results from an on-going [O II] 3727 and H rotation-curve survey to study the evolution of the mass-to-light ratio (M/L) of spiral galaxies selected over a wide, well-defined range in rest-frame color to . Optical–near-infrared photometry and long-slit spectra are combined to measure residuals from a fiducial Tully-Fisher (TF) relation as a function of redshift and galaxy spectral type. While we do find a type-dependence in the -band TF relation, there is little evidence the dependence has changed with look-back time. Larger or more detailed kinematic studies will yield further insights. We demonstrate, for example, how integral field spectroscopy will provide fundamentally new and more precise information about the evolution of star-forming disks.
keywords:
M/L, Tully-Fisher, Evolutionkeywords:
Integral Field Spectroscopy, Disk Kinematics1 Evolution of star-forming galaxies
The study of galaxy evolution has focused largely on the relative frequency (counts) of photometric properties as a function of redshift and magnitude, such as luminosity, color, and image structure. To this it is now possible to add kinematic estimates of mass. Measurements of global changes in mass and light, M/L, are sensitive to both the star-formation and mass assembly histories of galaxies. For some galaxies, such as starbursts (see Jangren et al., these proceedings, for an extreme example), mass may change abruptly via merging events. The disks of large galaxies seen today, however, are presumably long-lived; these dynamically cold disks, if they have accreted matter in recent times, have done so slowly. On the other hand, galaxy formation models require today’s disks to form late, at (Mo et al. 1998; Weil et al. 1998). Optical rotation curve measurements can probe this intermediate redshift regime directly.
Over the past year we have begun a rotation-curve survey at Palomar Observatory of galaxies selected between . This survey extends the rotation-curve sample of Bershady, Mihos & Koo obtained at Lick Observatory (Bershady 1997) both in redshift, luminosity, and galaxy type. While the Lick sample was purposefully limited to the brightest, late-type galaxies with the reddest optical-infrared colors, the Palomar sample is representative of the observed distribution for colors bluer than an un-evolving Sa galaxy and L0.1L*. The hall-mark of the combined data set is (a) simultaneous, spatially resolved kinematic measurements made in [O II] and H at all redshifts; (b) pre-existing multi-band images, and (c) a well defined parent sample (Munn et al. 1997) with spectroscopic redshifts. The combined samples now number 40 galaxies with high-quality rotation curves. We find [O II] rotation curves are generally of lower quality than H both in spatial extent, S/N, and spectral resolution. The results presented here use H rotation curves only.

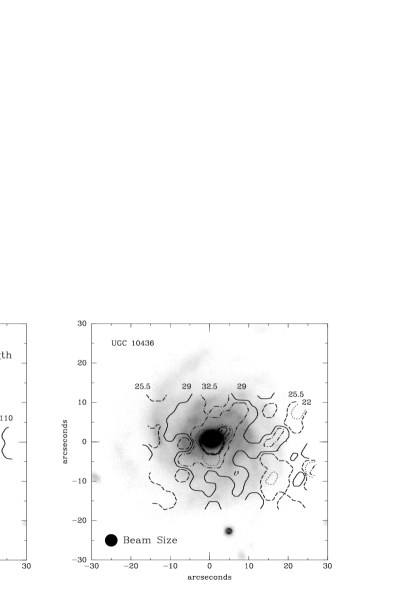
Figure 1 shows the residuals from a fiducial -band Tully-Fisher relation as a function of rest-frame B-R color and redshift for 26 galaxies currently analyzed from our sample. Since the cosmological dependence on magnitude is weak for , the redshift-residuals diagram can be used to measure evolution: the arrow represents the effect of decreasing . As reported previously (Bershady 1997), there is significant difference between the residuals we find, and those found in the surveys of Rix et al. (1997) and Simard & Pritchet (1998). Now that our sample contains a wider range of types and redshifts, we are in a better position to address these discrepancies. Indeed, we find an offset between blue and red galaxies within our own sample. Local -band type-dependencies in the TF-relation are well known (Roberts 1978, Burstein 1982, de Vaucouleurs et al. 1982, Rubin et al. 1985), and have been measured at intermediate redshift by Rix et al. (1997). Based on our sample alone, the type-dependence (as parameterized by color) has not evolved. Hence, we still find no evidence for evolution of the TF-relation to .
Assuming this particular class of relatively massive disk galaxies has evolved at these look-back times, evolution has been both in color, luminosity, and mass such that galaxy M/L remains within the range observed locally. Since the range of observed rotation speeds at a given luminosity and color does not change with redshift in our sample, we have no compelling evidence that mass has changed substantially. A likely possibility is that the relative fraction of galaxies (red to blue) changes, but at a fixed rotation speed and size (or mass). To confirm this, larger intermediate- samples are needed for detailed comparison to local templates (e.g. Giovanelli et al. 1997a). To refine inferences of mass evolution, independent measures of luminosity evolution are also needed. Promising diagnostics include surface-brightness, rotational asymmetry (e.g. Conselice 1997), and emission line-strength compared, for example, at fixed color and line-width.
2 Disk Kinematics and Integral Field Spectroscopy
In addition to gathering larger kinematic samples with more sophisticated photometric diagnostics, there is yet another direction for intermediate redshift kinematic surveys: spatial maps of disk velocity and velocity-dispersion. These can be readily obtained from Fabry-Perot images or integral-field spectra of optical and near-infrared emission lines. Detailed kinematic studies are invaluable for several reasons. For example, modeling suggests that when distant galaxies are observed with a single slit, slit mis-alignment and spatial resolution significantly affect the inferred rotation velocities. While some of these systematics can be corrected reliably with spatially-resolved spectra (Vogt et al. 1996, Bershady & Mihos 1999), the corrections assume axisymmetric velocity fields. Velocity maps remove many of these problems, most notably kinematic vs photometric position-angle mis-alignments, and inclination errors due to disk asymmetries. Figure 2 illustrates the potential power of integral-field spectroscopy for mapping velocity fields in galaxies; with 10m-class telescopes, these measurements can be made easily at intermediate redshift (e.g see Andersen & Bershady, these proceedings). Detailed kinematic studies will be necessary to calibrate larger, statistical surveys using only a single fiber or slit per target.
Non-axisymmetric components of disk velocity fields are interesting in their own right, particularly if the incidence (or amplitude) of the asymmetries change with look-back time. Such an increase might be expected if the ’harassment’ or mass-accretion rate were higher or more irregular in the past. Ideally, comparisons would be made between kinematic and photometric asymmetry (e.g. Kornreich et al. 1998), using optical or near-infrared light for both measures.
Most challenging will to measure stellar velocity dispersions in galaxy disks, near and far. Such measurements are of critical importance for estimates of disk mass and M/L (see Bosma, Fuchs, and Quillen, these proceedings). While Fabry-Perot’s are powerful for single emission-line measurements over a large dynamic range in angle, for absorption line measurements of single targets, integral-field spectrographs with large étendue will be the instruments of choice.
Acknowledgements.
We thank C. Mihos & D. C. Koo for allowing us to present data in advance of publication.
References
- [1]
- [2] ndersen, D. R. & Bershady, M. A. 1999, in preparation
- [3]
- [4] ershady, M. A. 1997, A.S.P. Conf. Ser. vol 117, 537
- [5]
- [6] ershady, M. A. & Mihos, C. 1999, in preparation
- [7]
- [8] urstein, D. 1982, ApJ, 253, 539
- [9]
- [10] onselice, C. J. 1997, PASP, 109, 1251
- [11]
- [12] iovanelli, R. et al. 1997a, ApJ, 477, L1
- [13]
- [14] iovanelli, R. et al. 1997b, AJ, 113, 53
- [15]
- [16] ornreich, D., Haynes, M. P., & Lovelace, R. V. E. 1998, AJ, 116, 2154
- [17]
- [18] o, H. J., Mao, S., White, S. D. M. 1998, MNRAS, 295, 319
- [19]
- [20] unn, J. A. et al. 1997, ApJS, 109, 45
- [21]
- [22] ierce, M. J. & Tully, R. B. 1988, ApJ, 330, 579
- [23]
- [24] ierce, M. J. & Tully, R. B. 1992, ApJ, 387, 47
- [25]
- [26] ix, H.-W. et al. 1997, MNRAS, 285, 779
- [27]
- [28] oberts, M. S. 1978, AJ, 83, 1026
- [29]
- [30] ubin, V. C. et al. 1985, ApJ, 333, 522
- [31]
- [32] imard, L. & Pritchet, C. J. 1998, ApJ, 505, 96
- [33]
- [34] e Vaucouleurs, G. et al. 1982, ApJ, 254, 8
- [35]
- [36] ogt, N. P. et al. 1996, ApJ, 465, L15
- [37]
- [38] ogt, N. P. et al. 1997, ApJ, 479, L121
- [39]
- [40] eil, M.L., Eke, V.R., Efstathiou, G. 1998, MNRAS, 300, 773
- [41]
Introduction. We present preliminary estimates of the stellar masses of 6 compact, narrow emission-line galaxies (CNELGs) at redshifts , drawn from earlier studies (Koo et al. 1994, 1995, Guzmán et al. 1996). In previous work, Guzmán et al. (1996, 1998) use galaxy sizes, [O III] emission line-widths , and the shape of the light profiles to estimate dynamical galaxy masses, , of the CNELGs. The small line-widths (50 km/s) and sizes (R 2.5 h kpc) yield virial masses of order . However, Guzmán et al. point out that the total masses are likely to be up to 4 times larger: the underlying stellar population may be twice as big as the galaxy half-light radius which was used to estimate the galaxy size, and the [O III] line-widths may underestimate the internal velocities. A key assumption is that the line-widths reflect virialized motion, rather than turbulent motion due to stellar winds. Here, we make estimates of galaxy stellar masses based on band luminositites, and compare these masses to those derived from emission line-widths and optical sizes.
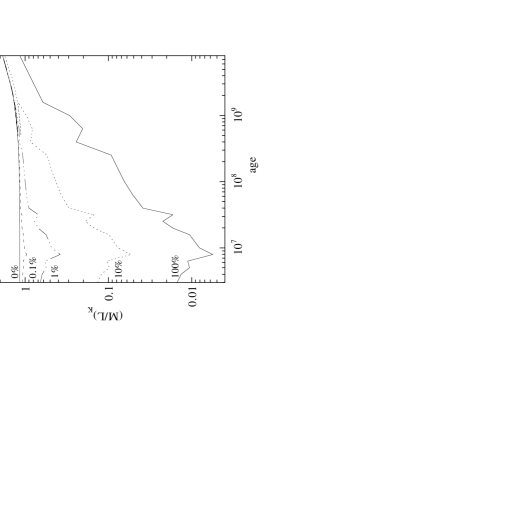
Analysis and Results. band images of the CNELGs were obtained with the KPNO Mayall 4-m telescope in 1994. To derive galaxy stellar masses from near-IR luminosities, the simplest case is to assume a constant for all objects – a useful approximation for normal galaxies, where the band flux mainly comes from the old stars (Rix 1993). For starbursting galaxies the situation is more complex: both old and young stars contribute substantially to the near-IR flux (Leitherer & Heckman 1995), making it difficult to assign a mass-to-light ratio to the galaxy without detailed knowledge of the burst age and strength (Figure 1, left panel).
Instead, we use population synthesis models (, and no reddening) to estimate the overall for a starburst superimposed on an underlying, older stellar population (Schmidt et al. 1995, Worthey 1994, Leitherer & Heckman 1995). From and rest-frame colors we then estimate the ages of starbursts of different strengths; the burst characteristics determine the ratio of the galaxy. Based on the individual of each object and its band luminosity, the stellar masses, , were estimated. However, the adopted metallicity and reddening values of the burst model, if incorrect, can lead to significant systematic effects: underestimating or reddening will lead us to assume older, weaker bursts with higher ratios, but will weakly affect our estimate of the band luminosity. In this scenario, is an upper limit to the true stellar mass. The precise value of as determined from broad-band colors can also vary depending on the detailed burst properties and star-formation history.
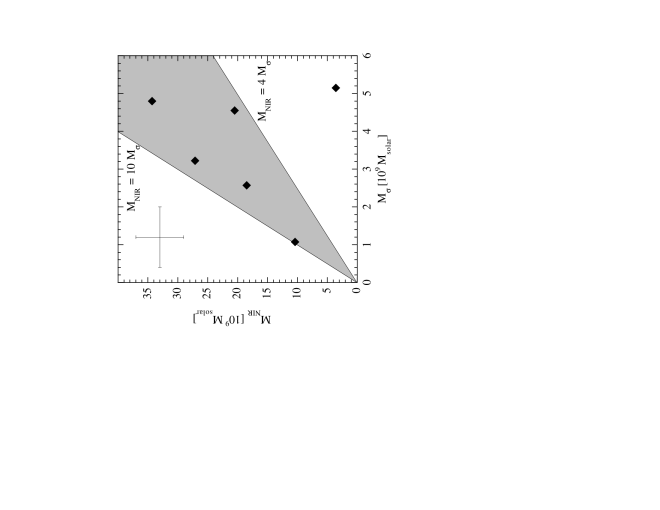
Nonetheless, the resulting stellar masses are correlated with the line-width masses: on average, the stellar masses are 4 – 10 times larger (Figure 1, right panel). This is roughly the expected result; the line-width method systematically underestimates the dynamical galaxy masses, and the starburst models ignore the effects of dust reddening and may lead us to overestimate the stellar masses. Implicit in this comparison is that dark matter does not dominate the potential on the small physical scales of the starburst region. While both the line-width and the band methods for deriving galaxy mass are problematic, used in concert they can place useful limit on stellar and masses.
Acknowledgements. Research was funded by NASA from STScI/AR-07519, STScI/GO-07875 and NAG5-6043.
References
Guzmán, R., Jangren, A., Koo, D. C., Bershady, M. A., Simard, L. 1998, ApJ,
495, L13
Guzmán, R., et al. 1996, ApJ, 460, L5
Koo, D. C. et al. 1995, ApJ, 440, L9
Koo, D. C. et al. 1994, ApJ, 427, L9
Leitherer, C., & Heckman, T. M. 1995, ApJS, 96, 9
Rix, H.-W. 1993, PASP, 105, 999
Schmidt, A. A., Alloin, D., Bica, E. 1995, MNRAS, 273, 945
Worthey, G. 1994, ApJS, 95, 107
3 Science Mission
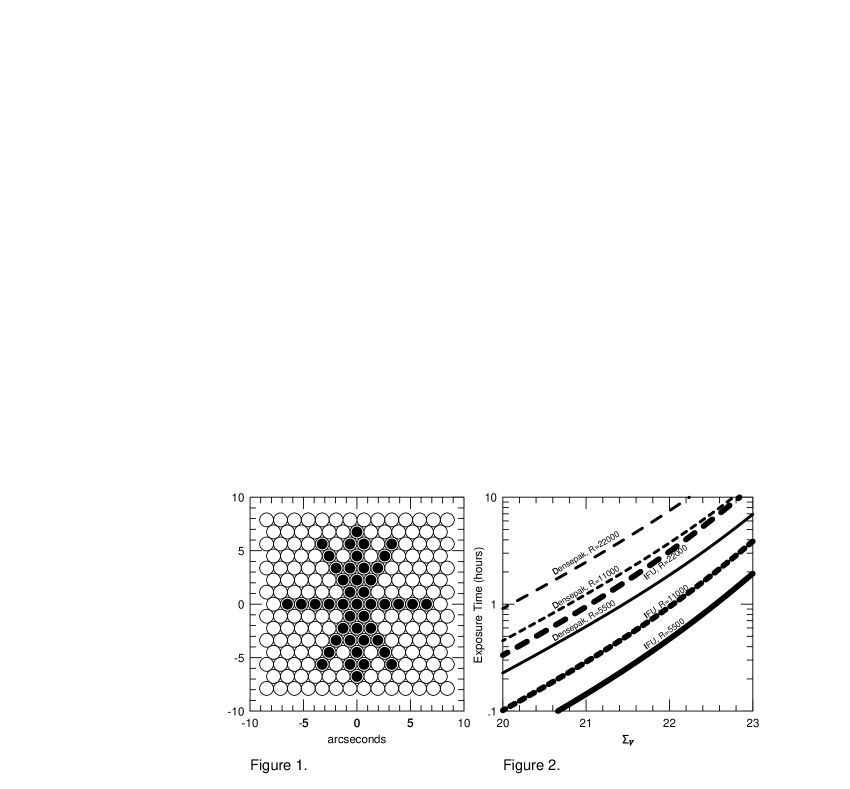
The integral field unit (IFU), nicknamed “Spider” (Figure 1), is a fiber optic array under construction for the 9m Hobby-Eberly Telescope’s (HET) Medium Resolution Spectrograph (MRS). This contribution updates previous reports (Bershady et al. 1998), and represents the final design for this instrument. Spider is optimized for integral field spectroscopy for kinematic studies of nearby and moderately distant galaxies, but will have more general application to moderate spectral resolution studies of extended sources at low surface-brightness (Bershady 1997). The IFU will be capable of delivering simultaneous rotation curves and disk velocity dispersions over a range of look-back times.
Rotation curve and disk velocity dispersion measurements from integral field spectroscopy allow for separate estimates of the disk and total masses and allow us to probe the axisymmetry of spiral disks. A critical limitation has been the inefficiency of traditional long–slit measurements made on 4m class telescopes. Integral field spectroscopy using high–throughput echelle spectrographs promise to open a new window on the mass and mass distributions of galaxies over a range of look–back times.
4 Performance
The IFU covers an area of 15 by 15 arcseconds using 1 arcsecond (200 m) fibers to densely sample slits at 4 position angles at resolutions from 5500 to 14500. Our 200 m array will be installed during the commissioning phase of the MRS (mid-1999). This fiber-fed echelle spectrograph has a resolution of 10,900 for a 1 arcsec aperture, and initial spectral coverage from 0.5-0.95 m in a red beam. The IFU coupled to the MRS spectrograph is expected to reach a limiting surface-brightness in V of 22 at S/N = 10 per spectral resolution element per fiber at R = 10,900 in one hour (Figure 2); this assumes a peak throughput of 15% for the HET plus MRS system (Ramsey 1995). The large telescope aperture and fiber size of Spider yields large étendue (50 m2 arcsec2). We are unaware of other fiber arrays planned or in existence which have comparable étendue and spectral resolution. Consequently, this IFU fills a niche for moderate resolution spectroscopy at low surface-brightness.
Acknowledgements.
This instrument is supported by NSF/AST 96-18849. We are indebted to Sam Barden for consultation and advice on fabrication.References
- [1] arden, S.C. & Wade, R.A. 1988, in Fiber Optics in Astronomy, S. C. Barden: ASPCS, 1988, 113
- [2] ershady, M. A. 1997, in Dark and Visible Matter in Galaxies and Cosmological Implications, M. Persic & P. Salucci: ASPCS, 1997, 547
- [3] ershady, M. A., Andersen, D. R., Ramsey, L. W., Horner, S. 1998 to appear in Fiber Opotics in Astronomy III, S. Arribas, E. Mediavilla, & F. Watson: ASPCS, 1998
- [4] amsey, L. W. 1995, in Fiber Optics in Astronomical Applications, S. C. Barden: SPIE, 1995, 20