Distortion of Globular Clusters by Galactic Bulges
Abstract
One of the external fields that influences the population of globular clusters is that due to galactic bulges. In extreme situations, perigalactic distances pc, globular clusters could suffer total disruption in a single passage. A more common scenario is that for cluster orbits with pc. We investigate the effects of tidal forces from a bulge on the shape of globular clusters for this type of encounters. We find distortions characterized by “twisting isophotes” and consider the potential for observability of this effect. In the Milky Way, a typical globular cluster must pass within several hundred pc of the center to experience substantial distortion, and it is possible that this has happened recently to one or two present day clusters. We estimate that this distortion could be observed even for globulars in dense fields toward the bulge. In more extreme environments such as giant ellipticals or merger products with newly formed globulars, this effect could be more common, extending out to orbits that pass within 1 kpc of the bulge center. This would lead to a substantial shift in the eccentricity distribution of globulars in those galaxies.
keywords:
globular clusters: general — celestial mechanics, stellar dynamics — galaxies: structure — methods: numerical1 Introduction
The mechanism by which globular clusters (GCs) are destroyed has received considerable attention [Tremaine 1975, Chernoff & Shapiro 1987, Aguilar, Hut & Ostriker 1988, Chernoff & Weinberg 1990, Long et al., 1992, Capuzzo-Dolcetta 1993, Capuzzo-Dolcetta & Tesseri 1997]. These studies include intrinsic processes like cluster evaporation, as well as environmental influences such as dynamical friction and tidal shocking from disks, bulges and supermassive black holes. Recently, Gnedin and Ostriker (1997) considered the effect of these processes on the present and, by extrapolation, on the initial population of GCs in the Milky Way. The conclusion they drew is that between 52% and 86% of the current population of GCs in our galaxy will be eventually destroyed by the combination of evaporation, dynamical friction and tidal shocking over the next Hubble time. They added that the initial population of GCs was likely to be substantially larger than the present one, with the clusters that pass closest to the galactic center subject to destruction by bulge shocking. Moreover, the remnant stars join the bulge and the halo of the galaxy, perhaps making a dominant contribution to their stellar populations. Murali and Weinberg (1997a) reached similar conclusions (i.e. a factor of two decrease in the initial population) considering the global evolution of the populations of Milky Way disk and halo clusters.
Observationally, the distributions of GC shapes have been studied in the Milky Way [White 1987] and in nearby galaxies such as M31 [Lupton 1989], the LMC [Kontizas 1989], and the SMC [Kontizas 1990]. A comparison of GCs in the Milky Way and M31 [Han & Ryden 1994] shows that both galaxies have similar, nearly spherical distributions of clusters, with axial ratios peaked respectively at and . On the other hand, GCs in the LMC and SMC differ significantly. Globulars in these galaxies require triaxial parameters to describe their shapes. The distribution of axial ratios of GCs in the LMC peaks at about and that of the SMC, at . Han and Ryden (1994) explain this situation by a gradual decay of velocity anisotropy as a consequence of two body relaxation, so that the older clusters in the Milky Way and M31 are now supported mainly by rotation. However, Goodwin (1997) argues that there is no age/ellipticity relationship for GCs, and that in fact the stronger tidal field in larger galaxies is the dominant effect in producing the observed differences. Severe observed distortions in the globulars of giant galaxies are rare, but axial ratio values as low as have been measured for GCs in the Galaxy. Also, the discovery of populations of young GCs in various interacting galaxies opens a new laboratory for the study of destruction mechanisms [Holtzman et al., 1992, Whitmore et al., 1993, OĆonnell, Gallagher, & Hunter 1994, Whitmore & Schweizer 1995, Meurer et al., 1995, Holtzman et al., 1996, Conti, Leitherer, & Vacca 1996, Watson et al., 1996, Schweizer et al., 1996]. For external galaxies and for the Milky Way observations of distortion typically involve measurement of ellipticity at the half mass radius of the GC, but it is also known that the shape changes with distance from cluster center.
Theoretical inferences about the destruction of GCs have mostly been considered from the statistical point of view. In a previous paper [Charlton & Laguna 1995], we instead considered how the destruction event itself proceeds. There we reported the outcome of a series of –body numerical simulations of a single GC under the influence of the gravitational potential of a galactic bulge and/or supermassive black hole. Disk shocking also plays an important role, however, in the inner parts of galaxies it is the central spheroid that dominates [Aguilar, Hut & Ostriker 1988]. In our previous paper, we concentrated on computing the mass lost by the GC as a function of the distance of closest approach, the bulge concentration, and the mass of the black hole. A GC venturing within a distance of a few hundred pc of the galactic center was completely destroyed in a single passage. However, it is expected that these ultra-close encounters are relatively rare. More typically, the orbit of a GC would pass through a range of perigalactic distances for which only a small fraction of the stars become unbound. In these types of encounters, the GC would be noticeably distorted by tidal forces, but would not be totally destroyed until at least several passages had taken place. Many of the clusters on orbits that venture close to the bulge were destroyed billions of years ago, however as the GC system evolves there will be some clusters that reach closer and closer passages. Several Galactic clusters are presently found within 1–2 kpc of the Galactic center [Gnedin & Ostriker 1997].
The main goal of this paper is to characterize the distortions induced in a GC by its interaction with a galactic bulge. For some cases the effect of a supermassive black hole is also considered. Of particular interest is the feasibility of finding direct observational evidence of the destruction of GCs, both in the Milky Way and in external galaxies. Grillmair et al. (1995) have determined by star count analysis that most of the twelve Galactic globular clusters in their sample have some degree of distortion of their surface density contours. They suggest that this is the effect of tidal stripping of loosely bound stars by the gravitational potential of the galaxy.
As with our previous work, we base the present study on –body simulations that are designed both to quantify the nature of the distortions of GCs produced specifically by bulge shocking and to explore the region of parameter space in which such distortions occur. With our simulations, it is possible to address past and present distortions in the Milky Way and to consider implications in external galaxies of various types. Specifically, we ask: 1) Under which circumstances do clusters change shape due to bulge shocking?, 2) What is the detailed physical mechanism that gives rise to shape distortions and how can we characterize them?, 3) Can these distortions feasibly be observed in the Milky Way, and are the present constraints consistent with the properties of the Milky Way bulge and GC population?, 4) Where and when are bulge shocking distortions most easily observed?, and 5) How long do distortions persist and what is the fate of these distorted globulars?
2 Tracking the Shape of a Globular Cluster
The main challenge in a numerical study aimed at characterizing shape distortions of GCs is to achieve a satisfactory level of resolution. Typical GC deformations often only involve the outer layers of the cluster. Thus, in order to obtain reasonable observational predictions on shapes of GCs from –body simulations, it is important to model GCs (systems of stars) with at least particles. This lower bound on the number of particles is necessary because GCs are highly concentrated objects, requiring a large investment of computational resources to simultaneously resolve their cores as well as their outer layers. These days, –body simulations with particles are not considered extremely demanding; however, it is important to utilize a code fast enough that parameter space searches are feasible. We use an –body, parallel, oct–tree code for this purpose [Salmon & Warren 1994]. With this code, it is possible to carry out selected runs with each star in the GC represented by its own particle, and, at the same time, the code’s performance allows the exploration of substantial region of parameter space. The code does not include the effects of two–body relaxation, but it should not be important for the single passages through the bulge.
Much of the previous work on the evolution of GCs has been based upon solution of the Fokker–Planck equation (see [Oh & Lin 1992], [Murali & Weinberg 1997a], [Murali & Weinberg 1997b], [Gnedin & Ostriker 1997], and references therein). Clearly, this technique is convenient for considering the statistical evolution of the initial Milky Way GC population, including both internal (stellar evolution) and external (tidal) effects. However, recent work by Zwart et al. (1998) questions the general applicability of this technique by comparing to an N–body approach, considering the effects of close encounters. For some cluster parameters and initial conditions the Fokker–Planck technique yields GC lifetimes a factor of ten smaller. This issue remains open for debate, however, since our goal in this paper is to focus on observability of GC distortions due to bulge shocking during a single passage, an N–body approach is more appropriate regardless.
A GC experiences forces due to the other stars in the cluster and due to all the other material in its host galaxy. We model the background force of the galaxy by an analytic potential. A crucial question for this study was the choice of bulge potentials. There is convincing evidence in favor of triaxial bulges in the Milky Way and in other galaxies [Zhao, Spergel, & Rich 1994, Bertola, Vietri, & Zeilinger 1991]. Near–infrared observations from COBE DIRBE support a Galactic bulge resembling a prolate spheroid with 1:0.33:0.23 axis ratios [Dwek et al., 1995]. Orbits of GCs in triaxial potentials can certainly be quite different from those with spherical symmetry (e.g. box orbits). For that reason, initially we considered triaxial potentials such as the Schwarzschild triaxial potential [de Zeeuw & Merritt 1983]. However, we found that for a single passage with perigalactic distance pc, there was no significant difference in the nature and shape of the deformations between triaxial and spherical potentials as long as both potentials were comparable in depth and in extent (see below). As a consequence, information about the triaxiality of the bulge can only be extracted from study of GC shape distortions in a statistical sense, and this is beyond the scope of this paper.
Based on the above observations and in order to directly compare with our previous work, we have chosen to model the bulge using the Hernquist potential [Hernquist 1990]
| (1) |
where , is the mass of the bulge, and is a scale length related to the half-mass radius . We considered values of pc and pc. This represents a range typical of the bulges of spiral galaxies. In addition, the mass of the bulge was taken to be or , where is the mass of the GC (results are presented in units of ). These bulge masses are consistent with a typical GC mass of M⊙ if the bulge has a mass of M⊙ or M⊙, respectively.
The tidal force on a star that is on a line joining the centers of the bulge and the GC is
| (2) |
where is the distance between the bulge and the GC, and is the distance from the star to the center of the GC. Notice that at a fixed separation , the strength of this force decreases as increases. One can find an estimate of the tidal radius, , by equating expression (2) to the restoring force from the GC itself. This yields
| (3) |
A GC will undergo tidal deformations if . Since observations suggest that pc and since we are not interested in ultra-close encounters (i.e., we consider only pc), one has from (3) that the region in the GC subject to distortions is pc. Typical core radii of GCs lie between 0.3 and 10 pc [Spitzer 1987], thus it is only the halo of the GC that gets distorted.
To understand the role that triaxiality plays in producing tidal deformations, let us extend the Hernquist potential (1) to a triaxial form by defining
| (4) |
with , and as parameters. The tidal force along the -axis is
| (5) |
with similar expressions holding for the other axes. From Dwek et al. (1995), for the Milky Way bulge, kpc and kpc. Thus, for most of the halo, tidal deformations along the -axis are negligible. This in principle represents an anisotropic tidal field that could yield a clear signature in the cluster deformations. However, one has to remember that GCs orbits are not exactly radial and in general not aligned with the major axis of the bulge. Since the remaining two axes are quite similar, on average the GC sees mostly spherically symmetric tidal forces, thus it suffices to consider spherically symmetric potentials.
For our simulations, we represent the GC by a King model with a central potential and a half mass radius of 10 pc. This is within the range of observed GCs in the Milky Way, but on the loosely bound end of this distribution. For a more tightly bound GC the disruption and distortion effects would be smaller. We consider parabolic orbits with perigalactic distances and pc. For bound orbits, the speed at perigalacticon would be smaller so in this sense our calculations give a lower limit on the amount of distortion. The initial location of the globular cluster was sufficiently far from the center of the galaxy so that tidal effects at the start of the simulation were negligible.
| Case | (pc) | (pc) | |
|---|---|---|---|
| C1 | 400 | 200 | |
| C2 | 400 | 400 | |
| C3 | 400 | 800 | |
| C4 | 400 | 1600 | |
| C5 | 800 | 200 | |
| C6 | 800 | 400 | |
| C7 | 800 | 800 | |
| C8 | 800 | 1600 | |
| C9 | 400 | 200 | |
| C10 | 400 | 400 | |
| C11 | 400 | 800 | |
| C12 | 400 | 1600 | |
| C13 | 800 | 200 | |
| C14 | 800 | 400 | |
| C15 | 800 | 800 | |
| C16 | 800 | 1600 |
Table 1 summarizes the input parameters for runs. In this paper we focus on identifying choices of parameters that induced less than 20% GC mass loss. We also conducted runs more appropriate for GC distortion in giant elliptical galaxies, considering the effect of superimposing a black hole of mass on the bulge with pc. In that case, for the same , considerably more mass could be lost due to the increase in the depth of the potential. As a test, Case C3 was repeated with to verify that results are not sensitive to at this level.
At each step during the evolution, we monitored the 3D shape of the GC using the inertia tensor
| (6) |
where the sum is over all the particles in the cluster and . Although this method provides useful information about the development of the deformations, it does not take into account projection effects. To connect with observations, following [de Theije et al., 1995], we also characterize the GC shape by projecting the cluster onto an arbitrary plane on the “sky.” The cluster’s ellipticity, , is then obtained from
| (7) |
where
| (8) |
and () are the eigenvalues of the 2D inertia tensor. This ellipticity, of course, depends on the orientation that is chosen to perform the projection. Thus we must compute the probability, , of viewing the cluster with a given ellipticity. The procedure for estimating is as follows: Given a snapshot of a GC from an encounter with the bulge, we define first a coordinate system with its origin at the cluster’s center of mass. At this origin, we select directions with solid angle that cover uniformly the plane. The GC is then projected in planes perpendicular to those directions, and its ellipticity is computed. Finally, is obtained from a histogram of these ellipticities.
3 Distorting the Shape of Globular Clusters
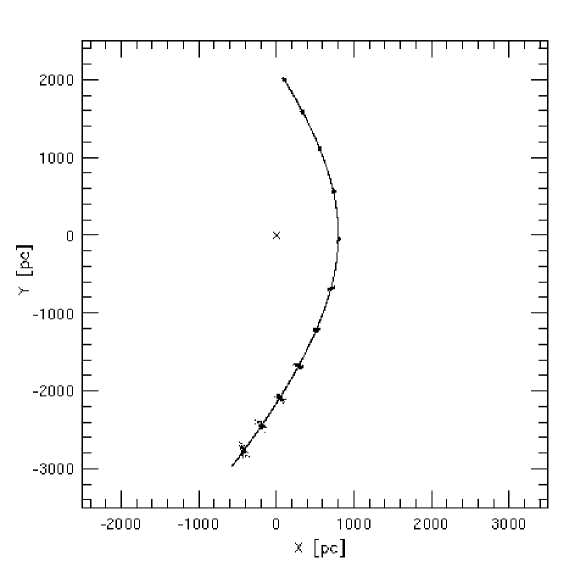
A reasonable starting point to understand the onset of tidal deformations of GCs by galactic bulges is to show the outcome of a simulation for a typical orbit. Figure 1 shows the evolving GC along the orbit for case C3, with blow–up views at selected points. The GC has been projected on the orbital plane since distortions along this plane are dominant for these encounters. Distortion begins as soon as the GC reaches the tidal radius; for this case pc for stars at twice the half mass radius of the cluster. The mechanism behind the distortion of a GC is basically the same as that for the case of self-gravitating spheres of gas (stars). That is, the energy required to induce deformation or even disruption is provided at the expense of the orbital kinetic energy of the GC. As mentioned before, and clearly shown in Fig. 1, the core of the GC remains almost intact. Only the halo of the GC develops a quadrupole distortion that can be spun up via gravitational torques [Rees 1988]. Stars closest to the center of the bulge move faster than those furthest, resulting in the spreading of energy of the stars in the GC. This gives rise to the “twisting” isophotes apparent in the distorted clusters shown in Fig. 1.
Figure 2 shows the evolution of the eigenvalues of the 3D inertia tensor (6) for each of the cases in Table 1. A sense of the degree of deformation is obtained from the relative size of these eigenvalues. Two general types of deformation can be detected depending on the value of ; however, both types lead to final prolate configurations. For all cases, initially two of the principal axes (or equivalently eigenvalues) decrease, and the third one (initially pointing in the direction of the bulge’s center) increases. As the GC continues its orbit (still inside of the tidal radius), the alignment of the major axis with the line joining the bulge and GC’s centers is no longer possible, in spite of the induced torques on the GC, which act trying to restore the original alignment. Tidal forces halt the growth of the prolate distortion. In cases with pc, the situation is temporarily reversed, leading to a “bounce” with one of the short axes becoming the largest (see C9 and C13 in Fig. 2). The GC eventually settles down into a prolate configuration, with the major axis in the orbital plane. A similar, but not as dramatic, prolate configuration is obtained for larger . In this case the bounce is absent, with the GC reaching a stable configuration on a shorter time-scale (about 300 time units or yrs after perigalacticon). The distortion is minimal outside 1 kpc for , but is still substantial outside this distance if .
The loss of mass during each encounter is displayed in Fig. 3. The loss of mass steadily increases as decreases, as decreases, and as increases. The GC experiences a rapid loss of mass near the perigalactic distance, followed by a gradual loss over the next yrs. In the cases with pc, some of the material that was lost in the closest approach becomes bound to the cluster again during the “bounce” phase, giving rise to an increasing in Fig. 3 over a short interval of time. If the GC is destroyed only if it passes within pc of the galactic center, and distortions could be observed for pc. For a more massive bulge, approaches with pc lead to destruction and distorted clusters will be observed for kpc.
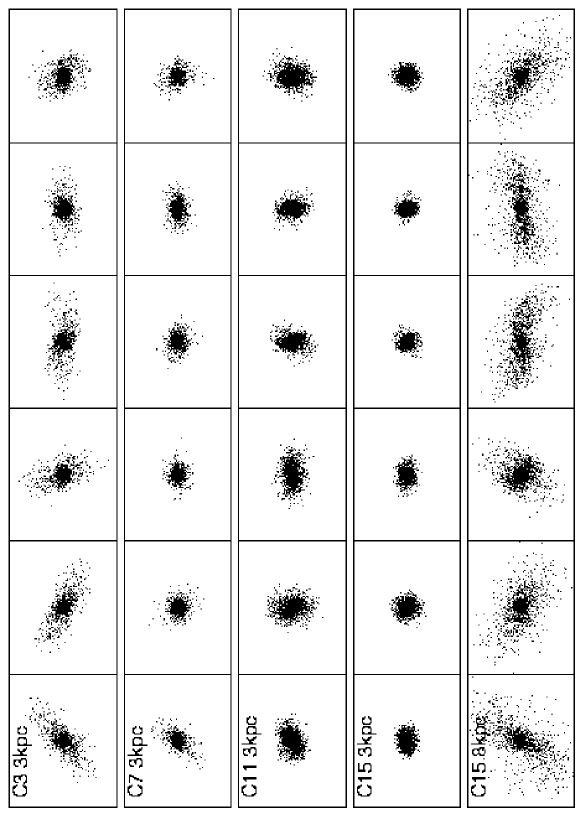
Even when a cluster is severely distorted, the observability in any one case depends upon the viewing angle. Figure 4 shows four series of realizations of the randomly oriented clusters from C3, C7, C11, and C15, all viewed at the time, after the encounter, when they are 3 kpc from the galactic center. These four cases all have pc, but varying bulge parameters. Although Case C10 yields the GC with the largest distortion and thus the larger mean ellipticities, the “twisted” isophotes are more apparent for Cases C3 and C7. In fact this is due to the fact that the GCs in C11 and C15 have not yet settled into their final states at the distance of 3 kpc. The last row in Fig. 4 shows randomly oriented realizations of the cluster from C15 at yrs after reaching the distance of closest approach, when it is at a distance of kpc.
Figure 5 shows the distributions of ellipticities for each of the cases in Table 1 when the GC is at a distance 3 kpc from the center of the bulge. Generally, we see that with increasing (along a column in Fig. 5) the eccentricity distribution peaks at smaller values. However, this is not apparent for Cases C9–C11 and Cases C13–15. In these cases, which experienced the “bounce” described above, the GC has still not reached a stable configuration when it reaches a distance of 3 kpc. Fig. 6 shows eccentricity distributions for all cases at ( yrs from the start of the simulation, when the GC was at 2 kpc distance). These distributions are all narrow and we see a steady progression with the exception of Case C9. This is also the case with the most severe “bounce”. The GC eccentricity distribution mean does not reach the large values we would expect by extrapolating from the , 800, and 400 pc cases (C12, C11, and C10). This is due to the rapid passage of this GC through the galactic center. As a result, it does not have time to fully respond to the tidal torques and does not reach as large an ellipticity.
In giant elliptical galaxies, it seems possible that the effects of “bulge shocking” could be substantially enhanced by the presence of a central supermassive black hole. To address this specific possibility, we added a central Mgc black hole to runs C5 and C13 ( pc and pc for both, but with and Mgc, respectively). The results for mass loss and for the ellipticity distributions are shown as dotted lines in Figs. 3, 5, and 6. In the case with the less massive bulge (C5), the black hole leads to significantly larger distortions, but the bulge tidal effect dominates in the case with Mgc.
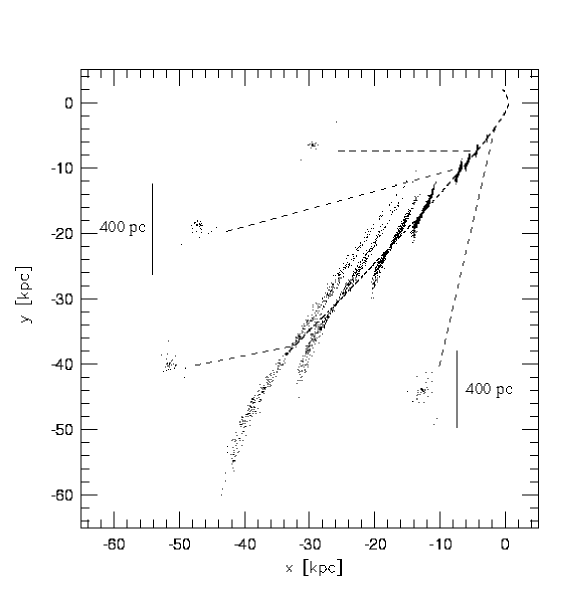
We have found that, for a range of bulge properties, there is a fairly large range of perigalactic distances over which a GC is distorted but not destroyed. Figure 7 illustrates the evolution of such a cluster as it continues along a parabolic orbit back out into the galaxy. The Case 2 cluster simulation is shown, but with only 10000 particles, so that its evolution can be traced for more than 1 billion years. The distortion is apparent at 1000 time units, corresponding to yrs, but is not pronounced at 3000 time units. If no further shocking occurs the bound particles remain behind as a globular cluster while, within hundreds of millions of years, the outer layers spread out into a stream extending through the galaxy. Once dispersed, this stream of stars joins the population of halo stars.
4 Are Tidal Deformations Observable?
We find that GCs can be substantially distorted, without being destroyed, by the process of bulge shocking. Here we address the question of whether the predicted distortions of the GC halo can practically be observed in the Milky Way and in other nearby galaxies.
4.1 Globular Cluster Distortion in the Present Day Milky Way
As demonstrated by Gnedin and Ostriker (1997), the rate of destruction of GCs and the importance of bulge shocking to their evolution were significantly larger in the past. Although the GC population in the Milky Way is likely to decrease by a factor of two over the next Hubble time, the probability of observable bulge shocking at present in the Milky Way is somewhat difficult to assess. We use our simulation results to consider this issue.
The clusters most likely to have observable distortions in the Milky Way are those that have passed near to the Galactic center. There are several clusters observed within 2 kpc, and these are the ones with the highest probability of having a bulge shocking effect. As examples, we consider the clusters NGC6293 (at kpc) and NGC6440 (at kpc). The bulge of the Milky Way has mass M⊙ and softening parameter pc [Dwek et al., 1995], if the distribution of light is fit to a Hernquist potential. With these parameters (closest to the series C5–C8), a GC passing within a few hundred pc of the Galactic center undergoes substantial distortion of its outer layers. The outer distorted regions of such a GC has about 10–100 stars per square arcminute at the distance of NGC6293 or NGC6440. In order to determine whether such distortions are observable, we consider whether it is possible to distinguish the GC stars from the background of bulge and disk field stars in the Galaxy. The expected backgrounds in the directions of these two clusters have been calculated using a Galaxy model constructed by Hunsberger (private communication). For GCs kpc away from us the range of observed apparent magnitudes of their stars is about 12–20. For NGC6293, at and , we expect 24 stars per square arcminute from the bulge and 23 stars per square arcminute from the disk in this magnitude range. For NGC6440, at and , the bulge contribution is only 9 per square arcminute, as compared to 21 per square arcminute from disk stars. In either case the stellar densities in the outer, distorted regions of the cluster are 10–100 stars per square arcminute, comparable to these background levels, and should be observable. Further information could be extracted by considering the colors of the stars since a different distribution is expected for the cluster and for the Galactic background.
We conclude that the main factor in assessing whether bulge shocking should be observable in one or more present–day Milky Way globulars is whether any of the clusters actually has passed within 400 pc of the bulge center. (The GC that we have chosen is realistic, but fairly loosely bound. The distances at which distortion and destruction become important would be smaller for a more tightly bound cluster.) The key period for observation of the tidal distortion effect is while the cluster is still within a couple of kpc of the Galactic Center. Figure 7 showed that the distortions do not persist once the cluster has passed out into the galaxy. A search for the distortion signature of bulge shocking can be used to place limits on the orbits of present day globulars. It is expected that most clusters that passed regularly within the bulge on their orbits were destroyed many billions of years ago. However, three of the 25 globular clusters for which proper motions were measured were found to have orbits that will bring them within 1 kpc of the Galactic Center, one of them within 300 pc [Dauphole et al., 1996]. A careful analysis of the shapes of globulars close to the Galactic Center is therefore of interest.
Grillmair et al. (1995) have mapped the surface density distributions of 12 Galactic clusters over a range of Galactocentric distances, using star counts and aided in selection by color–magnitude diagrams. They present a comparison of one of their most distorted observed clusters, NGC 7089, to results from their own N–body simulations observed in similar manner to the data, and find agreement. We have performed a similar analysis and present in Fig. 8 contours of smoothed pixel maps for six of the clusters illustrated in Fig. 7. These were constructed by observing each of the oriented clusters from a distance of 8 kpc, and assigning the particles to pixels that were square arcminutes, i.e. . Contours were drawn by first applying a Gaussian smoothing filter with pixels. Pixels near the center of the image, those with values larger than the threshhold of 1000 stars per pixel, were reset to 1000 so that the central structure did not overwhelm the outer contours in the smoothing process. The outer contour is drawn at 2 stars per pixel and the inner contour at 100 stars per pixel. These maps were produced using the imsmooth and contour routines in IRAF111IRAF is distributed by the National Optical Astronomy Observatories, which are operated by AURA, Inc., under contract to the NSF..

These parameters used to produce the contours in Fig. 8 are similar to those used in producing the surface density maps for the 12 Galactic globulars presented by Grillmair et al. (1995). The resulting maps of our similated GCs are somewhat similar to some of the observed GCs, suggesting that perhaps tidal distortions have already been observed in our galaxy. However, we should note that the Grillmair clusters are all at galactocentric distances larger than 8 kpc. If the tidal distortions are in fact due to bulge shocking as we have discussed, this implies that these clusters have passed at least within 1 kpc of the Galactic center which is unlikely for the majority of the twelve.
4.2 Globular Cluster Distortion in Other Galaxies
As discussed in the introduction, galaxies of various types at different stages of evolution show different distributions of ellipticities [Han & Ryden 1994]. In our Galaxy and M31 there has been time for two–body relaxation to destroy velocity anisotropies. We would predict that distortion should occur in many young galaxies due to bulge shocking. Depending on the initial distribution of orbits of GCs and on their spatial distribution, the early ellipticity distribution of clusters could be skewed to low values due to this process.
Some other environments are more likely to currently be active sites of extensive bulge shocking. We repeated runs C5 and C13 to explore the distortions expected for a parabolic orbit passing within 200 pc of the center of an elliptical galaxy containing a supermassive black hole. Depending on the orbital distribution, in a young elliptical with a large GC population this situation may be more likely than it is for a GC to pass within 400 pc of the Galactic Center. In general, the initial distribution of clusters could be spatially concentrated toward the galaxy center, so that many orbits are subject to bulge shocking. In a young galaxy with close to its initial distribution of clusters, we expect many to have the “twisting isophotes” distortions that we describe here.
The merger products of recent interacting giant galaxies perhaps provide the most ideal laboratory for direct detection of the destruction of GCs. As mentioned in the introduction, in several of these galaxies more than one thousand young star clusters are found, with masses somewhat larger on average than globulars [Whitmore & Schweizer 1995]. These clusters have properties consistent with the predecessors of GCs. We predict that a number of the globulars in merger products should exhibit the unique signature of distortion by bulge shocking. Globular clusters can just be resolved at the distances of these interacting pairs and distortions of their outer layers would be impossible to observe. However, the GCs produced by more extreme cases of bulge shocking (which should be more common in this environment than in the Milky Way) will have large eccentricities even at the half mass radius and should have larger effective radii. Both relatively gentle and gradual tidal distortions and more dramatic destructive shocking must play a role in shaping the distribution of new globulars. A statistical study of the globular cluster distribution as a function of the age of the merger product would provide constraints on its evolution. Some of the massive young star clusters in the merger product NCG 1569 seem to have relatively high ellipticities [OĆonnell, Gallagher, & Hunter 1994]. Furthermore, some of the young inner clusters in NGC 7252 have larger effective radii than any outer clusters in the same galaxy [Miller et al., 1997]. Constraints based on studies of the ellipticity distributions of galaxies of various types could lead to a better understanding of the formation and evolution of globulars in the Milky Way and in general.
Acknowledgments
We are grateful to M. Warren for making available his Tree-code. We also thank S. Hunsberger for providing the code used to estimate the Galactic background of disk and halo stars. This work was partially supported by NSF 93-57219 (NYI) grant to PL and by NSF grant 95-29242 awarded to JCC.
References
- [Aguilar, Hut & Ostriker 1988] Aguilar, L.A., Hut, P., & Ostriker, J.P. 1988, ApJ, 335, 720
- [Bertola, Vietri, & Zeilinger 1991] Bertola, F., Vietri, M., & Zeilinger, W. W. 1991, ApJ, 374, L13
- [Capuzzo-Dolcetta 1993] Capuzzo-Dolcetta, R. 1993, ApJ, 415, 616
- [Capuzzo-Dolcetta & Tesseri 1997] Capuzzo-Dolcetta, R., & Tesseri, A. 1997, MNRAS, 292, 808
- [Charlton & Laguna 1995] Charlton, J.C., & Laguna, P. 1995, ApJ, 444, 193
- [Chernoff & Shapiro 1987] Chernoff, D. F., & Shapiro, S. L. 1987, ApJ, 322, 113
- [Chernoff & Weinberg 1990] Chernoff, D. F., & Weinberg, M. 1990, ApJ, 351, 121
- [Conti, Leitherer, & Vacca 1996] Conti, P. S., Leitherer, C., & Vacca, W. D. 1996, ApJ, 461, L87
- [Dauphole et al., 1996] Dauphole, B., Geffert, M., Colin, J., Ducourant, C., Odenkirchen, M., & Tucholke, H.-J. 1996, A&A, 313, 119
- [de Theije et al., 1995] de Theije, P.A.M., Katgert, P., & van Kampen, E. 1995, MNRAS, 273, 30
- [Dwek et al., 1995] Dwek, E., et al. 1995, ApJ, 445, 716
- [Gnedin & Ostriker 1997] Gnedin, O. Y., & Ostriker, J. P. 1997, ApJ, 474, 223
- [Goodwin 1997] Goodwin, S. P. 1997, MNRAS, 286, L39
- [Grillmair et al., 1995] Grillmair, C. J., Freeman, K. C., Irwin, M., & Quinn, P. J. 1995, AJ, 109, 2553
- [Han & Ryden 1994] Han, C., & Ryden, B.S. 1994, ApJ, 433, 80
- [Hernquist 1990] Hernquist, L. 1990, ApJ, 356, 359
- [Holtzman et al., 1992] Holtzman. J. A et al. 1992, AJ, 103, 691
- [Holtzman et al., 1996] Holtzman. J. A et al. 1996, AJ, 112, 416
- [Kontizas 1989] Kontizas, E., Kontizas, M., Sedmak, G., & Smareglia, R. 1989, AJ, 98, 590
- [Kontizas 1990] Kontizas, E., Kontizas, M., Sedmak, G., Smareglia, R., & Dapergolas, A. 1990, AJ, 100, 425
- [Long et al., 1992] Long, K., Ostriker, J.P., & Aguilar, L. 1992, ApJ, 388, 362
- [Lupton 1989] Lupton, R. H. 1989, AJ, 97, 1350
- [Meurer et al., 1995] Meurer, G. R., Heckman, T. M., Leitherer, C., Kinney, A., Robert, C., & Garnett, D. R. 1995, AJ, 110, 2665
- [Miller et al., 1997] Miller, B. W., Whitmore, B. C., Schweizer, F., & Fall, S. M. 1997, AJ, 114, 2381
- [Murali & Weinberg 1997a] Murali, C., & Weinberg, M. D. 1997, MNRAS, 291, 717
- [Murali & Weinberg 1997b] Murali, C., & Weinberg, M. D. 1997, MNRAS, 288, 749
- [OĆonnell, Gallagher, & Hunter 1994] O’Connell, R. W., Gallagher, J. S., & Hunter, D. A. 1994, ApJ, 433, 65
- [Oh & Lin 1992] Oh, K. S., & Lin, D. N. C. 1992, ApJ, 386, 519
- [Rees 1988] Rees, M.J. 1988, Nature, 333, 523
- [Salmon & Warren 1994] Salmon, J.K., & Warren, M.S. 1994, J. Chem. Phys., 111, 136
- [Schweizer et al., 1996] Schweizer, F., Miller, B. W., Whitmore, B. C., & Fall, S. M. 1996, AJ, 112, 1839
- [Spitzer 1987] Spitzer, L. 1987 Dynamical Evolution of Globular Clusters (Princeton Univ. Press: Princeton)
- [Tremaine 1975] Tremaine, S. D., Ostriker, J. P., & Spitzer, L. 1975, ApJ, 196, 407
- [Watson et al., 1996] Watson, A. M. et al. 1996, AJ, 112, 534
- [White 1987] White, R. E., & Shawl, S. J. 1987, ApJ, 317, 246
- [Whitmore et al., 1993] Whitmore, B. C., Schweizer, F., Leitherer, C., Borne, K., & Robert, C. 1993, AJ, 106, 1354
- [Whitmore & Schweizer 1995] Whitmore, B. C., & Schweizer, F. 1995, AJ, 109, 960
- [de Zeeuw & Merritt 1983] de Zeeuw, T., & Merritt, D. 1983, ApJ, 267, 571
- [Zhao, Spergel, & Rich 1994] Zhao, H., Spergel, D. N., & Rich, M. R. 1994, AJ, 108, 2154
- [Zwart et al., 1998] Zwart, S. F. P., Hut, P., Makino, J., & McMillan, S. 1998, AA, submitted