MEDIUM-DISTANT CLUSTERS OF GALAXIES SEEN BY ISO††thanks: ISO is an ESA project with instruments funded by ESA Member States (especially the PI countries: France, Germany, the Netherlands and the United Kingdom) and with the participation of ISAS and NASA.
Abstract
We present a comprehensive study of ISO cluster galaxies in connection with other wavelengths. First results show that infrared galaxies detected by ISOCAM concentrate on the edge of clusters. Surprisingly, they are not emission lines galaxies but very luminous elliptical, merging or interacting ones, which suggests non-trivial connections between star formation rate, optical and mid-IR properties. However, no correlation has been found between the MIR/optical star formation properties of the galaxies, so that the exact origin of the IR emission remains unclear.
Key words: ISO; infrared astronomy; galaxy clusters.
1. INTRODUCTION
Until recently, detailed cluster studies were restricted to nearby clusters (). Nowadays, new imaging as well as spectroscopic capabilities (visible, X-ray, IR, radio) have considerably improved our view of the distant universe. In this context, we have selected a sample of ten bright objects, expected to be rich clusters, from the ROSAT All Sky Survey (RASS) in the range in order to investigate issues ranging from cluster formation and evolution down to a local phenomenon such as the enrichment of the ICM (??). We have undertaken a detailed high-resolution multi-wavelength follow-up including ROSAT HRI and PSPC, ASCA pointing-s, radio images at 3, 6, 13, 20 and 36 cm and extensive photometry and spectroscopy in the optical. Seven of them were included in the ISO Central Program (DEEPXSRC, 30 hours, P.I.: C.J. Cesarsky; Collaborator: M. Pierre), in order to study the influence of the environment on the galaxy evolution. We present here the analysis which allowed us to statistically determine properties of IR emitting galaxies in our clusters.
2. OBSERVATIONS
Seven objects extracted from the RASS have been observed by ISO, at 6.75 and 15 m with ISOCAM and at 90 m with ISOPHOT. From our X-ray/radio/optical, four clusters turned out to be very rich objects ranging from (Abell 1111) to (Abell 1300), and three objects appeared to be small groups with a central AGN (see Table 1) (??, hereafter L99). All observations were made with a pixel size of 6 arcsec, and each sky position as observed four times. The various environmental conditions are represented in those seven objects, fully described in several papers, and can be summarized as follow :
-
Abell 1300 : a post merging cluster containing a radio halo and a relic radio source (??, ??)
-
RXJ1104-2330 : a strong AGN of BL-Lac type possibly embedded in a small cluster or a large group of galaxies (L99)
-
Abell 1732 and Abell 1111 : two cooling flow clusters respectively large and small (, L99)
-
RXJ1032-2607 : probably a strong AGN in a small group of galaxies (L99)
-
RXJ1314-2516 : a new very interesting merging cluster of galaxies, containing probably a relic radio source (L99)
-
RXJ1315-4236 : a more nearby () AGN of BL-Lac type, in a group of galaxies (L99)
| Object | z | Field | LW2 | LW3 |
|---|---|---|---|---|
| name | of View | Jy | Jy | |
| Abell 1300 | 0.307 | |||
| RXJ1104-2330 | 0.187 | |||
| Abell 1732 | 0.193 | |||
| Abell 1111 | 0.165 | |||
| RXJ1032-2607 | 0.247 | |||
| RXJ1314-2516 | 0.244 | - | ||
| RXJ1315-4236 | 0.105 |
3. IR EMISSION IN ISOCAM FILTERS
As discussed by ??, the k-correction for distant clusters is a very important point when we look in the mid-IR wavelength. In our redshift range (), LW2 always includes only the m Unidentified Infrared Band (UIB) feature, but is more and more (with the redshift) contaminated by the rayleigh-jeans tail of red stars. The LW3 filter is less and less sensitive to the warm dust but is always contaminated by the m UIB feature and the m silicate absorption. Unfortunately, the interpretation of mid-IR properties is turning into a maze by this mixity of IR contributions.
4. RESULTS
4.1. What Kind Of Objects Did We Detect ?
First, two third of the objects detected by ISOCAM are optically identified as stars. On about 70 remaining galaxies, since we had optical spectra for 35 of them, we were able to evaluate the contamination by field galaxies. One third of the 35 appeared not to belong to the clusters, so by extrapolation, we expect that some 50 out of 70 are really clusters members. At our depth, 20 fields galaxies on the total area covered by our ISOCAM observation are in a good agreement with deep m count at 1 mJy from ELAIS (??). We detect as many galaxies at 6.75 m as at 15 m although very few of them are detected in both filters (about 15%). Detected galaxies are bluer (V-I ) than the mean cluster galaxy (V-I , which corresponds to ”normal” early-type galaxies at those redshifts) but their spectrum look like elliptical galaxies.
4.2. Radial Distribution Of ISOCAM Galaxies In Clusters
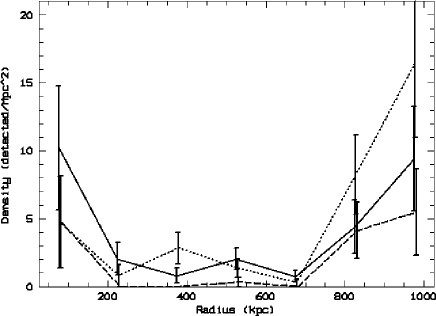
Figure 1 shows the radial distribution of a composite cluster made of all detected galaxies. The density in the center is only due to the central dominant (cD) galaxies which are 10-100 times more luminous in the optical that normal elliptical galaxies and thus expected to be more luminous also in the mid-IR. The main observation is that most of detected galaxies concentrate on the edge of the cluster. Below 750 kpc, only one galaxy is detected in both band (cD galaxies excluded) although about 20 galaxies are detected at 6.75 m or m. This may suggests that 6.75 m and 15 m galaxies are two different populations of galaxies. To the contrary, beyond 750 kpc, more than 50% of them are detected in both bands, so galaxies in this range may be a different population. The seven galaxies detected in both bands are bluer than the mean detected galaxies with an optical color of V-I , corresponding to Scd type.
4.3. Galaxies Detected Only At 6.75 m
This population may be the signature of the rayleigh-jeans tail of an old stars population, as :
-
1.
all cD galaxies are detected, and they are the most luminous galaxies of each clusters,
-
2.
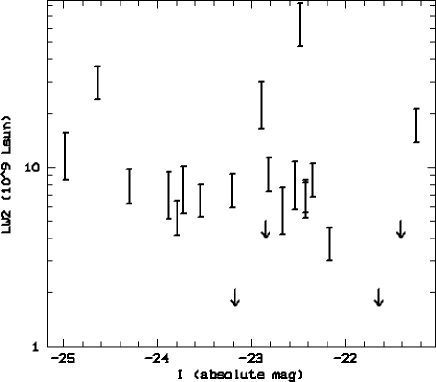
there is likely a correlation between LW2 and I flux (see Figure 2),
-
3.
the mean V-I color () is closer of ”normal” elliptical galaxy than others detected objects,
-
4.
regarding our 15 m completeness, we can be sure that most of galaxies detected at 6.75 m have a 15 m flux below the 6.75 m one, excluding intense star formation activity.
Even if many galaxies seen only at 6.75 m are detected beyond 750 kpc where elliptical galaxy density is much lower than in center, the low total number of them is fully compatible with the statistically normal density of early-type in outskirt regions.
4.4. Galaxies Detected At 15 m
It is well known that spiral galaxies in clusters are more concentrated in the external regions (??). Figure 1 shows that galaxies detected at 15 m are preferentially seen beyond 750 kpc, and much more than 6.75 m ones. Half of them are detected also at 6.75 m with flux ratio typical of photo-dissociation regions or star formation activity. Their optical colors are bluer than mean cluster galaxies.
4.5. Effects Of The Environmental Conditions
It could be a correlation between the number of detect galaxies at m and the X-ray luminosity in the [0.1-2.4 keV] band (L99). Since the X-ray luminosity is related to the richness of the clusters, this corroborates the suggestion of section 4.3. as most LW2 galaxies are luminous early-type galaxies. Other effects of environmental conditions are very hard to point out because of our low statistic (between 4 and 15 galaxies detected by ISOCAM per cluster).
4.6. Optical Correlations With Star-Forming Galaxies
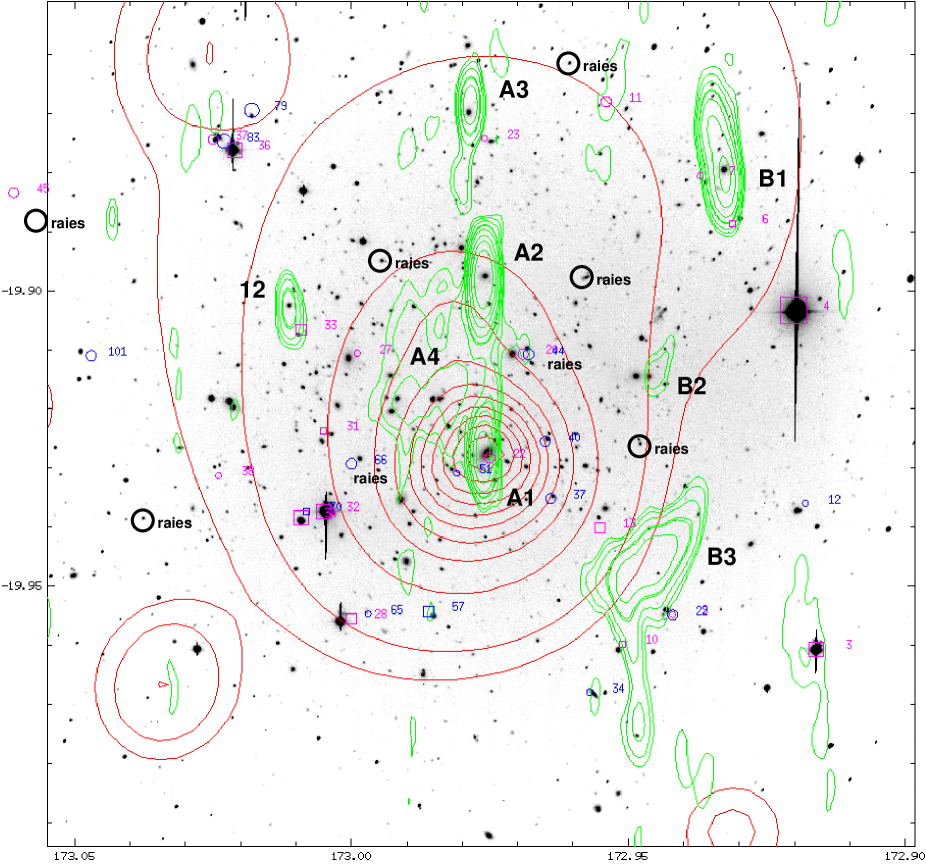
In the course of our optical follow-up, we have discovered that detected ISOCAM galaxies in medium distant clusters (at a sensitivity of 1 mJy) are not emission lines galaxies but very luminous elliptical, merging or interacting ones, which suggests non-trivial connections between star formation rate, optical and mid-IR properties (see Figure 3). However, the spectral resolution at which the redshift of these galaxies were measured (15 Å) does not allow us to identify any peculiar signature in the optical spectra of these objects, so that the exact origin of the IR emission remains unclear. This observation became a very scheming subject since IR deep surveys claim the existence of a population of galaxies with great IR fluxes in the past () with no peculiar optical signature (??, ??) and could be a new starting point to the comprehension of the stars formation history.
ACKNOWLEDGMENTS
The ISOCAM data presented in this paper was analysed using ”CIA”, a joint development by the ESA Astrophysics Division and the ISOCAM Consortium. The ISOCAM Consortium is led by the ISOCAM PI, C. Cesarsky, Direction des Sciences de la Matiere, C.E.A., France.
References
- Abell et al. 1989 Abell, G.O., Corwin, H.G., Olowin, R.P., 1989, ApJS 70, 1
- Aussel et al. 1998 Aussel, H., Cesarsky, C., Elbaz, D., Starck, J.L., 1998, A&A in press, astro-ph/9810044
- Dressler 1980 Dressler, A., 1980, ApJ 326, 351
- Elbaz et al. 1998 Elbaz, D. et al., 1998, ”NGST” 34th Liege Astrophysics Colloquium, eds. Benvenuti P. et al., ESA Pub., astro-ph/9807209
- Fadda & Elbaz 1999 Fadda, D. & Elbaz, D., 1999, this book
- L monon et al. 1997 L monon, L., Pierre, M., Hunstead, H., Reid, A., Mellier, Y., Böhringer, H., 1997, A&A 326, 34
- L monon et al. 1999 L monon, L., Pierre, M., Cesarsky, C.J. et al., 1999, in preparation
- L monon 1999 L monon, L., 1999, PhD. thesis, University of Paris XI, France
- Pierre et al. 1994 Pierre, M., Böhringer, H., Ebeling, H., Voges, W., Schuecker, P. et al., 1994, A&A 290, 725
- Pierre et al. 1996 Pierre, M., Aussel, H., Altieri, B. et al., 1996, A&AL 315, L297
- Reid et al. 1998 Reid, A.D., Hunstead, R.W., L monon, L., Pierre, M., 1998, MNRAS accepted
- Rowan-robinson et al. 1999 Rowan-robinson, M. et al., 1999, this book