A Review of Line and Continuum Correlations in AGNs
Abstract
We review the observational evidence for the Baldwin Effect, and the empirical behavior of emission lines in relation to multi-wavelength continuum emission for AGNs.
1 Introduction
It is a pleasure to review the observational basis for the Baldwin Effect (BE). Our meeting is timely for several reasons: the considerable progress in the field since the discovery of the BE, improved theoretical understanding of the emission-line region in quasars and active galactic nuclei (AGNs), the significant advances in multi-wavelength observations (from X-rays through to radio), and the prospects for future work that the new 8-10-m ground-based telescopes and space observatories will enable.
It is also appropriate that Jack Baldwin and Gary Ferland have taken the lead in organizing the meeting: Jack for his discovery and subsequent work on the BE and Gary for his work on developing theoretical and computing tools for understanding the emission-line regions of quasars.
We are glad to see Joe Wampler here. His work with Lloyd Robinson on developing the image tube scanner for the Lick 3-m telescope enabled Jack to make the observations that led to the discovery of the BE. The scanner was the first instrument that offered the requisite sensitivity, linearity, and broad wavelength coverage needed for the systematic study of emission lines in quasar spectra.
This paper is organized as follows. We give a brief history of the BE in the next section and a discussion of the selection and other effects that are important to its determination and interpretation. That is followed in §3 by a review of the current status of the BE, including different observational methods and analyses and the presence of the BE in other emission lines besides C iv. In §4 we consider more detailed luminosity effects, and in §5 we review the intrinsic BE, i.e., how the equivalent widths of emission lines change when the continuum level in a particular object varies. In §6 we discuss further systematics and phenomenology, such as which parts of the line profiles exhibit the BE and the X-ray BE. Then in §7 we review the BE in high-redshift objects and conclude in §8 with a summary and topics for future work.
2 History
2.1 Discovery
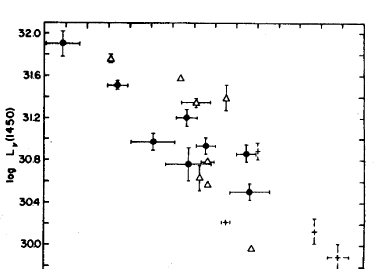
The discovery paper for the BE was Baldwin’s (1977a) article, which noted an anti-correlation of the equivalent width of the C iv emission line and the continuum luminosity of quasars on the assumption that their redshifts were cosmological. A copy of his original diagram is shown in Figure 1. The effect was pronounced: the equivalent width of the lines decreased by an order of magnitude as the continuum luminosity increased by 1.6 dex.
Baldwin (1977b) published another seminal paper that same year in which he noted that the observed average Ly/H intensity ratio in quasar spectra was significantly less than predicted for a recombination spectrum. Subsequently Baldwin et al. (1978) showed that the Mg II 2798 emission line also exhibited an anti-correlation with luminosity and used the BE to constrain cosmological models. They concluded that their data ruled out the local hypothesis for quasars and zero-pressure models with .
The first two papers mentioned above stimulated much work on quasar emission lines in the subsequent two decades. The third one pointed out the cosmological possibilities of the BE; however, the uncertainties were large enough to limit the usefulness of the technique, a problem that has continued to this day. One of the goals of this meeting is to see if our knowledge has advanced enough for quasars to be useful cosmological probes.
2.2 Doubts and Confirmation
After the original BE discovery paper (Baldwin 1977a), doubts were raised about its nature, reality, or utility for cosmological studies. Although we now regard the BE as well established, there are several effects that must be considered in any analysis of the BE:
-
1.
Selection Effects. Jones & Jones (1980) pointed out that faint quasars with weak emission lines would be difficult to observe and therefore cause a selection effect that could artificially enhance the apparent BE. Osmer (1980) showed that the slitless spectrum technique would systematically favor the discovery of strong-lined quasars at faint magnitudes in a manner that was also in accord with the apparent BE. More recently, Yuan et al. (1998) have shown that different dispersions in observational parameters can artificially produce luminosity correlations in data sets.
-
2.
Variability. Murdoch (1983) discussed how the variability of flat-spectrum quasars could account for much of the BE. For example, if the line emission stayed constant while the continuum decreased in brightness, the equivalent width would appear large when the object was fainter. In reality, both the line and continuum vary with time, which makes the situation more complicated. In any case, the effect of variability must be considered in analyses of the BE.
-
3.
Population Effects. Baldwin himself (1977a) noted in the BE discovery paper that the flat-radio-spectrum quasars showed the tightest correlation in the log (1450Å) log (C iv) diagram. A long-standing question has been whether other types of quasars exhibit the same BE as do the flat-spectrum objects. This question bears on the physical nature of the different types of quasars and AGNs as well as their usefulness as cosmological indicators.
-
4.
Evolution. If the physical nature of quasars varies with cosmic time, then the BE observed at one redshift might not be appropriate for quasars at a different redshift. The separation of evolutionary (redshift) effects from luminosity effects has been difficult in the flux-limited samples studied to date. The steep rise of quasar number counts with magnitude causes most of them to appear near the magnitude limit. This in turn will introduce a correlation of redshift and intrinsic luminosity into the data set in that the most luminous quasars will be those with the largest redshifts.
Now we will consider how all these effects have played out in subsequent studies of the BE.
Baldwin, Wampler & Gaskell (1989, BWG), building on earlier work, addressed the problem of selection effects for radio-loud quasars by obtaining spectra of all objects in a well-defined radio sample, so that objects with weak lines would not be omitted. For optically selected quasars, they used quasars selected by the ultraviolet excess (UVX) technique, which was based on quasars (primarily those with ) being much brighter in the ultraviolet than most stars and was less dependent on emission-line properties than the slitless spectrum technique111All observational techniques have selection effects (see, e.g., Wampler & Ponz [1985] and Peterson [1997]). The important thing is to account for them properly, which can now be done with well-defined samples based on quantitative selection techniques.. BWG demonstrated that the BE was indeed present in radio-loud quasars. They also pointed out that their data could not establish differences between the BE in the radio- and UVX-selected quasars because of the differences in the luminosity limits of the samples.
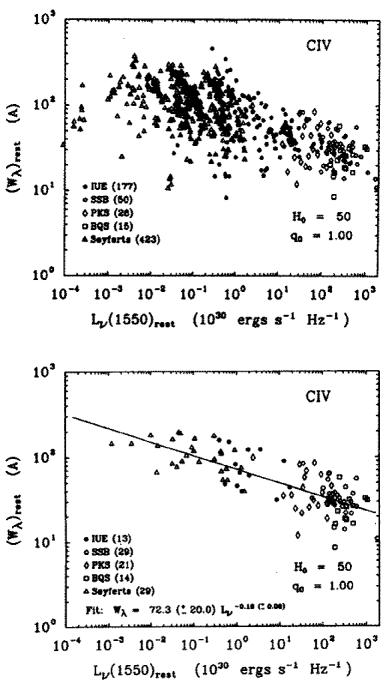
A next important step in confirming the reality of the BE was made by Kinney, Rivolo, & Koratkar (1990, KRK), who used IUE archival data for quasars and Seyfert galaxies to obtain a range of in continuum luminosity. Their data showed conclusive evidence for the BE being a real, physical effect (Fig. 2, upper). Furthermore, they were able to address the variability problem and show that it caused much of the scatter in their overall set of data. When they averaged multiple observations of different objects into single points, the scatter was much reduced (Fig. 2, lower).
Thus, by 1990, there was convincing evidence for the reality of the BE as well as for the importance of selection effects and variability, which is now known as the intrinsic BE. The intrinsic BE is an important subject in itself, and we discuss it in more detail below in §5.
The question of population effects on the BE has been more difficult to settle, with different investigators finding different results. One problem is that the intrinsic scatter in many of the properties of quasar and AGN spectra can mask effects like the BE, especially in small samples or ones that do not cover a sufficiently large range in luminosity, as the work of BWG and KRK made clear. A further complication when comparing radio-loud and radio-quiet systems is the necessity of working with samples that span the same range in luminosity, a point emphasized by BWG. Sargent et al. (1989) and Steidel & Sargent (1991) compared the behavior of radio-loud and radio-quiet sources matched in luminosity, and found indications supporting Baldwin’s claim of a stronger BE correlation for radio-loud QSOs222The radio-loud objects studied by Steidel & Sargent (1991) were primarily flat-spectrum (core-dominated) systems, although they found no significant differences between the behavior of flat- and steep-spectrum quasars within their sample.. However, a visual scrutiny of their results suggests that this is a question that would benefit from the study of larger samples spanning a broader luminosity range; the significance of correlations in the published plots often rests on the location of a very small number of points.
Zamorani et al. (1992) combined all data sets available at that time for optically selected quasars to make an improved investigation of the possible differences between radio- and optically-selected quasars. From data on the C iv line in 316 quasars, they found the presence of a BE, but with a slope about half the value of BWG for radio-selected quasars. Their slope was in good agreement with the KRK results, but the normalization was about half as large. They considered that variability of the quasars in the BWG sample with the strongest CIV emission was an important factor causing the difference between the radio and optically selected quasars. In the end, however, they did not think it possible to conclude there was a physical difference between the two classes of objects. A difficulty with this type of analysis is the inherent inhomogeneity in the data when equivalent widths are compiled from the literature; a large scatter in observed equivalent widths can result artificially from the disparate measurement methods employed by different researchers. Regrettably, we still appear to be in the situation where a comparison based on even larger and more carefully selected samples is needed.
Finally, the question of evolutionary effects in quasar spectra continues to be important and is just now becoming feasible to address. Here the difficulty has been in obtaining samples and especially follow-up slit spectroscopy of faint quasars/AGNs at high redshift. For samples with limiting magnitudes of, say, magnitude 21, objects at will have , far more luminous than nearby AGNs. A key project for large ground-based telescopes will be the discovery and spectroscopy of quasars with and — with such data a systematic and significant investigation of the evolutionary properties of quasar spectra will become possible.
3 Current Status
3.1 Observational Methods and Results
Our understanding of the BE has grown in recent years through application of several distinct approaches to the study of AGN emission lines. These techniques include:
1) Measurement of lines in high signal-to-noise ratio spectra, with bivariate analysis. This approach is the simplest to grasp, and the same as that employed by Baldwin (1977a), but improvements in technology have made it possible to study ensembles with very high signal-to-noise ratio. This method arguably reached its pinnacle in the studies by Laor et al. (1994, 1995) of quasar spectra acquired with HST. The data were of sufficient signal-to-noise ratio to permit deconvolution of line blends and accurate measurement of line wings, which are often lost in spectra with only modest signal-to-noise ratio. With a sample of only 18 QSOs, Laor et al. were able to discern a BE in nearly all of the lines of at least moderate strength between 1000 2000 Å (9 features in total), with the notable exception of N v 1240.
2) Construction of composite spectra. Subdividing a sample into luminosity intervals, and subsequently generating an average or median spectrum for each bin, offers several advantages for identifying luminosity-dependent behavior. Combining spectra into a composite decreases the shot noise present in any individual spectrum, and also diminishes the “noise” contributed by the intrinsic peculiarities of any single source. Composites permit identification of luminosity-dependent line effects by simple inspection, or more quantitative methods. Working with actual spectra, rather than line measurements, also makes it possible to distinguish luminosity-dependent behavior across the profiles of individual lines. Examples of this approach include studies by Véron-Cetty et al. (1983), Osmer et al. (1994, OPG), Laor et al. (1995), and Francis & Koratkar (1995). An example of such a comparison is shown in Figure 3, which compares composite spectra assembled by OPG for high- and low-luminosity quasars at . The BE is apparent from inspection of most of the stronger lines, and the direct comparison also reveals qualitative differences in the strength of the effect (e.g. large variation in C iv but only a small difference in the 1400 Å feature).

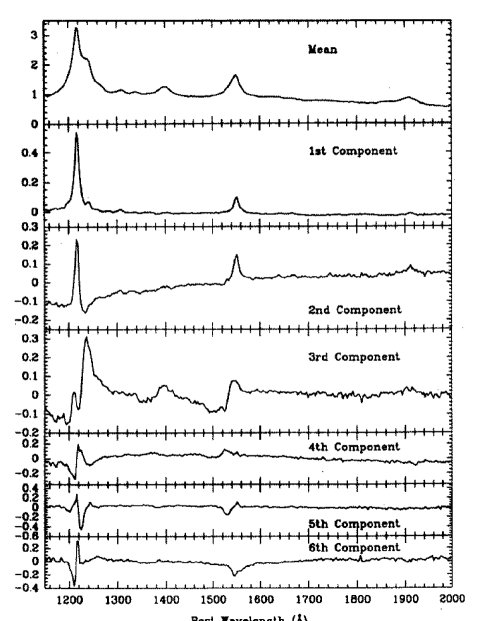
3) Principle component analysis (PCA). PCA examines correlations between the variances of parameters measured for a sample, and builds a minimum set of basis vectors across this parameter space that describes the total variance in the system (see Wills & Francis, this proceedings). PCA has been employed in two modes in the study of quasar spectra. The first directly examines variations in spectra, with the measured parameters comprised of the flux density as a function of wavelength after putting the spectra on a common normalization. Francis et al. (1992, FHFC) used this method to study the spectra of 232 objects with from the Large Bright Quasar Survey to classify the ultraviolet features. They found that the first three principal components accounted for about 75% of the observed variance in the spectra (Fig. 4). These components can be interpreted approximately as largely independent variables describing the strength of the emission line cores, the slope of the continuum, and the prominence of broad absorption line features.
The alternative application of PCA operates on a parameter set of quantities measured from the spectra, such as line equivalent widths, profile indices, etc. Boroson & Green (1992) published an influential study of this type, using optical rest-frame spectra of 87 QSOs in the Bright Quasar Survey with . In this case, 61% of the observed variance in the spectra was accounted for with three principal components, and the first eigenvector is dominated by an anticorrelation between measures of Fe ii and [O iii] line strength.
Conventional studies of line strengths as well as the innovations discussed above have led to reports of a BE in lines of Ly 1026, O vi 1034, Ly 1216, O i 1304, C ii 1335, C iv 1549, He ii 1640, Al iii 1857, C iii] 1909, and Mg ii 2798. Given the length of this list, it is of interest to examine those lines that apparently do not participate in the BE. Most studies have shown little or no evidence of a BE for the Si iv+O iv] 1400 blend (e.g., Cristiani & Vio 1990; FHFC; OPG; Francis & Koratkar 1995). The interpretation of this result is unclear, and the situation remains ambiguous in light of a strong BE signal for this feature reported by Laor et al. (1995).
Stronger concurrence is available for the behavior of N v, which essentially all studies indicate does not show a BE; the equivalent width of the line is apparently independent of source luminosity (e.g., OPG; Francis & Koratkar 1995; Laor et al. 1995). Hamann & Ferland (1992, 1993) have argued that this behavior can be understood as an abundance effect, with N v emission enhanced relative to other lines in luminous sources resulting from selective (secondary) enrichment of nitrogen in vigorously star-forming environments. Expressed in terms of line intensity ratios, the N v/C iv and N v/He ii ratios are enhanced in more luminous systems, and the study by OPG suggests that this is truly a luminosity, rather than redshift, effect. Under this interpretation of the N v line strength, the decoupling of (N v) and would result from the luminosity dependence of N enrichment largely canceling out the normal BE signature.
In the optical bandpass, several studies have addressed the luminosity dependence of broad H, which also presents little evidence of a BE (e.g., Yee 1980; Binette et al. 1993; Boroson & Green 1992). Only very limited information has been published on the luminosity dependence of the narrow emission lines. Baldwin (1987) has argued that the ultraviolet lines in luminous QSOs are unexpectedly weak, in comparison with Seyfert 2 galaxies (see also Wills et al. 1993b; Laor et al. 1994, 1995). Boroson & Green (1992) found a positive correlation, significant at 99% confidence, between absolute magnitude and ([O iii] 5007) for PG QSOs, consistent with a BE. Brotherton (1996) performed a PCA analysis on radio-loud quasars, and while no BE was apparent in a simple bivariate analysis for this sample, his first eigenvector displayed strong BE-like behavior in H and [O iii]. This trend is evidently masked by scatter from other parameters in the full spectra, leading to the lack of a simple correlation.
Even if the narrow lines do exhibit a BE, the extent to which this behavior shares an origin with the broad-line BE may be open to question. Wills et al. (1993b) have argued that the weakness of the UV narrow lines in luminous sources may be due to reddening by dust, part of which is associated with the narrow-line region (NLR) itself; but the broad-line region (BLR) is unlikely to harbor significant dust (e.g., Laor & Draine 1993). More generally, the NLR in QSOs may extend to kpc scales, at which point the properties of the emitting gas may be dictated primarily by the distribution of matter in the host galaxy rather than more exotic processes operative on small scales. If the NLR plasma resides in a disk with a scale height independent of the luminosity , a BE would in fact be expected. The length scale characteristic of the NLR will move out (increase) with . The solid angle describing NLR coverage scales with , so that the NLR covering factor, and hence equivalent width of line emission, will decrease in more luminous systems. This scenario is a variant of the “receding torus” model described by Lawrence (1991; see also Simpson 1998), whereby a dusty torus obscures less of the central nucleus in more luminous systems; the dust sublimation radius grows with increasing . In this picture, NLR emission arises in the unobscured cones along the torus axis. As the torus recedes, the cones expand in opening angle, and the covering factor of NLR gas may then increase with larger . The luminosity dependence of narrow-line emission in AGNs may thus yield interesting insights into AGN structure, but may have only limited connection to the classical broad-line BE333The ambiguity inherent in ascribing common physical processes to sources with similar phenomenology is underscored by the claim that Wolf-Rayet stars exhibit a BE (Morris et al. 1993)..
3.2 Slope as a Function of Ionization
For those lines that show a BE, the growth in observations now makes it possible to go beyond testing for correlations, by measuring and comparing the slopes of versus for different lines. Several studies have completed this exercise, and produced evidence that lines of relatively high ionization, such as C iv, exhibit systematically steeper slopes in the Baldwin diagram than lines of lower ionization, such as Mg ii or Ly (e.g., Wu et al. 1983; Kinney et al. 1987; KRK; Baldwin et al. 1989; Zheng et al. 1997). This result is sometimes expressed in terms of the luminosity behavior of line ratios, such that, for example, Ly/C iv and C iii]/C iv appear to increase systematically with increasing luminosity. The existence of this trend was confirmed at this meeting by Brian Espey, who reported results for the BE based on a very large sample of AGN spectra. Zheng, Kriss, & Davidsen (ZKD, 1995) found a particularly steep BE for the O vi line, consistent with its high ionization. ZKD’s study benefited from inclusion of HUT spectra for low-redshift objects, which resulted in a wide baseline in luminosity for analysis. An apparently contradictory finding was reported by Paul Green (1996), however, who found no statistically significant BE in O vi for an overlapping sample drawn from the IUE archive; Green emphasized the importance of including upper limits in the Baldwin diagram when testing for correlations. Nonetheless, Green considered the ZKD result to be valid because of their detection of ø6 in all their objects and because their sample covered a larger range in luminosity than his444A further potential complication for study of the ø6 BE is the influence of the unresolved Ly forest. In many samples, luminosity is strongly correlated with redshift, so that high-luminosity objects are at relatively high ; features shortward of the Ly emission line may thus be preferentially corrupted in the high-luminosity systems. Since the Ly forest affects both the ø6 line and adjacent continuum, in a formal sense this is unlikely to produce an artificially steeper BE, but should merely increase the scatter at high luminosity. But a bias may nonetheless result if line measurement algorithms are not robust to the diminished signal-to-noise ratio and modified line profiles resulting from Ly forest absorption. Future studies of the ø6 feature would benefit from some simple modeling of the statistical influence of the Ly forest on measured line strengths..
The fact that different lines show different slopes in the Baldwin diagram is important for understanding the BE theoretically. A simple luminosity dependence of broad-line-region (BLR) covering factor for the central continuum source should lead to similar variations in for all lines. Likewise, simple models invoking inclination variations of accretion disks (which produce an anisotropic continuum radiation field) as the source of the BE do not predict different slopes for different lines. The trend of steeper slopes for lines of higher ionization is an important clue that must be accommodated by alternative explanations for the BE. Dust internal to the BLR could potentially introduce BE-like behavior if cloud properties conspire to produce more absorption for higher (Shuder & Macalpine 1979), but is unlikely to produce the observed ordering, even if dust were able to survive in this inhospitable environment.
Several scenarios that take into account the ionization dependence of the BE have been advanced. Mushotzky & Ferland (1984) argued that this behavior was consistent with a luminosity dependence of the ionization parameter (ratio of ionizing photon and particle densities) for the BLR clouds, such that was less in more luminous sources. Since provides an indicator of the degree of ionization for a photoionized cloud, this prescription takes explicit account of the BE ionization dependence, although the underlying cause of a correlation is not obvious. This model does not predict a BE for Ly, however, and this line might actually be expected to increase in equivalent width as diminishes (Shields & Ferland 1993); an additional luminosity dependence of covering factor may be required to fit the observations. Shields et al. (1995) recast this formulation as a luminosity dependence of coverage by high- clouds; this scenario was motivated in part by reverberation-mapping evidence for matter-bounded clouds, coupled with a luminosity dependence in outflow (signaled by narrow blueshifted resonance absorption in Seyferts versus broad absorption lines in QSOs) that may affect the coverage of tenuous components of the BLR.
A final interpretation that is gaining considerable support views the ionization trend in the BE as the consequence of a luminosity-dependent continuum spectral energy distribution (e.g., Schulz 1992; Netzer et al. 1992; Zheng et al. 1992; Zheng & Malkan 1993; Green 1996, 1998; Wang et al. 1998; Korista et al. 1998). In this picture, more luminous AGNs feature softer ionizing continua; the reduction in ionizing photons at a given optical/UV luminosity leads to smaller equivalent widths, with the high-ionization lines responding most strongly, due to their greater sensitivity to the high-energy continuum. This explanation has several attractive features. First, some accretion disk models naturally predict a softer continuum for more luminous systems (e.g., Netzer et al. 1992). Second, observational evidence exists in direct support of the requisite continuum behavior. These data are often cast in terms of the luminosity dependence of , the two-point spectral index connecting 2500 Å and 2 keV in the source rest-frame (e.g., Zamorani et al. 1981). The role of selection effects and photometric errors in defining these trends continues to be of concern, however (e.g., La Franca et al. 1995), and a recent paper by Yuan et al. (1998) on this subject provoked much discussion at this conference.
4 Detailed Luminosity Effects
4.1 The Importance of Luminosity Range
In §2.2 we commented on the importance of having a sufficiently large range in luminosity to detect and study the BE. Selection effects and intrinsic scatter in the properties of quasar spectra can mask the appearance of the BE. We also mentioned that the KRK study provided some of the most conclusive evidence for the BE because their sample spanned 7 orders of magnitude in luminosity.
The fact that the BE is seen over such a large luminosity range has theoretical implications, in addition to observational uses. This finding provides another challenge to models that rely solely on disk inclination effects or other sources of continuum beaming to produce a BE (KRK; Francis 1993); these scenarios can generally reproduce a BE-like correlation over only orders of magnitude in . Variability was suggested early on as the source of the BE (Murdoch 1983), but the typical amplitude of variability seen to date in Seyfert nuclei and normal QSOs is order of magnitude, rather than 7, and when AGNs do vary, they appear to trace out a locus in the plan that is distinct from that of the ensemble BE (KRK; see also §5).
Given the existence of large scatter in the Baldwin relations, is it possible to understand the origins of this dispersion? Inclination or other beaming phenomena, if not responsible for the BE, may provide a source of scatter in the correlation (Netzer et al. 1992); however, this effect is unlikely to dominate the scatter, since predictions of the resulting equivalent width distributions appear to be inconsistent with the observations (Francis 1993). Variability clearly is a source of scatter in the BE, at least at low luminosities. Korista et al. (1998) have recently suggested that metallicity is another probable source of scatter in the overall trend. This last hypothesis may be testable via use of the N v line strength as a crude indicator of abundances within the broad-line media.
4.2 Second Order Effects
While the BE is usually parametrized quantitatively by the slope of a straight line in the diagram, there is considerable evidence suggesting that curvature exists within the Baldwin trends. The sense of this behavior is that the BE exhibits a steeper slope at higher luminosities (e.g., Véron-Cetty et al. 1983; Wu et al. 1983; KRK; OPG). The flattening at low luminosities has resulted in suggestions by some authors that Seyfert nuclei do not participate in the BE, but instead have equivalent widths independent of luminosity (e.g., Wampler et al. 1984). Discerning luminosity-dependent behavior within Seyfert ensembles is again complicated by substantial scatter about any underlying trend, with much of the dispersion stemming from intrinsic variability (e.g., KRK). What seems clear from existing studies, however, is that Seyferts connect smoothly with QSOs in the Baldwin diagrams; when all luminosities are considered together, the BE displays strong indications of curvature, although we note that quantitative measures of this curvature will depend at some level on the choice of cosmology () for calculation of quasar luminosities.
The causes of curvature in the BE remain uncertain. Wamsteker & Colina (1986) noted the similarity between curvature in the BE and a similar curvature (i.e. nonlinear response; §5.1) in the Baldwin diagrams for individual variable sources. They argued that both phenomena could be interpreted as the result of a transition of the BLR to a matter-bounded state for luminous sources. While matter-bounded nebular components may well contribute to curvature in the Baldwin diagrams, a global transition to a matter-bounded state generally predicts that the Ly/C iv and C iii]/C iv ratios should decrease at higher luminosities (Shields et al. 1995), in conflict with the observed trends (§3.2). The relationship between the ensemble BE and phenomenology of variable sources is considered in more detail in the following section. An alternative explanation for curvature in the BE was advanced by Netzer et al. (1992), who generated a similar pattern theoretically, using thin accretion disks with random inclination and luminosity-dependent spectral energy distribution (SED). As noted earlier (§4.1), this model has been criticized on the basis of its predicted distribution of (Francis 1993); the theoretical treatment of accretion disks (or other continuum sources) in AGNs is also the subject of continuing discussion and debate.
5 Variable Luminosity
5.1 The Intrinsic BE
Variability is now recognized as a probable source of scatter in the ensemble BE, rather than its origin, and the observed (negative) correlation between luminosity and equivalent width in individual variable sources has become known as the “intrinsic Baldwin Effect” (Pogge & Peterson 1992). An intrinsic BE is commonly observed for most of the strong UV lines in Seyfert galaxies. Different lines exhibit different slopes, as in the ensemble case, and there are some indications that the higher ionization lines again show a systematically steeper relation. For variable objects, the trend is often expressed in terms of line versus continuum fluxes, rather than equivalent width versus luminosity; the intrinsic BE then appears as a nonlinear correlation in this plane (or a slope less than unity in a log-log plot; see Figure 5). The physics underlying the intrinsic BE may be quite different from that of the global trend, but the resemblance remains intriguing and the study of variable sources offers additional relevant information on broad-line region structure.

Several explanations have been advanced to account for the intrinsic BE. One possibility, discussed previously for the ensemble BE (§3.2), is that the trend arises from a luminosity dependence of the ionizing continuum shape, such that the continuum becomes softer when it brightens. In this scenario, the optical/UV continuum luminosity varies with greater amplitude than does the far-UV/X-ray continuum; the line emission, responding to the high-energy radiation, thus varies less strongly than the observable continuum, resulting in a nonlinear relation between the two.
The luminosity dependence of continuum shape can be tested directly for variable sources via simultaneous monitoring at UV and X-ray energies. Assembling the requisite data sets with reasonable temporal coverage remains challenging, however, and at present only a handful of sources have received such scrutiny. The results are heterogeneous: Fairall 9 exhibited some degree of correlation in the expected sense, with variability amplitudes greater in the UV bandpass than in X-rays (Clavel et al. 1989); but in NGC 5548 the fluxes at 1350 Å and keV scaled together by similar factors (Clavel et al. 1992), and an intensive monitoring campaign for NGC 4151 found a higher amplitude of variation at keV than in the observable UV bandpass (Edelson et al. 1996). The lack of a clear signature is underscored by recent intensive monitoring of NGC 7469; the UV and X-ray fluxes for this source varied with comparable amplitude, and moreover exhibited only a weak degree of correlation (Nandra et al. 1998). Studies restricted to the optical/UV bandpass have also examined the luminosity dependence of continuum shape, and to the extent that any trend is present, the observable continuum appears to get harder with increasing luminosity in variable sources (e.g., Edelson et al. 1990).
A second potential cause of an intrinsic BE stems from ionization and temperature effects in broad-line region clouds subject to a changing radiation field. The most straightforward example is provided by matter-bounded (“optically thin”) clouds, which can undergo a global change in characteristic ionization state as the ionizing continuum fluctuates; this behavior contrasts with that of high column-density clouds, which retain a region contributing intermediate- and low-ionization emission for any continuum level. For thin clouds, the result can be a positive, null, or negative response in a given line to changes in the continuum (Figure 6), with reduced response contributing to an intrinsic BE.

Several lines of observational evidence support the presence of an optically thin component in the BLR of AGNs. These include:
-
1.
Evidence of negative line response for clouds in the inner BLR. Sparke (1993) examined light curve data for NGC 5548, and noted that the line autocorrelation function for prominent UV features was narrower in width than the autocorrelation function for the continuum, in conflict with expectations for photoionized clouds described by a positive line response.
-
2.
The strength of high ionization emission features such as O vi 1034 and Ne viii 774. The prominence of these features may require a distinct, highly ionized, and presumably optically thin component within the BLR (Netzer 1976; Davidson 1977; Hamann et al. 1998).
-
3.
The luminosity dependence of the C iv/Ly line ratio. Photoionization calculations for thick clouds generally predict that this ratio will increase as the continuum brightens (e.g., Ferland & Persson 1989), while a number of Seyfert galaxies show the opposite trend. A very soft continuum can sometimes reproduce the observed behavior (Gondhalekar 1992), but often has difficulty in simultaneously matching the line equivalent widths. A mix of thick and thin clouds provides an alternative that can account for the observed line responses and strengths (Shields et al. 1995).
-
4.
X-ray “warm” absorbers. These highly ionized components are now known to be present in a large fraction of Seyfert nuclei (e.g., Reynolds 1997; George et al. 1998). Variability and recombination timescale arguments have been used in a few cases to bound the absorber location to a scale comparable to the BLR (e.g., Otani et al. 1996). In these instances the absorber may represent the high-ionization extension of the BLR; the same material would be expected to emit efficiently in the Ne viii line. Warm absorbers are unambiguously matter-bounded systems.
A further possible contributor to an intrinsic BE arises from radiative transfer effects within the broad-line clouds. Line photons with energy sufficient to ionize hydrogen from the state can be destroyed via Balmer continuum absorption. Balmer continuum opacity is expected to scale in proportion to the ionizing flux incident on a cloud, so that the efficiency of line destruction increases in higher luminosity states (see Shields & Ferland 1993 for details). The result is a nonlinear response in the line. This effect is important for Lyman , as demonstrated by explicit calculations, and is also expected to be relevant to varying degrees for other lines. At present, no means appear to be available for isolating this behavior from other contributors to an intrinsic Baldwin Effect.
A final basis for generating an intrinsic BE originates in light travel-time effects in variable sources. In the observer’s frame, line emission from circumnuclear clouds is expected to respond to continuum variations with a delay, resulting from the added path length for the continuum light to reach clouds outside our line of sight, plus path length variations for the emitted line radiation that depend on the geometrical distribution of clouds. Correlation analyses of Seyfert light curves provide abundant evidence for such delays, which form the basis for reverberation mapping studies of BLR structure. Pogge & Peterson (1992) have emphasized that the resulting phase offset between the continuum and line light curves is a source of scatter for the intrinsic BE; removal of a characteristic “lag” between the two light curves results in a tighter correlation between line and continuum flux.
A complication to this general picture arises because there is unlikely to be a single lag that is appropriate for all the emitting components in the BLR. The emission-line response to continuum variations is both time-shifted and smeared by light travel-time effects determined by the three-dimensional structure of the BLR. As a result, there will be a general tendency for some of the emission components to be referenced to an inappropriate continuum level, regardless of the choice of a lag. The resulting phase offsets will lead to larger at low continuum states, and smaller in high states, compared to the predictions for idealized clouds with no light travel-time delays. The general role of such delays in producing an intrinsic BE may be even stronger, however, if significant emitting gas is present at large distances from the continuum source, such that the light crossing time for the cloud distribution is considerably greater than the timescale of variability in the continuum. In this case the emitting aggregate of clouds may contribute a nearly constant line flux while the continuum undergoes substantial variation, leading to a strong BE. The existence of substantial emitting gas at large radius within the BLR can be difficult to exclude or constrain (e.g., Done & Krolik 1996).
To summarize this section, several causes may contribute to the intrinsic BE observed in variable AGNs. These include a luminosity-dependent continuum shape, the influence of matter-bounded clouds, luminosity-dependent optical depth effects, and time delays for light propagation across the BLR. Light travel-time effects are known to be operative at some level, while the importance of continuum shape for the intrinsic BE is less certain. The relevance of the other two factors, thin clouds and optical depth effects, will depend on the aggregate distribution of cloud properties in the BLR, since reduced emissivity in one subset of clouds may be overwhelmed by growth in emissivity elsewhere. We consider this point in more detail in the following section.
5.2 The Intrinsic versus Ensemble BE
Detailed comparisons of the global and intrinsic BEs have drawn attention to the different slopes exhibited in Baldwin diagrams for the two trends, with the intrinsic effect systematically steeper in versus (e.g., KRK). As a quantitative example, AGN ensembles plotted in the (C iv) versus continuum luminosity plane typically display a logarithmic slope of to (Korista et al. 1998 and references therein), while variable sources display slopes of to (KRK; Edelson et al. 1990). While this contrast may be ascribed in general terms to the differences between static and time-variable systems, some additional examination of this issue is potentially informative.
Quasars and Seyfert galaxies have quite similar spectra, to first order, which implies that their broad-line regions scale in some nearly uniform sense, in terms of covering factor, velocity field, density, ionization parameter, etc. The ensemble Baldwin Effect tells us that this scaling is not altogether homologous, although the luminosity dependence is weak – a factor of 10 variation in (C iv) over 6 orders of magnitude in . Quasars evidently undergo significant evolution in luminosity, and we can thus consider the behavior of line emission as a Seyfert evolves to a quasar, or vice versa. A variable Seyfert nucleus (e.g., Fairall 9, with a factor of 30 variation in luminosity; see Figure 5) arguably represents this process in miniature. That being the case, it is perhaps surprising that the intrinsic and global BEs are so different, i.e., Seyfert nuclei do not simply slide along the locus of the ensemble relation as they vary.
Some perspective on the intrinsic versus ensemble behavior can be derived from considering quasar luminosity evolution in conjunction with the locally optimally-emitting cloud (LOC) model for the BLR (Baldwin et al. 1995). The essential idea of the LOC model is that clouds emit with high efficiency in a given line only in a rather restricted portion of the parameter space of cloud density and incident ionizing flux (or distance from the continuum source)555Column density represents another free parameter describing the clouds, and the distribution of column densities will influence the proportions of ionization- and matter-bounded clouds.. If we consider an ensemble of clouds surrounding a continuum source, we can imagine correspondingly a zone in radius where clouds with the appropriate density will dominate the total emission in, say, C iv; clouds at smaller radii are either too dense or too highly ionized to emit strongly in this line, while clouds at larger radii will have little C+3 or lie outside the BLR. If we were to increase the luminosity of the central continuum source, the radius describing the region of efficient C iv emission would move outward. The effect on (C iv) would then depend on cloud covering factor as a function of radius (see Figure 7).
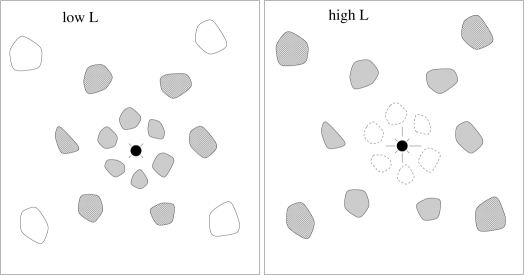
If the covering factor of the clouds diminishes rapidly with radius, we would expect the line equivalent width to decrease as the source brightens (a Baldwin Effect); correspondingly, radial distributions should also exist that would yield an increase in equivalent width for higher (an anti-Baldwin Effect). What radial distribution constitutes the intermediate case, corresponding to the homologous BLR? To obtain independent of , the fractional coverage represented by clouds with a given density, within an interval of incident flux , should be independent of . The relevant differential covering factor is then
| (1) |
Note that , so that . If we express , then , and
| (2) |
which is homologous and independent of if .
If the intrinsic Baldwin Effect ultimately stems from a steep fall-off in circumnuclear covering factor (), then the luminosity evolution of AGNs must be accompanied (perhaps unsurprisingly) by substantial structural changes within the BLR, in terms of the distribution of matter. A less violent adjustment is required for a homologous profile, which in turn provides a natural basis for producing grossly similar Seyfert and quasar spectra. The structure of thus contains potentially significant information on the physical evolution of AGNs.
An important independent constraint on is available from global fits to quasar spectra. Baldwin (1997) has reviewed the LOC model and its predictions for relative line strengths as a function of , parametrized in terms of the differential power-law index . As can be seen from his Figure 1, good agreement with the average quasar spectrum is obtained with , which may imply that the BLR is indeed homologous. In this case the dominant cause underlying the intrinsic BE is likely to be variability and light travel-time effects, as discussed in the previous section. Further comparisons of this type, perhaps including added constraints from linewidth measurements, may provide stronger constraints on and hence BLR structure, as well as the origins of the intrinsic BE.
6 Further Systematics and Phenomenology
6.1 Line Profile Issues
Another means of investigating the BE and its underlying physics is to examine the luminosity dependence of emission as a function of velocity within the line profile. OPG examined difference spectra between high- and low-luminosity composites, and demonstrated that most of the variation in equivalent widths stems from changes in the strength of the line core. Another way of stating this result is that the variable component has a full-width at half maximum (FWHM) that is narrower than the overall profile. This finding bears an intriguing similarity to the results of the PCA analysis of FHFC, which found that most of the variance in quasar line strengths (as quantified in their first principal component) derived from modulations in the emission line cores666A PCA analysis of IUE spectra for variable Seyfert nuclei revealed a quite different behavior, with the line wings showing the strongest fluctuations (Türler & Courvoisier 1998). The contrasting behavior of the intrinsically variable sources can probably be attributed to the strong influence of light travel-time effects on the response across the line profile.. The role of the core, or “intermediate line region” (ILR; Wills et al. 1993a) component in this regard is also suggested by significant negative correlations in QSO spectra between line velocity width and equivalent width (e.g., Francis et al. 1993; Wills et al. 1993a; Brotherton et al. 1994b). Detailed models of the ILR (Wills et al. 1993a; Brotherton et al. 1994a) predict only weak contributions to the H and 1400 features, consistent with the little evidence for a BE in these lines (§3.1).
Understanding the BE as purely a line-core phenomenon is not without complications, however. FHFC used their PCA eigenvectors to explore the relative contributions of line cores and wings to the BE, and found that the wings acted as an important contributor to the BE. Additional evidence for a BE in the line wings has been presented by Francis & Koratkar (1995), who argued that the red wing of C iv in particular displayed a luminosity dependence (see also Corbin & Boroson 1996). A common thread throughout these studies, however, is that the strength of the BE (i.e. fractional change in ) is greater for the line core than for the line wings, in general accord with the results from OPG.
If we take the link between line core variation and the BE at face value, this finding may have important theoretical consequences. If the BE is ultimately a consequence of the luminosity dependence of the continuum SED in QSOs (§3.2), it is perhaps surprising that the line core and wings do not show comparable response to continuum hardness variations. This result may point to rather specific distributions of cloud properties as a function of radius, if the velocity field of the BLR is Keplerian (e.g., Brotherton et al. 1994a). Korista et al. (1997a) have published a grid of BLR predictions as a function of continuum SED and cloud properties, which might be explored for this purpose; our brief inspection of their figures did not lead to an obvious prescription for matching the observations, however. An alternative solution might entail anisotropic continuum emission such that different cloud components within the BLR see a different ionizing SED. While this represents a more complicated scenario, it would not be altogether surprising in light of analyses implying that the ionizing continuum incident on the BLR clouds is not the same as what we see (Korista et al. 1997b) – which opens up more general worries concerning the validity of invoking a luminosity-dependent SED, derived from measurements, for explaining the BE.
Finally, while the line core strength may be fundamental to defining the BE, it is important to recognize that there is considerable variation in the cores, and the overall line strengths, which is apparently unrelated to source luminosity. These variations thus appear as scatter in the Baldwin diagrams; physically this range of behavior may trace differences in orientation or structure of the BLR and continuum source. The extent to which core modulation and the BE are in fact distinct phenomena is suggested by the properties of the first eigenvector identified in the PCA analysis by FHFC. In comparison with the other eigenvectors, this component features strong, relatively narrow emission lines, described by a large Ly/C iv ratio. As a result, when this component weakens, the line cores and overall equivalent widths diminish, which would be consistent with the trend with increasing luminosity seen in the BE; but the diminution of this component is accompanied by a decrease in the composite Ly/C iv ratio, which runs counter to the observed correlation with (§3.2). While the FHFC first eigenvector may capture much of the variance in QSO spectra, other parameters clearly come into play in establishing their luminosity-dependent behavior.
6.2 Radio-loud versus Radio-quiet
The evidence suggesting that the strength of the BE is related to source radio properties (§2.2) is worth further consideration in light of larger trends in quasar phenomenology. Comparative studies of radio-loud and radio-quiet QSOs have revealed a number of detailed spectroscopic differences, and some of these disparities may contribute to the contrast suggested in the Baldwin diagrams. Several analyses have established that radio-loud quasars display Ly and C iv lines with narrower profiles and larger average than do radio-quiet sources (Francis et al. 1993; Wills et al. 1993a; Brotherton et al. 1994b; Corbin & Francis 1994). Another way of stating this result is that the emission features for the radio-loud objects are more dominated by the line core than their radio-quiet counterparts. If the BE is driven primarily by changes in the line core (§6.1), then objects with emission lines dominated by the core component – i.e., the radio-loud objects – might be expected to show a cleaner correlation, consistent with the putative observational trend.
6.3 The X-ray BE
One of the distinguishing features of quasars and AGNs is that they emit over virtually the entire electromagnetic spectrum, from -rays to radio wavelengths, and their optical/UV radiation is only a fraction of the total emitted. Furthermore, radiation at other wavelengths almost certainly provides some of the most important keys for understanding both the BE and the nature of quasars themselves. Multi-wavelength observations are a vital part of quasar/AGN research.
The BE was discovered in the UV part of the spectrum, and observational constraints as well as atomic physics have dictated that studies of the luminosity dependence of broad-line emission are conducted almost exclusively in the rest-frame UV/optical bandpass. Improvements in the sensitivity and spectral resolution of X-ray telescopes have resulted in the detection of an important new line diagnostic of AGNs, in the form of the Fe K line at 6.4 keV. This feature is believed to form by fluorescence in high column-density material irradiated by an X-ray continuum. The observed K emission from Seyfert 1 nuclei can be very broad, and has been modeled as fluorescence in a relativistic accretion disk (Nandra et al. 1997b and references therein). Narrow components are also observed, however (e.g., Guainazzi et al. 1994), which may arise from structures such as a circumnuclear torus of high column density matter (Krolik et al. 1994; Ghisellini et al. 1994).
The recent availability of X-ray spectra of QSOs with decent spectral resolution has made it possible to investigate the luminosity dependence of Fe K. Iwasawa & Taniguchi (1993) employed GINGA spectra to argue that K equivalent widths were systematically weaker in more luminous systems, and drew attention to the parallel with the ultraviolet BE. While this finding was subsequently challenged (Nandra & Pounds 1994), a recent analysis based on ASCA spectra (Nandra et al. 1997a), reviewed by Paul Nandra at this conference, lends strong support to a BE for the Fe K line.
Several interesting comparisons can be made between the detailed phenomenology of the UV and X-ray BEs. The existence of an X-ray BE and its parallel in the UV lines initially led Iwasawa & Taniguchi to argue that this constituted evidence of a physical origin of the K emission in the BLR. However, the X-ray correlation appears to be strongly influenced by a luminosity dependence in the K wings, in contrast with the core-dominated UV trend. Under the existing interpretations of the K profile, this behavior can be taken as evidence that the X-ray BE is largely an accretion disk phenomenon. A connection between the K emission and the BLR may still be possible if the high-ionization broad lines are largely produced in a disk structure (e.g., Murray & Chiang 1998). While additional detailed physics is required to account for the different line profile behaviors of the UV features and K lines, a further interesting similarity exists in that the BE for K is strongest in the red wing, in agreement with the UV trend.
Fluorescence of Fe K in the AGN context is apparently part of a larger pattern of spectral “reflection” signatures, resulting from scattering and emission by X-ray-irradiated media with large column density, which also include a Compton-reflection hump peaking in flux density at keV and Fe K-edge absorption at keV; theoretical studies predict an additional reflection component of thermal emission that would contribute to the optical/UV “Big Blue Bump” (BBB; Guilbert & Rees 1988; Lightman & White 1988). Nandra et al. (1995) have pointed out an important difficulty in associating the BBB with reflection, in that luminous QSOs that typically exhibit a prominent BBB (as parametrized, for example, by a steep ) also exhibit weak reflection signatures in the X-ray bandpass, i.e. weak K and Compton reflection features. This result strongly suggests that processes other than reflection/reprocessing of the X-ray continuum dominate the generation of the optical/UV continuum in AGNs.
The X-ray BE shows some dependence on source radio properties, with radio-quiet QSOs featuring characteristically larger for K than radio-loud sources show (Nandra et al. 1997a; Reeves et al. 1997). This result runs counter to the UV pattern. A possible means of reconciling these findings is to postulate a beamed component to the X-ray continuum in radio-loud sources, which is seen by us777This picture assumes that radio-loud objects for which our line of sight falls outside the beam would generally be classified as something other than quasars – e.g., FR ii radio galaxies (Barthel 1989). and the broad-line clouds but not by the medium responsible for Fe K fluorescence. This component would give rise to greater heating of the BLR clouds and hence the observed enhancement in UV line strengths, while strengthening the observed X-ray continuum and thus diluting the K equivalent widths. An anisotropic component to the ionizing continuum might well be expected for radio-loud sources, which show evidence of relativistic outflows that naturally produce beamed radiation fields in the observer’s frame. An anisotropic component to the X-ray emission has been suggested previously for other reasons (e.g., Browne & Murphy 1987), and an enhancement of this component in radio-loud sources would be consistent with the fact that radio-loud quasars are characteristically harder in than radio-quiet systems (e.g., Zamorani et al. 1981).
AGNs show substantial variability in the X-ray continuum, and recent work has also revealed detections of variability in Fe K emission in individual sources (Iwasawa et al. 1996; Yaqoob et al. 1996; Nandra et al. 1997c; see also Iwasawa & Taniguchi 1993). The existing studies do not provide a clear basis for drawing an analogy between the behavior of K, and the intrinsic BE seen in UV lines; the degree to which K flux is correlated with the continuum in variable sources is ambiguous at this point, and may be a complicated function of velocity across the line profile. Improved measurements are of more general interest for study of AGN structure on very small scales. Iwasawa & Taniguchi (1993) have also discussed variability in relation to the global X-ray BE, and suggest that the range in luminosity over which the correlation is observed ( orders of magnitude) argues, as in the UV case, against variability as the source of the ensemble trend.
7 The Baldwin Effect at High Redshift
7.1 Evidence of Evolution
Given the difficulties and ambiguities in delineating the BE in QSOs at low and moderate redshift, it is not surprising that only limited attention has so far been given to the possibility that the BE evolves with time. Francis & Koratkar (1995) combined IUE data and optical spectra of LBQS quasars to study the evolution of quasar spectra with redshift over the interval from 0.4 to 2.2. Both the low- and high-redshift samples displayed a BE of comparable amplitude, as measured for C iv and Ly. However, these researchers found that the UV spectra of radio-quiet quasars do evolve between redshift 2 and the present in the sense that the high-redshift quasars have a population with weak-line cores that is not seen in the IUE sample. The question of evolution of spectral properties with redshift is important for at least two reasons: 1) any evolution would affect conclusions drawn from the BE about cosmological parameters, and 2) spectral evolution could provide clues about the evolution of quasars and AGNs themselves. One difficulty in the interpretation of the findings by Francis & Koratkar rests with the IUE sample, which was not well-defined in any sense, but rather represented what was available in the archive. A similar analysis with better sample selection criteria would be preferable. This is a topic that definitely needs continued study.
7.2 Preliminary Results at
Quasars at the highest known redshifts potentially offer the strongest leverage on cosmological parameters, and the opportunity for studying high- QSOs has grown rapidly in recent years with the discovery of an increasing number of sources at . Observational results for QSOs were reviewed at this conference by Shields; in mid-1998 there are approximately 90 such objects reported in the published literature. Spectroscopic properties for major subsets of these sources have been reported previously by Schneider et al. (1991), Storrie-Lombardi et al. (1996), and Shields & Hamann (1997).
To first order, QSOs at high appear very similar spectroscopically to sources at lower redshift. A composite spectrum derived from observations of 21 QSOs with is shown in Figure 8. The apparent normality of the emission-line spectra of quasars is actually a striking feature when one considers that the lookback time is greater than 90% of the age of the universe (for ). To the extent the emission spectra of quasars reflect the abundances of elements like C, N, and O, one might expect to see changes as a result of the chemical evolution expected in the host galaxies of quasars over cosmological time scales. In general, however, order-of-magnitude differences in abundances lead to much smaller variations in BLR line strengths in photoionization models, due to thermostatic feedback effects. An important exception may be present in the N v 1240 emission from QSOs, which may be sensitive to secondary nitrogen enrichment (§3.1), and does not display a BE. The N v feature remains relatively strong at , pointing to rapid early enrichment in the quasar nucleus environs (see Hamann & Ferland 1992, 1993 for details). As discussed by Shields & Hamann (1997), these sources also show evidence of elevated O i 1304 emission. This feature forms primarily via fluorescence pumped by H Ly line coincidence, and is consequently expected to scale with the O/H ratio, although factors other than metallicity may also affect its strength.

Quasars detected at are almost invariably high-luminosity objects, and provide useful data points at high for inclusion in the Baldwin diagrams. A summary of results to date is shown in Figure 9 for the C iv line, with data taken from Shields et al. (1998) for a sample of objects that are largely selected on the basis of optical colors (filled points), and from Schneider et al. (1991) for grism-selected objects (). The dotted line represents the fit obtained to the BE by OPG for quasars at lower . Schneider et al. noted a tendency for many of their sources to fall below the extrapolated BE in this diagram; with the addition of the Shields et al. points, the results appear consistent with the low-redshift fit, accompanied by the customary degree of scatter.

Selection effects remain a point of concern in comparing the findings with low-redshift results. The color-selected objects in particular are sensitive to inclusion of high- objects that are preferentially found in magnitude-limited surveys, due to the added flux contributed by the emission line (typically Ly observed in the bandpass888Note that the influence of the Ly line in this regard is exacerbated at large redshift by the scaling of observed , and the diminished continuum blueward of the line caused by the Ly forest.; see Kennefick et al. 1995 for quantitative details). This bias may contribute to a weak tendency for the color-selected sources to exhibit larger equivalent widths than are found for the grism-selected objects in Figure 9999Interestingly, this pattern runs counter to the historical problems of selection bias, which favored large- sources in grism-selected samples, in contrast with color selection techniques (§2.2). Objective selection algorithms for analysis of grism observations have largely removed this bias (e.g., Schmidt et al. 1995), while selection effects in high-redshift color-selected samples may be nonnegligible..
The existing results for quasars at the highest known redshifts nonetheless do not appear markedly different from their low-redshift counterparts, in terms of the BE as seen in the strong UV lines. We note, however, that this statement is ultimately sensitive to the choice of cosmology in computing . (Figure 9 assumes km s-1 and .) This ambiguity is inherent in studying the BE and its possible evolution with samples in which is strongly correlated with ; the resolution of these issues awaits construction of samples extending over a wide range of at a given . Researchers can also aid their colleagues by publishing actual measurements of continuum flux and redshift, rather than simply the derived quantity , which depends on the specific choice of cosmology as well as measured .
8 Summary and Future Directions
The Baldwin Effect is real and has important implications for the emission-line regions of quasars. Additional work will be needed if we are to fully extract the meaning of this correlation. The existence of an ionization dependence in the BE provides important clues to the underlying physics. Variations in the BE across line profiles, possible differences between radio-loud and radio-quiet BEs, and constraints resulting from the intrinsic BE will also play a role in sharpening our understanding of this phenomenon. A clearer understanding of the physical basis for the BE would gratify quasar enthusiasts while strengthening the credibility of using this phenomenon for calibrating cosmological diagnostics.
Several avenues of inquiry would be of particular value for making progress in our understanding. Large data sets with well-defined selection criteria and uniform follow-up would aid in refining BE measurements and their relation to radio properties and the ionizing SED. The Sloan Digital Sky Survey and surveys with the new generation of X-ray telescopes (AXAF, XMM) can be expected to deliver appropriate samples, while the burgeoning number of 8-m class telescopes will in principle make it possible to obtain follow-up spectroscopy with the high signal-to-noise ratio necessary for reliable and reproducible line measurements. X-ray studies will also be important for probing the X-ray BE with well-defined samples, while exploring the connection between K behavior and the UV lines.
Beyond simply searching for the BE, it is now time to vigorously pursue the origins of dispersion in the correlation. The substantial scatter has raised large questions about the suitability of the BE as a cosmological tool. Multiparameter and principal-components investigations offer powerful tools for extracting the full details of correlated phenomenology, which in turn can serve as inspiration and testbeds for the construction of detailed physical interpretations. The future promise of the Baldwin Effect as an entree to understanding quasars and cosmology appears bright.
Acknowledgements.
We thank our hosts for organizing the meeting. Their hospitality was in the best Chilean tradition. Our colleagues provided valuable commentary and lively discussion, which helped us all improve our understanding of this important but complex topic in quasar research. We wish to also thank Brad Peterson and Mike Brotherton for providing helpful comments on a draft of this manuscript. Figures 1, 2, and 4 are reproduced with the generous permission of the original authors, Jack Baldwin, Paul Francis, & Anne Kinney, respectively. Support for our research is provided by the NSF to PSO through grant AST-9529324, and by NASA to JCS through grants NAG-3563 and NAG-3690.References
- [1]
- [2] aldwin, J. A. 1977a, ApJ, 214, 679
- [3] aldwin, J. A. 1977b, MNRAS, 178, 67P
- [4] aldwin, J. A. 1987, in Emission Lines in Active Galactic Nuclei, ed. P. M. Gondhalekar (Chilton: Rutherford Appleton Lab), 54
- [5] aldwin, J. A. 1997, in Emission Lines in Active Galaxies: New Methods and Techniques, eds. B. M. Peterson, F.-Z. Cheng, & A. S. Wilson (San Francisco: ASP), 80
- [6] aldwin, J. A., Burke, W. L., Gaskell, C. M., & Wampler, E. J. 1978, Nature, 273, 431
- [7] aldwin, J., Ferland, G., Korista, K., & Verner, D. 1995, ApJ, 455, L119
- [8] aldwin, J. A., Wampler, E. J., & Gaskell, C. M. 1989, ApJ, 338, 630 (BWG)
- [9] arthel, P. D. 1989, ApJ, 336, 606
- [10] inette, L., Fosbury, R. A., & Parker, D. 1993, PASP, 105, 1150
- [11] oroson, T. A., & Green, R. F. 1992, ApJS, 80, 109
- [12] rotherton, M. S., 1996, ApJS, 102, 1
- [13] rotherton, M. S., Wills, B. J., Francis, P. J., & Steidel, C. C. 1994a, ApJ, 430, 495
- [14] rotherton, M. S., Wills, B. J., Steidel, C. C., & Sargent, W. L. W. 1994b, ApJ, 423, 131
- [15] rowne, I. W. A., & Murphy, D. W. 1987, MNRAS, 226, 601
- [16] lavel, J., et al. 1992, ApJ, 393, 113
- [17] lavel, J., Wamsteker, W., & Glass, I. S. 1989, ApJ, 337, 236
- [18] orbin, M. R., & Boroson, T. A. 1996, ApJS, 107, 69
- [19] orbin, M. R., & Francis, P. J. 1994, AJ, 108, 2016
- [20] ristiani, S., & Vio, R. 1990, A&A, 227, 385
- [21] avidson, K. 1977, ApJ, 218, 20
- [22] one, C., & Krolik, J. H. 1996, ApJ, 463, 144
- [23] delson, R. A., Krolik, J. H., & Pike, G. F. 1990, ApJ, 359, 86
- [24] delson, R. A., et al. 1996, ApJ, 470, 364
- [25] erland, G. J., & Persson, S. E. 1989, ApJ, 347, 656
- [26] rancis, P. J. 1993, ApJ, 405, 119
- [27] rancis, P. J., Hewett, P. C., Foltz, C. B., & Chaffee, F. H. 1992, ApJ, 398, 476 (FHFC)
- [28] rancis, P. J., Hooper, E. J., & Impey, C. D. 1993, AJ, 106, 417
- [29] rancis, P. J., & Koratkar, A. 1995, MNRAS, 274, 504
- [30] eorge, I. M., et al. 1998, ApJS, 114, 73
- [31] hisellini, G., Haardt, F., & Matt, G. 1994, MNRAS, 267, 743
- [32] ondhalekar, P. M. 1992, MNRAS, 255, 663
- [33] reen, P. J. 1996, ApJ, 467, 61
- [34] reen, P. J. 1998, ApJ, 498, 170
- [35] uainazzi, M., Matsuoka, M., Piro, L., Mihara, T., & Yamauchi, M. 1994, ApJ, 436, L35
- [36] uilbert, P. W., & Rees, M. J. 1988, MNRAS, 233, 475
- [37] amann, F., Cohen, R. D., Shields, J. C., Burbidge, E. M., Junkkarinen, V., & Crenshaw, D. M. 1998, ApJ, 496, 761
- [38] amann, F., & Ferland, G. 1992, ApJ, 391, L53
- [39] amann, F., & Ferland, G. 1993, ApJ, 418, 11
- [40] wasawa, K., et al. 1996, MNRAS, 282, 1038
- [41] wasawa, K., & Taniguchi, Y. 1993, ApJ, 413, L15
- [42] ones, B. T., & Jones, J. E. 1980, MNRAS, 193, 537
- [43] ennefick, J. D., Djorgovski, S. G., & de Carvalho, R. R. 1995, AJ, 110, 2553
- [44] inney, A. L., Huggins, P. J., Glassgold, A. E., & Bregman, J. N. 1987, ApJ, 314, 145
- [45] inney, A. L., Rivolo, A. R., & Koratkar, A. P. 1990, ApJ, 357, 338 (KRK)
- [46] orista, K., Baldwin, J., & Ferland, G. 1998, ApJ, 507, 24
- [47] orista, K., Baldwin, J., Ferland, G., & Verner, D. 1997a, ApJS, 108, 401
- [48] orista, K., Ferland, G., & Baldwin, J. 1997b, ApJ, 487, 555
- [49] rolik, J. H., Madau, P., & Życki, P. T. 1994, ApJ, 420, L57
- [50] a Franca, F., Franceschini, A., & Cristiani, S. 1995, A&A, 299, 19
- [51] aor, A., Bahcall, J. N., Jannuzi, B. T., Schneider, D. P., & Green, R. F., & Hartig, G. F. 1994, ApJ, 420, 110
- [52] aor, A., Bahcall, J. N., Jannuzi, B. T., Schneider, D. P., & Green, R. F. 1995, ApJS, 99, 1
- [53] aor, A., & Draine, B. T. 1993, ApJ, 402, 441
- [54] awrence, A. 1991, MNRAS, 252, 586
- [55] ightman, A. P., & White, T. R. 1988, ApJ, 335, 57
- [56] orris, P., Conti, P. S., Lamers, H. J. G. L. M., & Koenigsberger, G. 1993, ApJ, 414, L25
- [57] urdoch, H. S. 1983, MNRAS, 202, 987
- [58] urray, N., & Chiang, J. 1998, ApJ, 494, 125
- [59] ushotzky, R., & Ferland, G. J. 1984, ApJ, 278, 558
- [60] andra, K., et al. 1995, MNRAS, 276, 1
- [61] andra, K., et al. 1998, ApJ, 505, 594
- [62] andra, K., George, I. M., Mushotzky, R. F., Turner, T. J., & Yaqoob, T. 1997a, ApJ, 488, L91
- [63] andra, K., George, I. M., Mushotzky, R. F., Turner, T. J., & Yaqoob, T. 1997b, ApJ, 477, 602
- [64] andra, K., Mushotzky, R. F., Yaqoob, T., George, I. M., & Turner, T. J. 1997c, MNRAS, 284, L7
- [65] andra, K., & Pounds, K. A. 1994, MNRAS, 268, 405
- [66] etzer, H. 1976, MNRAS, 177, 473
- [67] etzer, H., Laor, A., & Gondhalekar, P. M. 1992, MNRAS, 254, 15
- [68] smer, P. S. 1980, ApJS, 42, 523
- [69] smer, P. S., Porter, A. C., & Green, R. F. 1994, ApJ, 436, 678 (OPG)
- [70] tani, C., et al. 1996, PASJ, 48, 211
- [71] eterson, B. M. 1997, An Introduction to Active Galactic Nuclei (Cambridge: Cambridge University Press), Chapter 10.
- [72] ogge, R. W., & Peterson, B. M. 1992, AJ, 103, 1084
- [73] eeves, J. N., Turner, M. J. L., Ohashi, T., & Kii, T. 1997, MNRAS, 292, 468
- [74] eynolds, C. S. 1997, MNRAS, 286, 513
- [75] argent, W. L. W., Steidel, C. C., & Boksenberg, A. 1989, ApJS, 69, 703
- [76] chmidt, M., Schneider, D. P., & Gunn, J. E. 1995, AJ, 110, 68
- [77] chneider, D. P., Schmidt, M., & Gunn, J. E. 1991, AJ, 101, 2004
- [78] chulz, H. 1992, in Physics of Active Galactic Nuclei, ed. W. J. Duschl & S. J. Wagner (Berlin: Springer), 235
- [79] hields, J. C., & Ferland, G. J. 1993, ApJ, 402, 425
- [80] hields, J. C., Ferland, G. J., & Peterson, B. M. 1995, ApJ, 441, 507
- [81] hields, J. C., & Hamann, F. 1997, RevMexAA (Serie de Conf.), 6, 221
- [82] hields, J. C., Hamann, F., Foltz, C. B., & Chaffee, F. H. 1998, in preparation.
- [83] huder, J. M., & MacAlpine, G. M. 1979, ApJ, 230, 348
- [84] impson, C. 1998, MNRAS, 297, L39
- [85] parke, L. S. 1993, ApJ, 404, 570
- [86] teidel, C. C., & Sargent, W. L. W. 1991, ApJ, 382, 433
- [87] torrie-Lombardi, L. J., McMahon, R. G., Irwin, M. J., & Hazard, C. 1996, ApJ, 468, 121
- [88] ürler, M., & Courvoisier, T. J.-L. 1998, A&A, 329, 863
- [89] éron-Cetty, M.-P., Véron, P., & Tarenghi, M. 1983, A&A, 119, 69
- [90] ampler, E. J., Gaskell, C. M., Burke, W. L., & Baldwin, J. A. 1984, ApJ, 276, 403
- [91] ampler, E. J., & Ponz, D. 1985, ApJ, 298, 448
- [92] amsteker, W., & Colina, L. 1986, ApJ, 311, 617
- [93] ang, T.-G., Lu, Y.-J., & Zhou, Y.-Y. 1998, ApJ, 493, 1
- [94] ills, B. J., Brotherton, M. S., Fang, D., Steidel, C. C., & Sargent, W. L. W. 1993a, ApJ, 415, 563
- [95] ills, B. J., et al. 1993b, ApJ, 410, 534
- [96] u, C.-C., Boggess, A., & Gull, T. R. 1983, ApJ, 266, 28
- [97] aqoob, T., Serlemitsos, P. J., Turner, T. J., George, I. M., & Nandra, K. 1996, ApJ, 470, L27
- [98] ee, H. K. C. 1980, ApJ, 421, 894
- [99] uan, W., Siebert, J., & Brinkmann, W. 1998, A&A, 334, 498
- [100] amorani, G., et al. 1981, ApJ, 245, 357
- [101] amorani, G., Marano, B., Mignoli, M., Zitelli, V., & Boyle, B. J. 1992, MNRAS, 256, 238
- [102] heng, W., Fang, L.-Z., & Binette, L. 1992, ApJ, 392, 74
- [103] heng, W., Kriss, G. A., & Davidsen, A. F. 1995, ApJ, 440, 606 (ZKD)
- [104] heng, W., Kriss, G. A., Telfer, R. C., Grimes, J. P., & Davidsen, A. F. 1997, ApJ, 275, 469
- [105] heng, W., & Malkan, M. A. 1993, ApJ, 415, 517
- [106]