The Power Spectrum of Matter
Abstract
ABSTRACT. We calculate the mean power spectrum of galaxies using published power spectra of galaxies and clusters of galaxies. The mean power spectrum of cluster samples as well as APM 3-D, IRAS QDOT, and SSRS+CfA2 galaxy samples has a relatively sharp maximum at wavenumber Mpc-1, followed by an almost exact power-law spectrum of index toward smaller scales. The power spectrum found from APM 2-D galaxy distribution and from LCRS and IRAS 1.2 Jy surveys is flatter around the maximum. We show that power spectra of galaxies and matter are similar in shape for a wide class of assumptions, the bias parameter of galaxies relative to matter is fixed by the fraction of clustered matter associated with galaxies; and find . We compare the empiric power spectrum of matter with analytical power spectra and show that the primordial power spectrum has a break in amplitude and a spike if presently available galaxy and cluster samples represent the true mass distribution of the Universe.
ABSTRACT. We calculate the mean power spectrum of galaxies using published power spectra of galaxies and clusters of galaxies. The mean power spectrum of cluster samples as well as APM 3-D, IRAS QDOT, and SSRS+CfA2 galaxy samples has a relatively sharp maximum at wavenumber Mpc-1, followed by an almost exact power-law spectrum of index toward smaller scales. The power spectrum found from APM 2-D galaxy distribution and from LCRS and IRAS 1.2 Jy surveys is flatter around the maximum. We show that power spectra of galaxies and matter are similar in shape for a wide class of assumptions, the bias parameter of galaxies relative to matter is fixed by the fraction of clustered matter associated with galaxies; and find . We compare the empiric power spectrum of matter with analytical power spectra and show that the primordial power spectrum has a break in amplitude and a spike if presently available galaxy and cluster samples represent the true mass distribution of the Universe.
1 The power spectrum of galaxies and clusters
There exist a large body of observational determinations of the power spectrum of galaxies and clusters of galaxies. In this talk I shall review the determination of the mean galaxy power spectrum (Einasto et al1998a, hereafter E98a). The mean galaxy power spectrum shall be reduced to that of matter (Einasto et al1998b, E98b). This semi-empirical matter power spectrum shall be used to determine the primordial power spectrum (Einasto et al1998c, E98c).

Recent determinations of power spectra for large galaxy and cluster samples are plotted in Figure 1. The compilation in based on summary by E98a. Spectra are shifted in amplitude to match the amplitude of the power spectrum of APM galaxies on wavenumber Mpc-1. The APM galaxy spectrum is a reconstruction of the 3-dimensional spectrum based on deep 2-dimensional distribution of over 2 millions of galaxies, thus the cosmic error is smaller here than in available 3-D surveys. The APM galaxy spectrum is also free of redshift distortions. We see that after vertical scaling there is little scatter between individual determinations of power spectra on medium and small scales. On large scales around the maximum the scatter is much larger. We have formed two mean power spectra. One spectrum is based on samples having power spectra with a high amplitude near the maximum. Such samples are Abell-ACO and APM cluster surveys, the redshift survey of APM galaxies, and the SSRS-CfA2-130 galaxy survey. These samples cover large regions in space where both high- and medium-density regions are well represented, thus we use the notation for this mean power spectrum (HD for high-density). This mean power spectrum has a relatively sharp maximum at Mpc-1, followed by an almost exact power-law spectrum of index toward smaller scales. The other mean spectrum is based on samples which have a power spectrum with a shallower turnover; such samples are the LCRS survey, IRAS QDOT galaxies, and the APM 2-D sample of galaxies. In LCRS and IRAS QDOT surveys medium-density regions are well present but not regions of highest density (very rich superclusters). We use the notation for this mean power spectrum (MD for medium-density). On medium and small scales it coincides with the previous spectrum, but it has a maximum of lower amplitude. Presently it is not clear, whether the difference between these two spectra is real or partly due to some artifacts of data handling. Several arguments suggest that there exist real differences between power spectra of various samples. All samples which have a high amplitude of the power spectrum near the maximum are deep fully 3-D samples. In contrast, samples with a shallower power spectrum are not so deep, or do not contain very rich superclusters as the LCRS sample. In IRAS QDOT sample galaxies in rich superclusters were removed (Tadros & Efstathiou 1995). On the other hand, some artifacts of data reduction or influence of the sample selection and/or geometry are not excluded. For instance, the Las Campanas survey is not a fully 3-dimensional sample, it is made in narrow strips which may smooth out sharp features of the power spectrum near the maximum. A curious fact is the reconstruction of the 3-D spectrum from APM 2-D galaxy distribution which has near the maximum a lower amplitude as expected from real 3-D observations of galaxies of the same sample. This difference is not explained yet, it may be due to some problems with the reconstruction of the 3-D power spectrum from 2-D data. The difference between two mean power spectra can be considered as the combined result of the cosmic scatter and our ignorance of all details of the data reduction.
2 The reduction of galaxy power spectrum to matter
To compare the observed power spectrum with theoretical spectra the galaxy spectrum must be reduced to matter. Differences between the distribution of galaxies and matter are due to the gravitational character of the evolution of the Universe. As shown already by Zeldovich (1970), the evolution of under- and over-dense regions is different. Matter flows away from low-density regions toward high-density ones until it collapses. In order to form a galaxy or a system of galaxies, the mean density of matter in a sphere of radius must exceed the mean density by a factor of 1.68 (Press & Schechter 1974), the radius determines the mass of the contracting object. Thus in low-density regions (voids) galaxies are absent, but the gravity is unable to evacuate voids completely – there exists primordial matter in voids. Visible matter is concentrated together with dark matter in a web of galaxy filaments and superclusters (Zeldovich, Einasto & Shandarin 1982, Bond, Kofman & Pogosyan 1996).

These considerations show that model particles can be divided into two populations, the unclustered population in voids, and the clustered population in high-density regions. The last population is associated with galaxies including DM halos of galaxies and clusters of galaxies. To get the clustered population one has to exclude the population of low-density particles using a certain threshold density, , which divides the matter into the matter in voids and the clustered matter. Hydrodynamical simulations by Cen & Ostriker (1992, 1998) show that the overall mean density is a good approximation to the threshold density. In determining the density field we use smoothing on scales comparable to the size of actual systems of galaxies ( Mpc). Analytical calculations and numerical simulations show that the exclusion of matter from low-density regions rises the amplitude of the power spectrum but not its shape (E98b). Power spectra of galaxies and matter are related as follows:
where the bias factor is expressed by the fraction of matter in the clustered population associated with galaxies,
Actually the biasing parameter is a slow function of the wavenumber , but in the range of scales of interest for the present study it is practically constant. The biasing parameter is shown in Figure 2 for a 2-D model, it is found by comparing power spectra of all particles (matter) and clustered particles associated with galaxies using different threshold density (E98b).
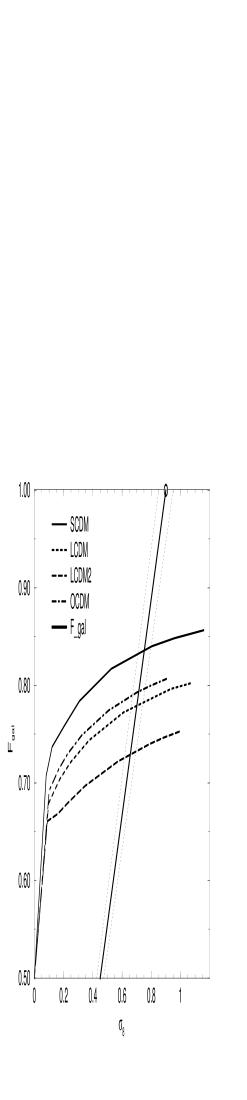


The fraction of matter in the clustered population can be determined from numerical simulations of the void evacuation. This has been done for several models: the standard CDM model (SCDM, Hubble constant ), model with cosmological constant (LCDM, , ), and open model (OCDM, , ). In Figure 3 we show the increase of the fraction of matter associated with galaxies for these models (for LCDM 2 models with different realization are given). The epoch of simulation is measured in terms of , rms density fluctuations in a sphere of radius Mpc. From model data alone it is impossible to determine which corresponds to the present epoch. The value of this parameter is known from observations for galaxies. It is found by the integration of the observed mean power spectrum of galaxies; we get . This value is equal to for matter, if all matter were associated with galaxies (). In reality they are different and related via an equation similar to (1) since is proportional to the amplitude of the power spectrum:
This relationship is plotted in Figure 3 by a straight line. The intersection of this line with curves vs. for models yields values of both parameters which correspond to the present epoch. We get for matter; , and the biasing parameter of galaxies in respect to matter (E98b).
3 The primordial power spectrum
The final step in our study is the comparison of the power spectrum of mass with theoretical power spectra for models of structure formation. We use models with cold dark matter (CDM) and a mixture of cold and hot dark matter (MDM) in spatially flat models. We derive the transfer functions for a set of cosmological parameters. Models are normalized on large scale by four-year COBE normalization (Bunn & White 1997); the density of matter in baryons is taken (in units of the critical density); and the Hubble parameter . The cosmological constant was varied between and . In mixed dark matter models the density of hot DM was fixed, , cold DM density was chosen to get a spatially flat model. Analytical power spectra for MDM models are plotted in the left panel of Figure 4 together with the semi-empirical matter power spectra, and . MDM models fit the semi-empirical matter power spectrum better than other models. In the right panel we show the initial power spectrum,
compared with the scale-free primordial power spectrum, ; here is the transfer function. The initial power spectrum is plotted only for spectrum which corresponds to high-density regions. The main feature of primordial power spectra is the presence of a spike at the same wavenumber as that of the maximum of the observed power spectrum. Primordial spectra also have a break, i.e. their amplitudes on small scales are different from the amplitudes on large scales. The shape of the primordial spectrum varies with the cosmological constant. The primordial power spectrum which is found from the shallower spectrum has no sharp peak but the break is similar to that for the spectrum . The main conclusion from the present analysis is that it is impossible to avoid a break and/or spike in the primordial power spectrum, if presently available cluster and galaxy data represent a fair sample of the Universe. Clusters of galaxies cover a much larger volume in space than galaxies, thus cluster samples are presently best candidates for the fair sample. However, this conclusion is tentative. New very deep surveys of galaxies now in progress will specify the power spectrum on large scales more exactly and yield a better estimate of the primordial power spectrum. Presently we can say that the possibility of a broken scale and peaked initial power spectrum has to be taken seriously.
Acknowledgments
I thank H. Andernach, F. Atrio-Barandela, R. Cen, M. Einasto, M. Gramann, A. Knebe, V. Müller, I. Suhhonenko, A. Starobinsky, E. Tago and D. Tucker for fruitful collaboration and permission to use our joint results in this talk. This study was supported by the Estonian Science Foundation.
References
- [1] Bond, J.R., Kofman, L. & Pogosyan, D. 1996, Nature, 380, 603
- [2] Bunn, E.F., & White, M. 1997, ApJ, 480, 6
- [3] Cen, R., & Ostriker, J.P. 1992, ApJ, 399, L113
- [4] Cen, R., & Ostriker, J.P. 1998 (in press)
- [5] da Costa, L.N., Vogeley, M.S., Geller, M.J., Huchra, J.P., and Park, C. 1994, ApJ 437, L1
- [6] Einasto, J., Einasto, M., Gottlöber, S., Müller, V., Saar, V., Starobinsky, A.A., Tago, E., Tucker, D., Andernach, H., & Frisch, P., 1997a, Nature 385, 139
- [7] Einasto, J., Einasto, M., Tago, E., Starobinsky, A.A., Atrio-Barandela, F., Müller, V., Knebe, A., Frisch, P., Cen, R., Andernach, H., & Tucker, D., 1998a, ApJ (submitted) (E98a)
- [8] Einasto, J., Einasto, M., Gramann, M., Suhhonenko, I., Tago, E., Müller, V., Knebe, A., Cen, R., Starobinsky, A.A., & Atrio-Barandela, F. 1998b, ApJ (submitted) (E98b)
- [9] Einasto, J., Einasto, M., Tago, E., Starobinsky, A.A., Atrio-Barandela, F., Müller, V., Knebe, A. & Cen, R. 1998c, ApJ (submitted) (E98c)
- [10] Gaztañaga, E. & Baugh, C.M. 1998, MNRAS, 294, 229
- [11] Landy, S.D., Shectman, S.A., Lin, H., Kirshner, R.P., Oemler, A.A., & Tucker, D., 1996, ApJ 456, L1
- [12] Peacock, J.A. 1997, MNRAS, 284, 885
- [13] Press, W.H. & Schechter, P.L., 1974, ApJ 187, 425
- [14] Retzlaff, J., Borgani, S., Gottlöber, S., Klypin, A., & Müller, V., 1998, NewA (submitted), [astro-ph/9709044]
- [15] Tadros, H., Efstathiou, G. & Dalton, G. 1998, MNRAS 296, 995 [astro-ph/9708259]
- [16] Tucker, D. L., Oemler, A., Jr., Kirshner, R. P., Lin, H., Shectman, S.A., Landy, S.D., Schechter, P.L., Müller, V., Gottlöber, S. & Einasto, J. 1997, MNRAS 285, 5
- [17] Zeldovich, Ya. B., 1970, A&A 5, 84
- [18] Zeldovich, Ya.B., Einasto, J. & Shandarin, S.F. 1982, Nature, 300, 407