Detailed optical studies of the galactic supersoft X-ray source QR And (RX J0019.8 +2156) ††thanks: Based on observations at the German-Spanish Astronomical Center, Calar Alto, Spain and at the Wendelstein Observatory, Germany
Abstract
We present high-speed long term photometric observations from 1992 to 1996 (UBVRI), as well as recently obtained (1997) spectrophotometric and high resolution spectroscopic studies of the bright galactic supersoft X-ray source RX J0019.8 +2156. Our photometry reveals a highly variable object. The shortest observed quasi-periodic variations are humps with a period of 1.8 h. The timings of the main minimum are not exactly regular and occur on average around phase 0.0. With our new data set we calculated an update of the orbital period.
Our simultaneous spectroscopic and spectrophotometric studies from 1997 give an even more detailed insight: blue and red shifted satellite lines at He ii 4686 and at the strong Balmer lines, which are interpreted as high velocity outflows, can clearly be detected. We also present for the first time an analysis of this supersoft source by means of Doppler tomography. The lines of He ii ( 4542, 4686), Hα and Hβ show no emission from an accretion disk. These emission lines originate in regions within the binary system with very low velocities. The spatial origin of the emitting material is not quite clear and will be investigated in a follow-up paper.
Key Words.:
stars individual: QR And, – accretion disks – binaries: close – binaries: eclipsing – X-rays: stars1 Introduction
Supersoft X-Ray sources (hereafter called SSS) were discovered by Einstein, established by Rosat (Trümper et al. 1991) and are now commonly accepted to be close binary systems with a white dwarf primary. Little is known about the nature of the companion star. The accretion rate in these systems is relatively high (in the order of y-1) so that the accreted hydrogen burns steadily on the surface of the white dwarf (van den Heuvel et al. 1992). Several SSS are now known, most of them in the LMC and in M31. A detailed list can be found in Greiner (1996). Only two SSS are known in our Galaxy; one of them is RX J0019.8+2156 (hereafter called RXJ0019), which was discovered by Beuermann et al. (1995).
SSS are characterized by their high X-ray luminosity from 1036 erg s-1 to 1038 erg s-1 and by extremely soft X-ray spectra with blackbody temperatures between 20 – 60 eV. Most of the optical luminosity probably originates in the bright accretion disk: in a radially extended and vertically elevated accretion disk rim a substantial fraction of the soft X-ray flux from the white dwarf is reprocessed to optical and UV-light. This model successfully accounts for features observed in the optical lightcurves of some SSS such as CAL 87, RXJ0019 and RX J0513.9-6951 (Meyer-Hofmeister et al. 1997). Most of the optical lightcurves presented in this paper have also been used by Meyer-Hofmeister et al. (1998) for their analysis . They argue that the short time variability is caused by changes in the height of the accretion disk rim. An elevated rim is therefore the premise for explaining the luminosity in optical bands. This picture of a bright accretion disk is also invoked by other authors (Popham & Di Stefano 1996, Matsumoto & Fukue 1998).
RXJ0019 is a unique object. It is the brightest and nearest among the known SSS. With its position well outside the galactic plane and its visual brightness of 12.5m RXJ0019 offers an outstanding opportunity to investigate a SSS very closely with indirect imaging techniques such as Doppler tomography. Here we report on such an approach to investigate RXJ0019.
In Sect. 2 we refer to our observations of RXJ0019 and the data reduction procedures used. Section 3 deals with the results and analysis of our data. Finally, in Sect. 4 a summary and discussion of this paper are given.
2 Observations and data
RXJ0019 has been monitored regularly at the Wendelstein Observatory from 1992 to 1995 (Will & Barwig 1996). Follow-up observations were made in autumn 1996. We were able to observe this object on 15 nights between October and December 1996.
A special approach to investigate RXJ0019 was made in October 1997. We performed simultaneous spectroscopy and spectrophotometry at the 3.5 m and 2.2 m telescope at Calar Alto, respectively. Detailed information about the individual observing campaigns is given in Tables 1 to 3.
2.1 Photometry
High-speed photometric observations of RXJ0019 were performed using the multichannel multicolor photometer MCCP (Barwig et al. 1987) at the 80 cm telescope at the Wendelstein Observatory in the Bavarian Alps. With this photometer we can monitor the object, a nearby comparison star and the sky background simultaneously in UBVRI. The MCCP allows a nearly complete elimination of atmospheric transparency variations and extinction effects (Barwig et al. 1987), by subtracting the sky background of each color channel and dividing the object by the comparison star measurement afterwards. Therefore, photometric measurements were possible even under non-photometric conditions. During the 1996 run we were able to add another 88.7 hours of observation time for RXJ0019 to our existing dataset.
As comparison star we used the star at , (for epoch 2000.0). The intensities of the light-curves presented in Fig. 3 are calculated relative to this star. The error in the relative count rate is . In order to normalize the individual channels, calibration measurements were performed during photometric conditions once or twice a night. The constancy of the calibration coefficients is indicative of the high stability of our detectors. All observations were made with an integration time of 2 sec. except on the night of Dec 10,1996 where we used an integration time of 1 sec. A detailed journal of the observations is given in Table 1.
| Date | Start [HJD] | Stop [HJD] | Duration [h] | IT [s] |
|---|---|---|---|---|
| 21/09/1992 | 08887.296 | 08887.668 | 8.93 | 2 |
| 22/10/1995 | 10013.225 | 10013.648 | 10.16 | 2 |
| 23/10/1995 | 10014.249 | 10014.637 | 9.31 | 2 |
| 11/10/1996 | 10368.350 | 10368.664 | 7.537 | 2 |
| 12/10/1996 | 10369.261 | 10369.655 | 9.442 | 2 |
| 13/10/1996 | 10370.442 | 10370.654 | 5.111 | 2 |
| 18/10/1996 | 10375.321 | 10375.552 | 5.530 | 2 |
| 22/10/1996 | 10379.482 | 10379.637 | 3.704 | 2 |
| 23/10/1996 | 10380.237 | 10380.476 | 5.746 | 2 |
| 02/11/1996 | 10390.401 | 10390.557 | 3.630 | 2 |
| 03/11/1996 | 10391.224 | 10391.614 | 9.361 | 2 |
| 04/11/1996 | 10392.240 | 10392.599 | 8.597 | 2 |
| 09/11/1996 | 10397.218 | 10397.507 | 6.943 | 2 |
| 10/12/1996 | 10428.394 | 10428.499 | 2.515 | 1 |
| 11/12/1996 | 10429.248 | 10429.417 | 4.406 | 2 |
| 12/12/1996 | 10430.250 | 10430.445 | 4.697 | 2 |
| 15/12/1996 | 10433.210 | 10433.480 | 6.478 | 2 |
| 16/12/1996 | 10434.276 | 10434.486 | 5.051 | 2 |
| Date | Start [HJD] | Stop [HJD] | Duration [h] | IT [s] |
|---|---|---|---|---|
| 27/10/1997 | 749.418 | 749.628 | 4.23 | 2 |
| 30/10/1997 | 752.295 | 752.623 | 7.74 | 2 |
| Date | Spectra | Phase range | Start [UT] | IT [s] |
|---|---|---|---|---|
| R | 0.12–0.15 | 1800 | ||
| B R | 0.16–0.19 | 1800 | ||
| B R | 0.20–0.23 | 1800 | ||
| 27-28/10/1997 | B R | 0.24–0.27 | 1800 | |
| B R | 0.28-0.31 | 1800 | ||
| B R | 0.33–0.37 | 1800 | ||
| B | 0.37–0.40 | 1800 | ||
| 28-29/10/1997 | B R | 0.69–0.72 | 1800 | |
| B R | 0.44–0.47 | 1800 | ||
| B R | 0.48–0.51 | 1800 | ||
| B R | 0.51–0.54 | 1800 | ||
| B R | 0.55–0.58 | 1800 | ||
| B R | 0.59–0.61 | 690 | ||
| B R | 0.69–0.72 | 1800 | ||
| 30-31/10/1997 | B R | 0.73–0.76 | 1800 | |
| B R | 0.76–0.79 | 1800 | ||
| B R | 0.80–0.83 | 1800 | ||
| B R | 0.83–0.86 | 1800 | ||
| B R | 0.87–0.90 | 1800 | ||
| B R | 0.91–0.94 | 1800 | ||
| B R | 0.95–0.98 | 1800 |
2.2 Spectrophotometry
We observed RXJ0019 on October 27 and 30, 1997 with MEKASPEK attached to the 2.2 m telescope at the Calar Alto Observatory. MEKASPEK is a four channel fiber-optic spectrophotometer, developed at the Universitäts-Sternwarte München. With MEKASPEK we can also perform simultaneous measurements of the object, a nearby comparison star and the sky background within the spectral range of 3700…9000Å at a spectral resolution of . The photon-counting two-dimensional detector (MEPSICRON) has a time resolution of up to 5 ms.
Furthermore, MEKASPEK performs a correct treatment of atmospheric effects and allows an accurate transformation to any broadband photometric system. For more details see Mantel et al. (1993) and Mantel & Barwig (1993). Again, atmospheric effects are eliminated using the standard reduction method (Barwig et al. 1987).
We used an integration time of 2 sec. Each night two calibration measurements were performed to get the calibration coefficients for the normalization of the color channels. We also made flat-field measurements and a measurement of a HgArRb-lamp spectrum for wavelength calibration at the end of each night. Due to unfortunate weather conditions only two of four program nights could be used. Therefore, we could not cover a complete orbital phase of RXJ0019. The details of the MEKASPEK observations are listed in Table 2.
2.3 Spectroscopy
Simultaneously with the spectrophotometric measurements we obtained high-resolution spectroscopic data with the Cassegrain double beam spectrograph (TWIN) attached to the 3.5 m telescope at Calar Alto. The blue and red channel were equipped with the low-noise CCDs (SITe#6a and SITe#4d) with a pixel size of 15m and a CCD size of 8002000 pixel. We used a slit width of . For the blue channel we chose grating T07 with a spectral resolution of 0.81Å/pixel and a spectral range of 3300…5000Å (observations performed in second order) and for the red channel grating T04 with a spectral resolution of 1.08Å/pixel in a spectral range between 5500…9000Å. The object was trailed along the slit in order to get phase-resolved, high resolution spectra. Exposure times ranged between 690 and 1800s and the mean trail velocity was set to 320/h. The trailed spectra were binned in the direction of the slit by a factor of 2. Helium-Argon wavelength calibration spectra were taken approximately every hour. During the first observing night no calibration spectra in the blue spectral range could be obtained due to technical problems. Flatfield measurements were taken at the end of the last observing night. Further information about the observation is given in Table 3. The data reduction included bias-subtraction, flatfield-correction, sky-subtraction, cosmic-ray elimination and wavelength-calibration as described by Horne (1986).
After that, the continuum of the spectroscopic data set was calibrated with our simultaneously obtained spectrophotometric data. By applying this method we were able to correct for intensity variations of the emission lines which might have been caused by poor weather conditions (e.g. clouds) or observational difficulties (e.g. variable vignetting of the seeing disk by the slit). Further information is given in Šimić et al. (1998). In a last step the trailed spectra were phase-folded into 125 phase bins using the updated eclipse ephemeris as given in Sect. 3.1.
| Band | |||
|---|---|---|---|
| U | 11.37 | 11.79 | 0.42 |
| B | 12.29 | 12.71 | 0.42 |
| V | 12.33 | 12.65 | 0.42 |
3 Analysis and results
3.1 The lightcurves
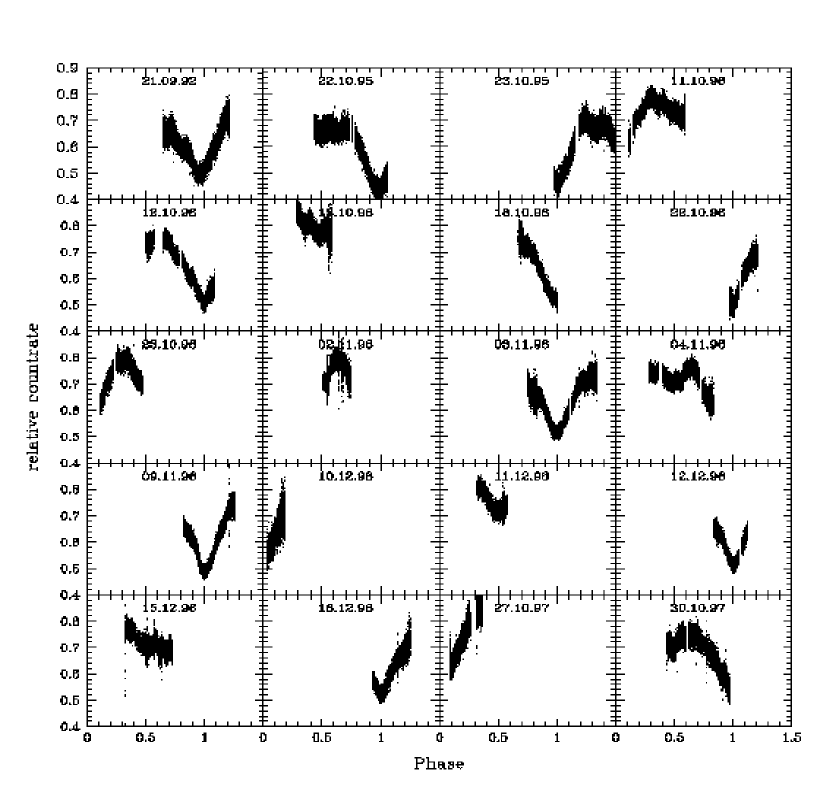
All observed MCCP and MEKASPEK lightcurves are presented in Fig. 3. Only B-band lightcurves are plotted since the very blue continuum of RXJ0019 in combination with the quantum efficiency of the detectors and the color temperature of the comparison provides the best S/N value in B. All observations are plotted individually to emphasize the high variability of this object. A plot including all observed lightcurves superposed according to the orbital period can be found in Meyer-Hofmeister et al. (1998) in their Fig. 1. Also compare with Fig. 2 in Will & Barwig (1996). The following features can be observed:

| date | cycle (E) | minima | mean |
|---|---|---|---|
| HJD-2450000 [d] | error [d] | ||
| 12/10/1996 | 22061 | 369.590 | 0.00099 |
| 22/10/1996 | 22076 | 379.504 | 0.00175 |
| 03/11/1996 | 22094 | 391.385 | 0.00774 |
| 09/11/1996 | 22103 | 397.333 | 0.00065 |
| 12/12/1996 | 22153 | 430.361 | 0.00130 |
| 16/12/1996 | 22159 | 434.323 | 0.00036 |
1.) RXJ0019 shows a deep, broad minimum ( = in UBV on Oct. 12, 1996, Table 4), lasting about 0.55 of a complete orbital phase. As can be seen in Fig. 1 the depth and shape of the minima varies and the timings of the minima are not regular. This explains the systematic difference of the orbital period of Will & Barwig (1996), which lies out of the error bars of other periods given in the literature (e.g. Greiner & Wenzel 1995 or Matsumoto 1996): our dataset was too short to eliminate the statistical effects. With the epoch of the photometric minimum given by Greiner & Wenzel (1995) and the very accurate determination of the minima observed at the Wendelstein observatory since 1992 we derive the following orbital period:
HJD = E
The timings of the minima used for this calculation can be found in Table 5 and in Will & Barwig (1996) in their Table 2.
2.) A secondary minimum appears around phase . The amplitude of the secondary minimum is . The following maximum at is slightly fainter than the first maximum. Sometimes the second maximum is even completely smeared out and after a flat portion of the lightcurve the ingress to the main minimum begins (e.g. Oct 22, 1995 and Dec 15, 1996 in Fig. 3).
3.) We observe humps and step-like features during ingress and egress of the main minimum. A period analysis of these features, when apparent in the lightcurves, reveals a period of approximately 1.8 h (e.g. Oct 11,1996 and Oct 13,1996). In contrast to the lightcurves showing steps and humps there are also lightcurves with a rather flat appearance (e.g. Nov 09,1996 or Dec 12,1996). We assume that RXJ0019 changes between two states: an “excited optical state” where humps and steps appear quasi-periodically with a period of 1.8 h and a “quiet optical state”, where the lightcurves show no additional features. RXJ0019 can change from one state into the other from night to night. A probable explanation might be a short-term variation in the mass accretion rate (Meyer-Hofmeister et al. 1998).


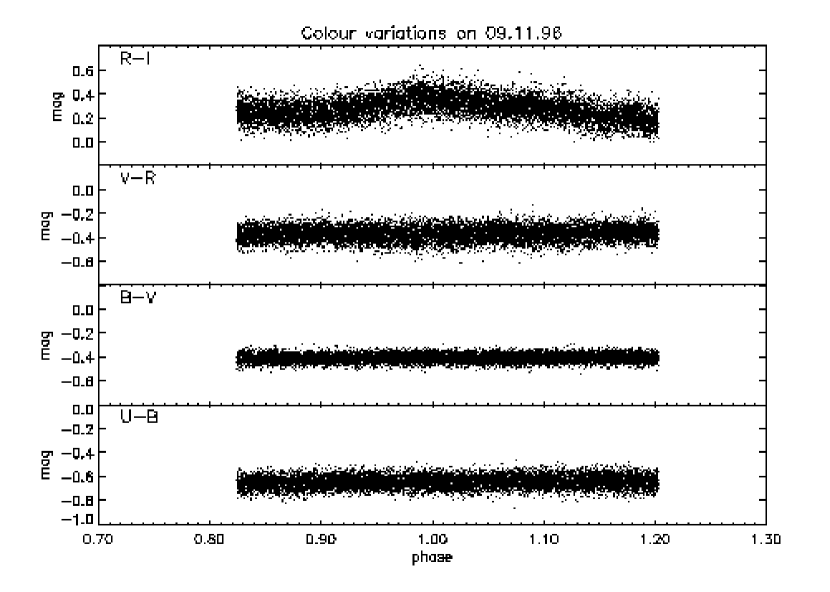
4.) Matsumoto (1996) did not observe any color variations in his lightcurves. We also cannot find any color variations in , and . But in we detect a weak flux increase symmetrically to with an amplitude of m . This variation in can only be observed when the main minimum appears at midnight hours. In the evening and in the morning the natural reddening of the sky prevents an observation of this color variation. Therefore, we observed this color variation only on Oct 12, Nov 3 and Nov 9, 1996 (Fig. 2). In every night the width and the amplitude of this variation are similar. All other portions of the color curves from phase to 0.9 are flat and show no variations.
3.2 The mean orbital spectra
High-resolution spectra of RXJ0019 have recently been obtained by Tomov et al. (1998) and Becker et al. (1998). We also present high resolution mean orbital spectra (in Fig. 4) in the blue (3700…5000Å) and in the red spectral range (6300…8300Å). Similar to other SSS (e.g. Crampton et al. 1996 and Southwell et al. 1996) the very blue spectrum is dominated by He ii and Balmer lines. The Balmer series can be traced up to H12. All transitions of the He ii (n,3),(n,4) and (n,5) series can be observed when not blended by Balmer lines. No He i can be detected indicating a high ionisation state.
Additionally, we see some higher ionization emission features such as O vi 3811. The C iii-N iii 4640 – 4660 emission complex contributes to the blue wing of the He ii 4686.


On the blue wings of the Balmer lines P-Cygni profiles are visible in all observed lines. The H8 to H12 transitions can only be detected by their corresponding P-Cygni absorption between to 0.30 (Fig. 5). We do not observe these absorptions after . At the other Balmer lines the P-Cygni absorption shows an orbital modulation that almost disappears between phase and 0.9 (Fig. 6), indicating that there might be a directed fast wind in this system. The velocity of the wind amounts to 590 kms-1 with the blue absorption wing extending to 900 kms-1. The He ii emission lines are not truncated by P-Cygni profiles.
Two emission features, which are clearly above the S/N ratio at 4500, 4930, could not be identified with any reasonable ion species.
The Balmer lines Hα, Hβ and Hγ have broad bases and show satellite lines symmetrically around the main emission. All bright Balmer lines are blended by He ii emission lines, in particular the two Helium lines 6527, 6560 significantly contribute to Hα and He ii 4859 to Hβ. Therefore, substructures in these lines are blurred by the Helium emission, whereas in Hγ, Hδ and Hϵ similar complex substructures of different components can be detected. For illustration the trailed Hγ spectrum is included in Fig. 10.
In He ii 4686 we only observe a broad base. The adjacent satellite components are not clearly separated from the main emission and are asymmetric (Fig. 4 and 6). Tomov et al. (1998) and Becker at al. (1998) argue that these satellite lines are the spectral signatures of jets originating near the white dwarf. These collimated high velocity outflows have recently also been reported by Quaintrell & Fender (1998) from their infrared spectroscopy.
Transient jets seem to be a common feature among the SSS. Jets have also been detected in RX J0513.9-6951 (e.g. Southwell et al. 1996) and recently in RX J0925.7-4758 (Motch 1998). The observed projected high outflow velocities of these sources, which are seen at very low inclination, indicate an origin of the jet near the white dwarf. Therefore, the jet velocity is close to the escape velocity of the central object (see Livio 1998) and can be used for estimating the inclination of the system.
The projected velocities of the jet lines (measured at maximum of their emission profiles) of RX J0019.8 are rather low. We measure 920 km s-1 for S1 and 805 km s-1 for S2. The asymmetry can be explained by the P-Cygni absorption, which alters the appearance of the jet emission on the blue side significantly. The low velocities may be due to a high system inclination (Tomov et al. 1998) if the jet originates near the white dwarf. A medium to high inclination is also consistent with the deep eclipse lightcurves from our photometry.
We note, that no spectral features of a secondary star are detected in our high resolution spectra.
3.3 Radial velocities


The usual procedure of measuring radial velocities in complex emission lines is fitting Gaussians to their line profiles. Measuring radial velocities of the emission lines of the RXJ0019 spectra is difficult. First, the Balmer emission lines are truncated by the phase dependent P-Cygni profiles and blended by He ii emission lines which will alter the system velocity and semi amplitude considerably. Second, the asymmetric profile of the satellite lines will cause systematic errors in the velocity determinations. Furthermore, the measured velocities are only of the order of the spectral resolution of the spectrograph. Therefore, we restricted our investigation to the strongest emission lines Hα and He ii.
For the pixel rows of the central parts of our trailed spectra we fitted Gaussians to the emission line profile. In order to suppress the influence of the noise and the satellite lines, the central region of the Gaussians was given a bigger weight than the adjacent spectral range (Bevington & Robinson 1992). After that a sine-fit was applied to the fitted radial velocity and the observed semi-amplitude , using the following relation:
| (1) |
where is the system velocity, is the radial semi-amplitude of the white dwarf (assuming these emission lines originate near the primary component), and and indicate the phase and the phase offset of the binary system, respectively.
As we do not have blue calibration spectra from the first observing night our velocity determinations of He ii were restricted to the spectra obtained in the last night.
There is a systematic shift in our velocity measurements: measurements from a trailed spectrum show a continuous drift to higher velocities. The reason for this is that the CCD chips are slightly warped. We account for this effect by fitting sky lines in the spectra from which we calculate the distortion. But the effect could not be eliminated in the blue spectral range, as there were only two weak sky lines which could not be used for a reasonable fit. Therefore, no correction was made in the blue spectral range. It should be noted that in spite of this systematic error our residuals are still low (Figs. 7 and 8).

The sine-fits to the radial velocity curves of Hα and He ii are given in Figs. 7 and 8, respectively. The deduced velocities are listed in Table 6. It is obvious, that there is a substantial difference between the radial velocities in Hα and He ii: the semi-amplitude in He ii is considerably higher. The difference in the radial velocity between the two lines can be explained by the blurred Hα emission (see Sect. 3.2). Our result for the radial velocity of He ii 4686 is km s-1, which is in accordance with other values given in the literature (Becker et al. 1998, Beuermann et al. 1995).
We also observe a considerable difference in the system velocity between Hα and He ii in our data. This effect is caused by the P-Cygni profiles: the blue wing of the Hα emission is truncated by the P-Cygni absorption and shifts the maximum of emission to slightly longer wavelengths. Thus, the system velocity in Hα differs notably from the velocity measured in He ii. Compared with other values published in literature (Becker et al. 1998) our derived system velocities are much higher, especially for He ii. For a reliable determination of the system velocity a dataset covering only a single orbital period is probably too short to eliminate statistical effects, which are caused by the varying influence of the jet emission. For comparison we show in Fig. 7 the velocities given in Tomov et al. (1998) in their Table 1. It is obvious that their system velocity for Hα is even higher. But due to the systematic shift in our distorted spectra our measured system velocity should not be given too much weight.
Photometric minimum and spectroscopic phase zero do not coincide. The photometric minimum occurs 0.11 and 0.17 in phase before spectroscopic phase zero for He ii and Hα, respectively. A similar shift for He ii was already observed by Beuermann et al. (1995).
For further investigations we adopt our results of the semi-amplitude for the rest of this paper. The system velocities for the Doppler tomography are taken from Becker et al. (1998).
As the jet lines of Hα mimic the orbital velocity modulation of He ii (Fig. 10), we assumed that the radial velocity modulation of He ii is related to the primary and therefore represents the motion of the white dwarf. Knowing the orbital period and amplitude of the radial velocity variations of the mass accretor we can deduce the mass function of the secondary star. For the calculation we use the data from the He ii emission line. The mass function is determined by
| (2) |
| Line | ||||||
|---|---|---|---|---|---|---|
| He ii | 73.7 | 2.6 | -131.7 | 25.0 | 0.11 | 0.03 |
| Hα | 33.0 | 1.8 | -53.0 | 12.0 | 0.17 | 0.01 |
where is the orbital period, is the radial velocity of the primary, and denote the mass of the white dwarf and the secondary, respectively, and is the inclination.
The mass function is obviously very low. If the emission lines of He ii are indeed related to the compact object we can deduce the mass of the companion. In Fig. 9 we plot our derived mass function for various inclinations . Because of the arguments given in Sect. 3.2, we assume that the inclination is reasonably high. We conservatively estimate that the inclination ranges between . If the compact object is a white dwarf with , then we obtain for the mass of the companion. The companion star is almost certainly a low-mass object. This could explain why we do not see any spectral features of the companion in our high resolution spectra. As low mass functions are also known from other SSS (e.g. Crampton et al. 1996, Hutchings et al. 1998), a low mass companion star may be common among this class of objects. A possible evolutionary scenario for low-mass secondaries in SSS is proposed by van Teeseling & King (1998).
3.4 Doppler tomography
![[Uncaptioned image]](/html/astro-ph/9811285/assets/x11.png)
![[Uncaptioned image]](/html/astro-ph/9811285/assets/x12.png)
![[Uncaptioned image]](/html/astro-ph/9811285/assets/x13.png)
![[Uncaptioned image]](/html/astro-ph/9811285/assets/x14.png)
![[Uncaptioned image]](/html/astro-ph/9811285/assets/x15.png) Figure 10:
Zoomed grey scaled representations of continuum subtracted,
photometrically calibrated, high resolution spectra of Hα,
Hβ, Hγ (left side), He ii 4686
and He ii 4542 (right side) in v,
-coordinates. Not covered phases are
marked with empty rows. In Hα the jets are clearly visible
and show an orbital motion similar to the He ii emission
lines, whereas the main emission shows almost no orbital motion.
The blue side of the Balmer lines are truncated by the
P-Cygni absorption. In Hγ complex substructures can be
detected. The fragmented line appearing in the Hγ spectra
at a velocity of 1200 kms-1 is a remnant of a night sky line.
Within the Helium lines a weak S-wave component is visible.
Figure 10:
Zoomed grey scaled representations of continuum subtracted,
photometrically calibrated, high resolution spectra of Hα,
Hβ, Hγ (left side), He ii 4686
and He ii 4542 (right side) in v,
-coordinates. Not covered phases are
marked with empty rows. In Hα the jets are clearly visible
and show an orbital motion similar to the He ii emission
lines, whereas the main emission shows almost no orbital motion.
The blue side of the Balmer lines are truncated by the
P-Cygni absorption. In Hγ complex substructures can be
detected. The fragmented line appearing in the Hγ spectra
at a velocity of 1200 kms-1 is a remnant of a night sky line.
Within the Helium lines a weak S-wave component is visible.
Doppler tomography is an useful tool to extract further information on the emission line origin from trailed spectra. This indirect imaging technique, which was developed by Marsh & Horne (1988), uses the velocity of emission lines at each phase to create a two-dimensional intensity image in velocity space coordinates . The Doppler map can be interpreted as a projection of emitting regions in accreting binary systems onto the plane perpendicular to the observer’s line of sight. The Doppler map is a function of the velocity , where the -axis points from the white dwarf to the secondary and the -axis points in the direction of the secondary’s motion.
An image pixel with given velocity coordinates produces an S-wave with the radial velocity
| (3) |
where and denote the system velocity and the phase, respectively.
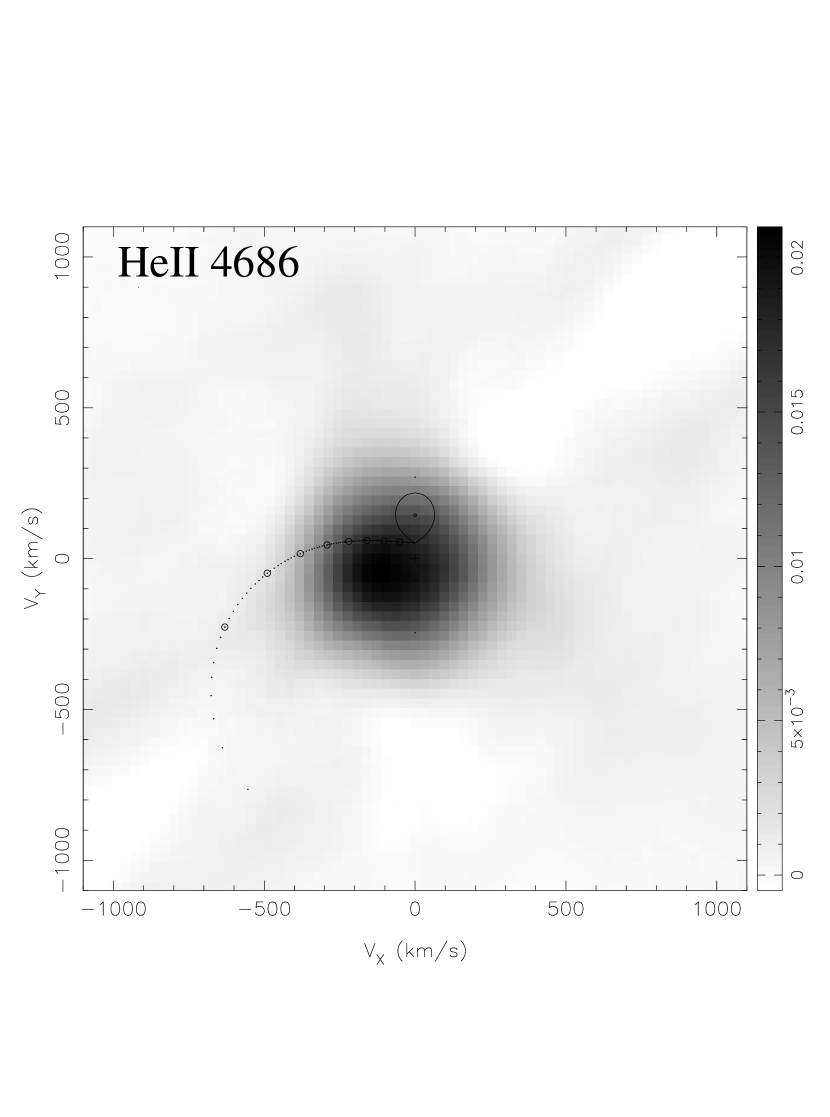
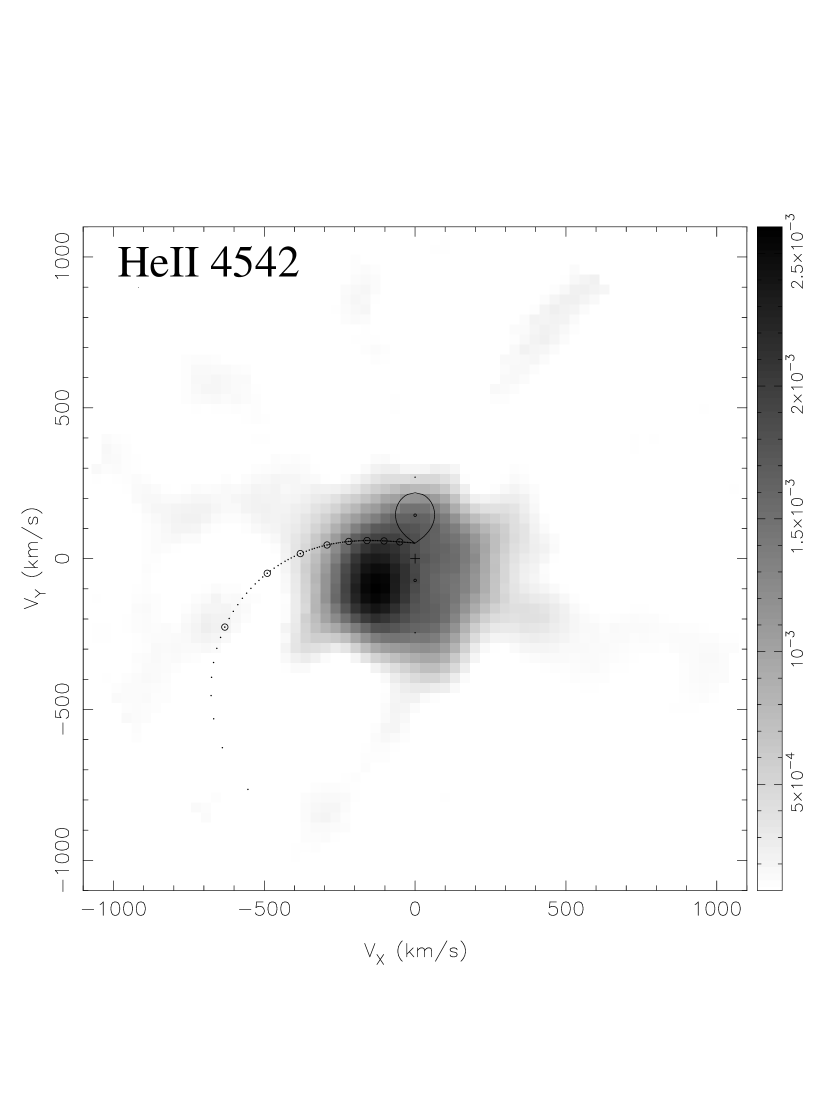
To accomplish this, a linear tomography algorithm, the Fourier-filtered back-projection (FFBP) is used, which is described in detail by Horne (1991). The resulting Doppler map (or tomogram) is displayed as a grey-scale image. To assist in interpreting Doppler maps we also mark the position of the secondary star and the ballistic trajectory of the gas stream. Assuming a Keplerian velocity field, emission originating in the inner parts of the disk has a larger velocity and thus appears in the outer regions of the map. Therefore, an image in such a representation is turned inside-out. For the tomogram analysis we restricted our investigation to the two Balmer lines Hα and Hβ and the emission lines He ii ( 4686) and He ii ( 4542) . No reasonable Doppler maps could be produced for other emission lines because of their poor S/N ratios.
Before computing the tomograms we subtracted the underlying continuum from the individual emission lines, since their line flux is the quantity needed to produce these maps. This was done by subtracting from each pixel row of the trailed spectra the corresponding median of the intensity. We achieved a FWHM resolution of 150 kms-1 in the central regions of the tomograms, whereas at higher velocities ( 800 kms-1) the resolution of the maps suffers a considerable degradation. Linear structures in the high velocity regions (Fig. 11) of the maps are sampling artifacts (aliasing streaks) which are not taken into account in the further interpretation. For a detailed discussion about sampling artifacts see e.g. Robinson et al. (1993).
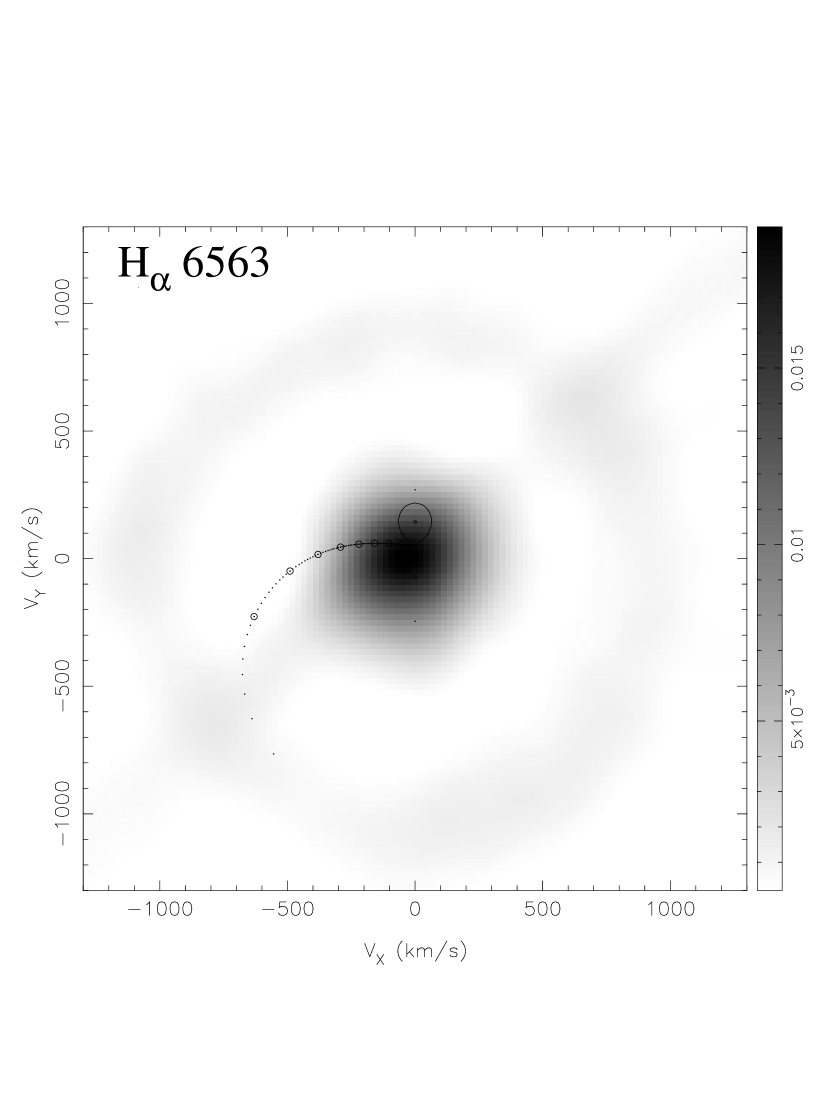
In Fig. 10 we present the trailed spectra of the emission lines in V, -coordinates; the Doppler tomograms are shown in Fig. 11. The schematic overlays in the Doppler maps represent the Roche-lobe of the companion star and the gas stream. They are a function of and . From our discussion in Sect. 3.3 we have taken 1 for the white dwarf and a 0.5 companion star. The center of mass and the location of the white dwarf are respectively marked by a cross and a point below the Roche lobe. The ballistic stream is represented by an arc originating from the secondary’s Roche lobe at the inner Lagrangian point. This arc is marked every 0.1 (open circles, is the distance from the center of the primary to the inner Lagrangian point) as it accelerates towards the compact object.
In the Balmer emission lines the blue side is truncated by the P-Cygni absorption. No S-wave structures can be detected at Hα and Hβ. The jet lines of Hα clearly show an orbital motion which is in phase with the motion of He ii. The main emission component of Hα reveals almost no orbital motion (compare Table 6). Therefore, we assume that the jet and the main emission do not have the same spatial origin.
The trailed spectra of both He ii lines show more details: in each spectrogram a weak S-wave component within the main emission can be detected.
The Doppler tomograms (Fig. 11) of our data immediately reveal that the emission line distribution does not resemble a typical accretion disk. The usual shape of an accretion disk would appear as a dark extended ring in the inverse grey-scaled Doppler images, e.g. compare with Doppler maps of IP Peg obtained with the same technique in Wolf et al. (1998). Our observed projected velocities are smaller than 350 kms-1. For a binary system with parameters mentioned above and a disk radius of cm ( is the volume radius of the Roche lobe of the white dwarf) one finds a Kepler velocity of 384 kms-1 at the rim of the disk. As the Kepler velocity increases rapidly within the accretion disk, the observed emission cannot originate within the disk if the inclination is high. For medium inclinations an origin only at the rim of the disk is possible. This conclusion is valid for a huge variety of system parameters (Fig. 12). Low inclinations are excluded (see discussion in Sect. 3.2).

The dim ring in the map of Hα at a velocity of kms-1 is due to the emission from the jet lines. The Balmer lines originate at locations with almost no or only very low velocities. All of the observed flux is symmetrically distributed around the center of mass extending to velocities of roughly 350 kms-1.
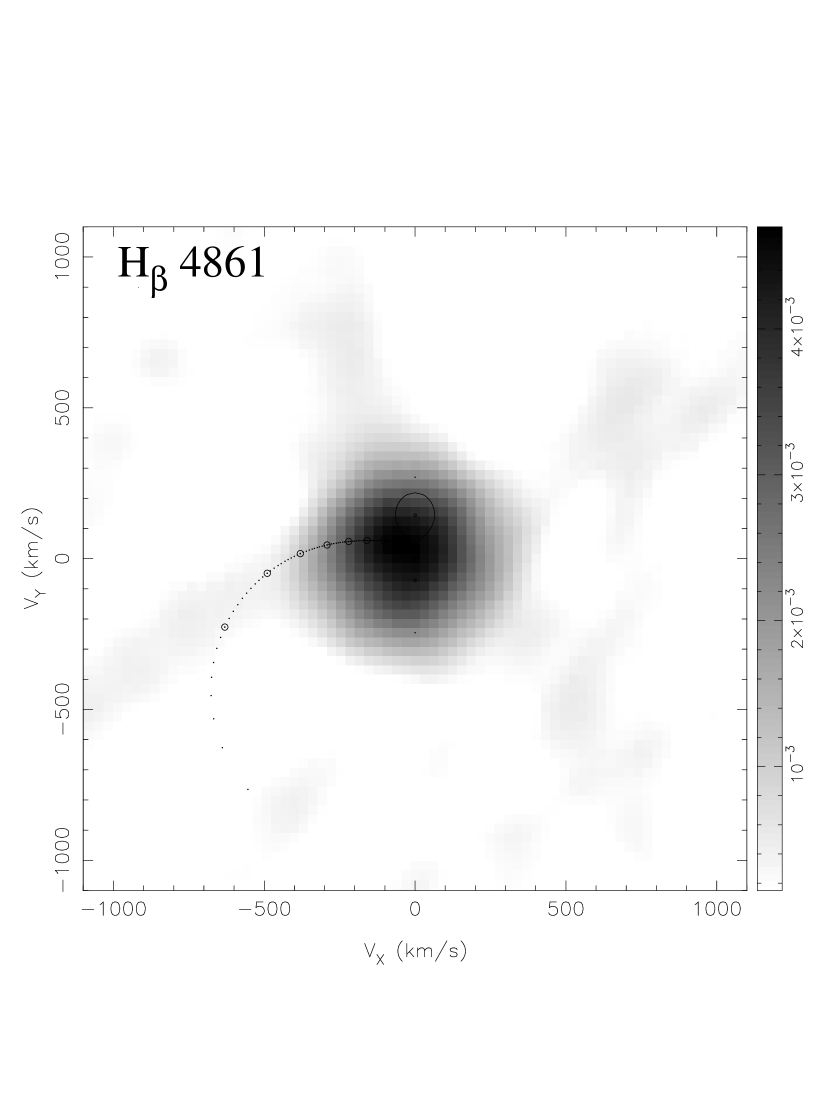
The intense emission maximum is located near the center of mass. Part of this emission might come from the irradiated secondary, but as the maximum of the emission is clearly shifted to kms-1 an irradiated secondary probably cannot account for all of the observed flux. The Doppler map of Hβ looks similar. Again, the whole flux including the intense maximum is distributed symmetrically around the center of mass.
The Doppler maps from the Helium lines are slightly different. Comparable to the Balmer emission the observed flux originates at locations with very low velocities. The intensity distribution as a whole is distributed roughly symmetrical around the center of mass. But the emission maximum of the Helium lines is not centered at the center of mass. The coordinates of this intense maximum are shifted to approximately –100 kms-1 and –100 kms-1 in both maps. This emission maximum does not coincide with the gas stream trajectory. But due to its position in velocity space the emission might originate in the elevated and radially extended accretion disk rim as proposed by Meyer-Hofmeister et al. (1998). Thus, the Helium emission might partly be related to the outermost accretion disk rim. The He ii ( 4686) map also indicates emission from regions near the white dwarf, which supports our assumptions in Sect. 3.3 for the estimation of the mass of the secondary.
Another indication about where this material might be located is given by the fact that the emission is roughly centered on the center of mass and not on the primary as would be expected for a typical accretion disk. This material might perhaps orbit the binary system around the mass center far outside of both Roche lobes. In a very simplified estimate one finds a distance of cm for the above given binary parameters and a supposed velocity of 150 kms-1 for the emitting circum-binary material. This is about 3.5 times the distance of the binary separation.
4 Discussion and summary
We performed high-speed photometric and spectrophotometric observations as well as high-resolution spectroscopy of the bright galactic SSS RXJ0019 between 1992 and 1997. Our detailed optical studies result in a new determination of the orbital period. We observed a color variation in symmetrical to the main minimum with an amplitude of = 0.15m. The observed lightcurves change between having a flat appearance (quiet optical state) and showing humps and steps with a 1.8 h period (excited optical state). RXJ0019 can change between the two states from night to night. These variations might be due to short-term changes of the mass accretion rate from the companion star.
Our spectroscopic investigation shows the well known emission line spectrum of mainly Balmer and Helium II lines. Symmetric emission lines adjacent to the Balmer lines show the presence of high velocity outflows (jets) probably originating near the white dwarf. The jet lines show an orbital Doppler motion comparable to that of the He ii lines. The velocity of the jet is quite low, indicating a medium to high inclination of the system.
From the radial velocities we calculated the mass function. For the assumed range of medium to high inclinations we derive a low mass for the secondary star (). Low mass companion stars might be common among the SSS. This might also be an explanation for the absence of any spectral features of the companion star in the high resolution spectra.
We also observe P-Cygni profiles in the Balmer lines showing an orbital modulation. The P-Cygni absorption almost disappears between 0.7 to 0.9. Higher transitions of the Balmer series up to H12 are only detected by their corresponding P-Cygni absorption. The velocity of the directed wind responsible for the P-Cygni profiles is 590 kms-1 with the absorption wings extending to 900 kms-1.
Our trailed spectra show substructures of different components. As these components are very weak or were observed in lines with bad S/N ratio the locations of these components cannot clearly be located by the means of Doppler tomography. The shifted intensity maximum in the Helium maps at –100 kms-1 and –100 kms-1 might be due to a radially extended and elevated accretion disk rim, consistent with theoretical models of SSS. But we clearly see that most of the line-emitting material is not located within the accretion disk. Due to the high accretion rate and viscous processes involved we assume that, almost the whole accretion disk is optically thick. Therefore, no emission from Balmer and Helium lines originating at the inner parts of the disk can be observed.
We only see line-emitting material with very low velocities. The emission distribution is mainly symmetrical around the center of mass. As material cannot be stationary at the center of mass the emission must originate at regions with very low velocities. Low velocities can be found far outside of the binary system. Therefore, we propose that this SSS has a circumbinary cocoon or disk of hydrogen and helium responsible for the observed emission lines.
Acknowledgements.
The authors would like to thank A. Fiedler for software support and T. Will for his data of RXJ0019. We are grateful to V. Burwitz and R. Popham for some helpful remarks on an earlier draft of this paper. We are grateful to E. Meyer-Hofmeister, F. Meyer and H. Ritter for helpful discussions. BD is especially grateful to H. Spruit for his assistance at MPA. We also thank the referee K. Matsumoto for valuable remarks.References
- (1) Barwig H., Schoembs R., Buckenmayer C., 1987, A&A 175, 327
- (2) Becker C.M., Remillard R.A., Rappaport S.A., 1998, ApJ 506, 880
- (3) Beuermann K., Reinsch K., Barwig H. et al., 1995, A&A 294, L1
- (4) Bevington P.R., Robinson D., 1992, Data reduction and error analysis for the physical sciences, McGraw-Hill Inc., New York
- (5) Crampton D., Hutchings J.B., Cowley A.P. et al., 1996, ApJ 456, 320
- (6) Greiner J., 1996, Workshop on Supersoft X-ray Sources, Garching, 1996, ed. J. Greiner, Lecture Notes in Physics No. 472, Springer Verlag, p. 299
- greiner (1) Greiner J., Wenzel W., 1995, A&A 294, L5
- horne (1) Horne K., 1986, PASP 98, 609
- horne (2) Horne K., 1991, in: Fundamental Properties of Cataclysmic Variable Stars: 12th North American Workshop on Cataclysmic Variables and Low Mass X-Ray Binaries, San Diego, San Diego State University Publication, p.160
- (10) Hutchings J. B., Crampton D., Cowley A. P., Schmidke P. C., 1998, ApJ 502, 408
- mantel (1) Mantel K.H., Barwig H., 1993, NATO ASI series C436, 329
- mantel (2) Mantel K.H., Barwig H., Kiesewetter S., 1993, AG Abstract series, 9, 14
- (13) Livio M., 1998, “Astrophysical Jets: A Phenomenological Examination of Acceleration and Collimation”, to appear in: Physics Reports
- (14) Marsh T.R., Horne K., 1988, MNRAS 235, 269
- mat (1) Matsumoto K., 1996, PASJ 48, 827
- mat (2) Matsumoto K., Fukue J., 1998, PASJ 50, 89
- (17) Meyer-Hofmeister E., Schandl S., Meyer F., 1997, A&A 321, 245
- (18) Meyer-Hofmeister E., Schandl S., Deufel B., Barwig H., Meyer F., 1998, A&A 331, 612
- (19) Motch C., 1998, A&A 338, L13
- (20) Popham R., Di Stefano R., 1996, Workshop on Supersoft X-ray Sources, Garching, 1996, ed. J. Greiner, Lecture Notes in Physics No. 472, Springer Verlag, p. 65
- (21) Quaintrell H., Fender R.P., 1998, A&A 340, 555
- (22) Robinson E.L., Marsh T.R., Smak J.I., 1993, in: Accretion Disks in Compact Stellar Systems, Singapore, World Scientific Publishing Co. Pte Ltd., p. 75
- (23) Southwell, K.A., Livio M., Charles P.A., O’Donoghue D., Sutherland W.A., 1996, ApJ 470, 1065
- (24) Šimić D., Barwig H., Bobinger A., Mantel K.H., Wolf S., 1998, A&A 329, 115
- (25) Tomov T., Munari U., Kolev D., Tomasella L., Rejkuba M., 1998, A&A 332, L34
- (26) van Teeseling A., King A. R., 1998, A&A 338, 975
- (27) Trümper J., Hasinger G., Aschenbach B. et al., 1991, Nature 349, 579
- (28) van den Heuvel, E.P.J., Bhattacharya D., Nomoto K., Rappaport S.A., 1992, A&A 262, 97
- (29) Will T., Barwig H., 1996, Workshop on Supersoft X-ray Sources, Garching, ed. J. Greiner, Lecture Notes in Physics No. 472, Springer Verlag, p. 99
- (30) Wolf S., Barwig H., Bobinger A., Mantel K.H., Šimić D., 1998, A&A 332, 984