15m ISO1 observations of the 1415+52 CFRS field: the cosmic star formation rate as derived from deep UV, optical, mid-IR and radio photometry
Abstract
The CFRS 1452+52 field has been deeply imaged
with the Infrared Space Observatory (ISO) using ISOCAM through the LW3 filter
(12-18m). Careful data analysis and comparison to deep
optical and radio data have allowed us to generate a catalog of 78 15
sources with both radio and optical identifications.
They are redder and lie at higher redshift than I-band selected galaxies,
with most of them being star-forming galaxies.
We have considered the galaxies detected at radio and 15m wavelengths
which potentially include all strong and heavily extincted starbursts, up
to z=1.
Spectral energy distributions (SED) for each of the sources have been derived
using deep radio, mid-IR, near-IR, optical and UV photometry. The sources were
then spectrally classified by comparing to SEDs of well known nearby galaxies.
By deriving their FIR luminosities by interpolation, we can estimate
their Star Formation Rate (SFR) in a way which does not depend sensitively
on the extinction. 75% (-40%, +10%) of the star formation
at z 1 is related
to IR emission and the global extinction is in the range =0.5 – 0.85.
While heavily extincted starbursts, with SFR in excess of
100 M constitute less than a percent of
all galaxies, they contribute about 18% of
the SFR density out to z=1. Their morphologies range from S0 to Sab, and more
than a third are interacting systems.
The SFR derived by FIR fluxes is likely to be 2.9 times higher than those previously estimated from UV fluxes. The derived stellar mass formed since the redshift of 1 could be too high when compared to the present day stellar mass density. This might be due to an IMF in distant star-forming galaxies different from the solar neighborhood one, or to an underestimate of the local stellar mass density.
1 Introduction
The 2800Å and [OII]3727 emission line luminosity densities have decreased
by a factor of 10 from z = 1 to the present day (Lilly et al. 1996;
Hammer et al. 1997).
This has led Madau et al. (1996, 1998) to suggest that the cosmic star
formation density has
decreased by the same factor within that redshift interval, and that
most of the stars seen now were formed during the first half of
the Universe’s existence.
The UV
emission from galaxies is produced by a complex mix of short and moderately
long-lived stars, the latter (late B and A0 stars) contributing more at longer
UV wavelengths. Even old stars in luminous early-type and quiescent galaxies
can contribute to the observed UV luminosity density. However
the most important
uncertainty in estimating the star formation density from the
UV luminosity density is due to the
extinction which can show large variations from one galaxy to another.
For example in IRAS star-forming galaxies, most of the energy is reemitted
at far-IR (FIR) wavelengths and these objects are either missed or their star
formation rates are severely underestimated when derived by UV measurements.
This is why it
is often thought that the UV luminosity density is likely to provide only
a lower limit to the actual star formation density. The
situation is complicated further by the expected contamination
by AGN to the UV light density.
In an attempt to better estimate the cosmic star formation density,
Tresse and Maddox (1998) have
calculated the extinction-corrected luminosity density at z
0.2.
Their result is in agreement with the UV (2800Å) at z = 0.35
(Lilly et al, 1996)
if an extinction of 1 mag is assumed for the UV continuum. A preliminary study
of more distant galaxies indicates that the situation might be similar at
z 1 (Glazebrook et al, 1998), but it is limited by the difficulty
of measuring the near-IR redshifted line of faint galaxies
with 4m telescopes.
Multi-wavelength analyses
can provide, in principle, a detailed budget of the energy output in each
wavelength range for the entire galaxy energy distribution. It has been shown
for local galaxies that FIR luminosities are tightly correlated
with radio luminosities (Helou et al. 1987; Condon 1992), and that bolometric
luminosities are most closely proportional to 12 m luminosities
(Spinoglio and Malkan, 1989; Spinoglio et al, 1995). These trends hold
over a wide range of galaxy luminosities, despite the large variety
of galaxy energy distributions. Only AGNs which are believed to be
associated to supermassive black holes, appear not to follow those relations
(Condon et al. 1988).
Recent observational advances allow now to study distant galaxies from the
UV to the radio, sampling a wavelength range which covers most of the
domain where their energy is being emitted.
VLA deep surveys are able to detect sources down
to 10 Jy (e.g. the 5GHz surveys of Fomalont et al. 1992
and Richards et al. 1998) and
ISOCAM (Césarky et al. 1996)
aboard the Infrared Space Observatory (ISO, Kessler et al. 1996)
can reach detection limits
of 100Jy at 15m (Elbaz et al. 1998).
In the range 60–200m the detection limits are 0.2 Jy at 60m
from the IRAS
Faint Source Catalog (Moshir et al. 1989) and 0.1 Jy at 175m
from the FIRBACK survey carried out with ISO (Clements et al. 1998;
Puget et al. 1998). FIR detections thus appear to be not sensitive enough
to reach the same
depth as radio and Mid-IR (MIR) deep surveys.
For example, if we consider a strong
and highly reddened starburst (SBH in the terminology of Schmitt et al. 1998),
a =250 Jy source would correspond to a 0.009 Jy source at 60m, and a z=1 redshifted SBH with =16Jy would
have 0.022 Jy at 175m.
The sensibility and high spatial resolution of
ISOCAM allow the study of distant
field galaxies at MIR wavelengths (2 20m).
Star-forming galaxies and AGN are easily detectable in the wavelength range
5-18m, even at large distances (Franceschini 1991).
The Canada-France Redshift Survey (CFRS)
field at 1415+52 (Lilly et al. 1995a) is the second
most observed field at all wavelengths after the Hubble Deep Field (HDF).
While it does not go as deep, it is
18.5 larger in area and thus is more suited for source statistics when
a volume-limited (z 1) sample is considered.
It has been observed to very faint magnitudes in the BVIK bands (photometric
completeness down to =23.5 mag, Lilly et al. 1995b), possesses
spectroscopic data for galaxies brighter than = 22.5 mag from
the CFRS, and deep radio observations (S 16 Jy , Fomalont
et al. 1992).
The CFRS sample can be considered complete in the sense that it
contains all luminous ( -20.5) galaxies in the volume out to
z = 1.
This paper presents a major follow-up study of the above CFRS field,
by gathering and studying
representative samples of galaxies selected at radio and MIR wavelengths.
With sensitivity limits of 250Jy at 15m (ISOCAM) and 16Jy at
5GHz (VLA), these
samples should include all strong and reddened starbursts up to z=1,
with star formation
rates larger than 100 and 70 respectively.
These samples should not miss any luminous FIR source
in the CFRS field as the sources were
selected using observations which cover wavelengths on
either side of the 60-100m bump.
They can thus be used ultimately to estimate the star formation density
which has been missed by UV flux measurements.
The nature of the Jy radio sources in the field and of their optical counterparts has been extensively discussed by Hammer et al. (1995). Recently this field has been imaged by ISOCAM in the LW2 (5-8.5m) and LW3 (12-18m) filters. We have presented the 6.75m LW2 observations in a previous paper (Flores et al. 1998). There, we have discussed the details of the data reduction, the astrometry and the confidence level for each source. Fifty four sources with S/N 3 were detected with S6.7μm 150 Jy, 21 of which possess spectra from the CFRS. Of the latter, 7 were stars. Among the non-stellar sources, 42% were classified as AGN and 50% as galaxies, i.e. star-forming galaxies with a significant population of A stars. The relatively high fraction of AGN is not unexpected because strong AGN are generally associated with a hot dust component and have generally bluer near-IR colors than starbursts. While the 6.75m data appears not to be optimal for selecting starbursts, they are useful for constraining galaxy SEDs, as galaxies (and especially Seyfert 2 galaxies) show large variations in their MIR color properties.
We present here the 15m LW3 observations.
For galaxies in the redshift range 0.25 z 1,
this filter samples the 8-12 rest wavelength region. It can thus
simultaneously provide samples
of normal, starburst and active galaxies which are complete to a well-defined
bolometric flux limit (Spinoglio et at, 1995). MIR measurements
are sensitive to dust thermal emission (), its broad
emission being interpreted as due to PAHs or Unidentified Infrared Bands
(UIBs) carriers (), and to nuclear
non-thermal radiation. There have been recent suggestions that PAHs arise from
photo-dissociation regions around HII regions, the latter showing red
near-IR continua (Laurent and Mirabel, 1998, in preparation). Genzel
et al. (1998) have used the relative strengths of PAH features and near-IR
colors
to discriminate AGN dominated objects from starbursts. Lutz et al. (1998)
found that the fraction of AGN powered objects is relatively small at
moderate IR luminosities (typically 2 ), but
reaches half at higher luminosities.
In section 2, we discuss the data reduction, the astrometry
and the construction of the catalogs. In section 3 we present the
redshift distribution of the ISOCAM LW3 objects, and their optical
properties including their morphologies from HST images.
Section 4 presents spectral energy distributions from UV to
radio wavelengths and a classification scheme for
these and for radio-selected galaxies. Derivations of the UV and IR
luminosity densities are presented in Section 5. Section 6 describes the
global star formation density at z 1 and compares it to previous
estimates based on the UV luminosity density.
2 Observations and data reduction
The CFRS field at 1415+52 was mapped with the ISOCAM LW channel
(PFOV 6 arcsec
pixel) and the filter LW3 (12-18m). Twelve individual images were
obtained using the micro-scanning AOT mode (CAM01) and resulting in a total
integration time of 1200 sec pixel-1.
The micro-scanning mode provides the best
spatial resolution by superposition of images. The same pixel of
the sky was placed in different parts of the camera in order to
minimize and detect any systematic effects. The micro-scanning AOT
technique also allows an accurate flat-field image to be generated and
yields a pixel size of 15 in the final integrated image. The
detection and removal of transients and glitches, integration of
images, absolute flux calibration, and source detection were carried
out using the method described by Désert et al. (1998). This method
has been found to be
particularly well adapted to our observational strategy, i.e. coadding
the twelve images, without redundancy within each image. Special
attention was paid to possible error propagation in the flux values.
The photometric
accuracy has been discussed by Desert et al. (1998). From the
stellar energy
distributions, we find the photometry to be accurate to a few percent
for sources with S/N 10, and to 50% for sources with S/N = 3.
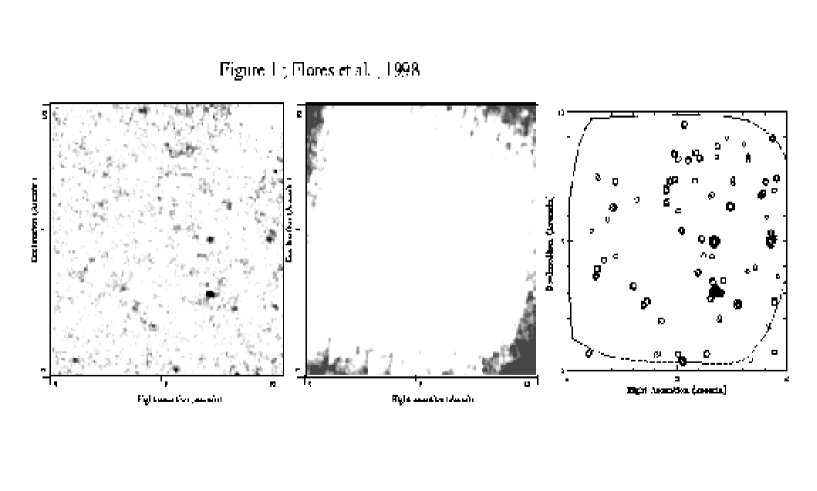
Figure 1 displays the final 15m image of the CFRS 1415+52 field.
Individual images were carefully registered with each other in order to
optimize the image quality of the brightest compact objects (see Flores et al,
1998).
The final image of the whole ISO field has a resolution equivalent
to a median FWHM11″ (calculated with DAOPHOT under IRAF).
It can be seen that the noise structure (Figure 1) is relatively homogeneous
(the standard deviation is lower than one tenth of the mean) in 85% of
the area of the image, except near the edges.
Point sources are iteratively extracted with a Gaussian PSF of 9 arcsecond FWHM; a correction factor of 1.39 (deduced from a detailed modelling of the effective ISO PSF, Cesarsky et al., 1996) is applied to the measured flux (calibrated with ISOCAM user’s manual conversion table) to account for losses in the wings of the true PSF.
2.1 ISO source catalogues
Source detections were made on the basis of S/N and repeatability in three
independent combinations of the 12 individual images (for details about
the source detection repeatability and classification, see F.X.
Desert et al. 1998).
The repeatability test is based on the redundancy factor,
which is the number of times that the sky pixel was seen by different
pixels on the camera. The software built three independent projection
subrasters, and for each source candidate the flux and error are measured
at the same position in each subrasters.
The quality factor is based on flux measurements and varies from the
best confidence index (= 4) to the worse confidence level
(= 0, see eqs. 7 to 11 of Désert et al.,1998). We have considered
only sources with a
confidence level higher than 3, which means that the final source flux is
within 3 (2 in the
case of 4) of the source fluxes in subrasters,
where is the error in the final source flux.
Altogether, 78 sources with S/N 3 fulfill these detection criteria (Table 1). We have considered as secure detections those sources with S/N 4 (41 sources, catalogs 1, 2 and 3). The 37 sources listed in catalogs 4, 5 and 6 with 3 S/N 4 are considered “less” secure. That a S/N 4 is a good detection criterion is confirmed by studies in the Lockman Hole Deep Survey (Césarsky et al. 1998, in prep) which show that sources with S/N in individual frames are confirmed in 95% of cases in the final integrated image (S/N 10).

(I-K)AB color distribution of 15m sources with 22.5 (bottom panel) compared to the CFRS galaxy color distribution (top panel).
Figure 2 shows the flux
distribution and the comparison to results from other fields suggests a
completeness down to 350 Jy for
sources with S/N 4, and to 250 Jy for sources with
S/N 3, at least for the central 85% of the 10’x10’ field.
These correspond to number densities of 1590 sources per square degree,
for 350 Jy, slightly larger than
the number density of 1260 source per square degree found by
Elbaz et al. (1998) in their ISOCAM survey of the Hubble Deep
Field.
Surveys of low S/N ratio sources can be affected by several biases,
the main ones being the possible unreliability of sources near the survey
limit and the Eddington bias.
Near the flux density limit, completeness falls off and
possible false sources may be introduced. The fraction of false sources
can be controlled through a random match
control test based on the identification rate of ISOCAM sources
with optical sources (see next section) and should be small.
We have checked whether our higher number count relative to the HDF data
could be due to the Eddington bias.
Our survey is intermediate in depth between the
Lockman Hole Deep survey (from 450 to 1400 microJy) and
the Hubble Deep Field survey (from 125 to 350 microJy).
Elbaz et al. (1998) quote a slope of 1.3 and 2.1 for the HDF and Lockman Hole
respectively, and we should expect an intermediate slope near 1.7, lower
than the value of 2.2 derived from our S250 and S350 Jy
counts.
We have attempted to estimate the fraction of sources which may have entered
our sample erroneously because statistical uncertainties
bring them over the detection threshold,
while they actually possess a lower flux density than S=250 microJy. We
have adopted a slope of 1.7 and perform
Monte Carlo simulations of 30 000 sets,
assuming a gaussian distribution for the
noise of faint sources. The simulations show that 15% of the
sources with S/N 3
can be sources with fluxes lower than 250 microJy, but that fraction drops to
only 2% for sources with S/N 4.
This is probably close to the truth since after accounting for the Eddington
bias (i.e. removing 15% of the 78 sources with S/N 3 as well as 2% of
the 41 S/N 4 sources), the slope becomes 1.7, in good
agreement with other surveys.
Biases in source counts thus affect mainly the faintest sources in our sample (those with 3 S/N 4). They are the least powerful sources, and as such cannot introduce significant uncertainties on global luminosity density estimates.
2.2 Astrometry and counterparts at radio and optical wavelengths
The positional accuracy of ISO sources is affected by both the pixel size and
the distortion (see Flores et al, 1998). The superposition of the ISOCAM field
onto the CFRS 1415+52 optical field was done by matching the positions of the 6
brightest sources (which were also detected at 6.75m).
By comparing the astrometry of the optical and ISOCAM LW3 sources,
we find a median difference of 3.7 arcsec. This is reasonable given that
the ISO pixel size is 6.0 arcsec.
The astrometric accuracy of the CFRS 1415+52 optical field is 0”.15,
based on the comparison between the optical and
radio frames (Hammer et al., 1995). We first compare the 15m image
with the VLA Jy radio map (Fomalont et al, 1991), and calculate the
probability of a pure coincidence, assuming Poisson statistics:
| (1) |
where d is the angular distance between the ISOCAM LW3 source and the radio
source in degrees and n is the integrated
density of radiosources with flux ( ) = 83520
). Ten
ISOCAM LW3 sources are thus identified (see Table 1). They all possess optical
counterparts (Hammer et al. 1995).
Astrometry of ISOCAM LW3 sources not detected in radio has been derived by comparison to the optical sources in the CFRS 1415+52 field, and
| (2) |
is the probability of a pure coincidence, where are integrated
counts derived from the CFRS. In table 1, six catalogs
have been defined with different S/N values
() and P values (,
and sources without optical counterparts within 12 arcsec). Objects which
are also radio sources are indicated. These all have very low
probabilities of accidental coincidence.
We also compare the 15m map with that described in Flores et al. (1998) at
6.75m. We found 17 of the 78 15m sources to be also
detected at 6.75Jy (with flux densities above 150Jy).
The fraction of 15m sources also detected at 6.75m increases
with S/N (see Table 2).
The final noise structure in ISOCAM images
is not strictly gaussian, because of possible
residuals glitches, and because the 15m positions could not have
been fully corrected for image distortions. To calibrate the
probabilities given in Table 1 in an empirical
way, we have applied a random match control test to the ISOCAM image
by rotating it successively by
45, 90, 180 and 270 degrees relative to the optical image. Only 31
of the 78 ISOCAM sources were found to be randomly associated with an optical
counterpart with 22.5 and P 0.02. This should be compared to
the 37 22.5 and P0.02 counterparts found in Table 1. These
experiments suggest
that non-gaussian effects cannot affect our probability calculations by
more than a factor 2.
Table 1 lists the sources in six catalogs, the confidence level decreasing in each successive catalog. The ISOCAM LW3 sources and their optical counterparts are given in columns (1) & (2). Column (3) provides the optical source redshift when available, ” star ” indicates that the ISO source is stellar, while ” — ” indicates that no redshift is available. In columns (4), (5) and (6) are the I, V and K isophotal magnitudes in the AB system, and ” – ” indicates that no photometry is available. Column (7) gives the angular distance in arcsec between the ISOCAM LW3 source and optical (or radio) identification, while column (8) gives the associated probability of coincidence. Columns (9) and (10) give the flux density at 12–18 m and its error in Jy. The positions and flux densities of the 9 non-identified ISO sources are also listed in Table 1 (catalogues 3 and 6).
Among the sources with 4, only 8
(19%) have counterparts fainter than = 22.5 , or no optical
counterparts. These sources could be at redshifts higher than 1.
The fraction of very faint optical counterparts increases for the fainter
ISOCAM LW3 sources (41% for sources with 3 S/N 4), which is to
be expected. On the other hand, in the most uncertain catalog (catalog 5),
one can expect 4.6 sources out of 19 to be pure coincidental
projection. In seven cases, more than one optical counterpart appear to be
related to an ISOCAM LW3 source. In the following analyses, we have used the
” best ” optical identification (i.e. , those with lowest coincidental
probability), but in Table 1, we have listed all possible optical
identifications with a probability within a factor two of the smallest
probability.
3 Optical properties of the 15m counterparts
3.1 Color and redshift distributions
The color distribution of the 15m optical counterparts (Figure 3) is significantly redder than that of the CFRS survey (top panel), with a median 0.5 magnitude redder than that of CFRS galaxies ().


Twenty six of the sources detected at 15m and with have spectroscopy available in the CFRS database. Among these are 4 stars which are also detected at 6.75m. Figure 4 shows the redshift histogram of ISO sources superposed on the CFRS redshift distribution. The median redshift value of the ISOCAM LW3 galaxies ( 0.76) is higher than that of the CFRS ( 0.58), but coincides with that of 16Jy radio sources (Hammer et al. 1995). Since 70% of the 15m optical sources have 22.5, we estimate from the redshift distribution that more than 63% of the sources with 250 Jy are at z 1.
3.2 Spectral classifications
The spectrophotometric classification of the m optical counterparts
is based on optical and emission-line properties using diagnostic diagrams
and spectral templates (see Hammer et al. 1995, 1997). The following
spectrophotometric types
are found: fifteen emission-line galaxies, three active galaxies
(including the QSO
CFRS 14.0198 at z=1.6, the most distant CFRS object), one quiescent galaxy, one
spiral galaxy, and one HII galaxy (CFRS 14.1103).
Figure 5 shows the spectra of all extragalactic objects,
classified by their spectrophotometric type.
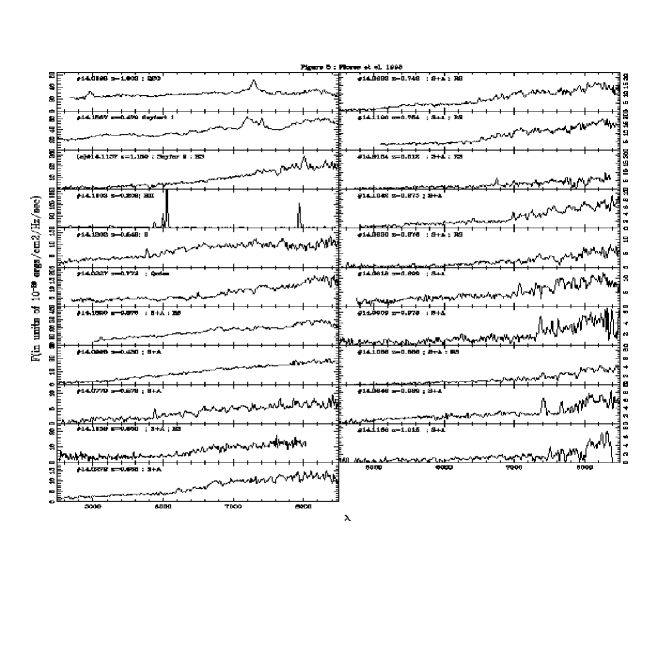
Most (71%) of the 15m optical counterparts are classified as galaxies, which are galaxies with moderate emission ( 20A), and characterized by large D(3550-3850) indices (see Table 3), as defined in Hammer et al. (1997). Large D(3550-3850) values can be caused by either a large A star population (D(3550-3850) is correlated with the equivalent width, D(3550-3850)=0.2 corresponding to =5-7 A for a non-extincted galaxy) or by very large extinctions. As we shall see, it is the A star hypothesis which is the most plausible. This suggests that in most extragalactic m sources, there were star formation occurring about 0.5 Gyr prior to the observed event. The importance of the S+A population is also supported by the fact that at high redshift, galaxies with large D(3550-3850) are also detected at 6.75m and at 1.44GHz.
3.3 Morphologies from HST and CFHT
About 30% of the CFRS field at 1415+52 has been observed by the HST. Public domain HST images of objects in the CFRS and Autifib/Low Dispersion Survey Spectrograph survey (the CFRS/LDSS deep survey, Brinchmann et al., 1997) and the Groth Survey (Groth et al., 1994) are available. Among the 55 ISO sources with optical counterparts, 16 (30%) with have been observed with the HST F814W filter. HST images of optical counterparts of Jy radio sources can be find in Hammer et al. (1996).
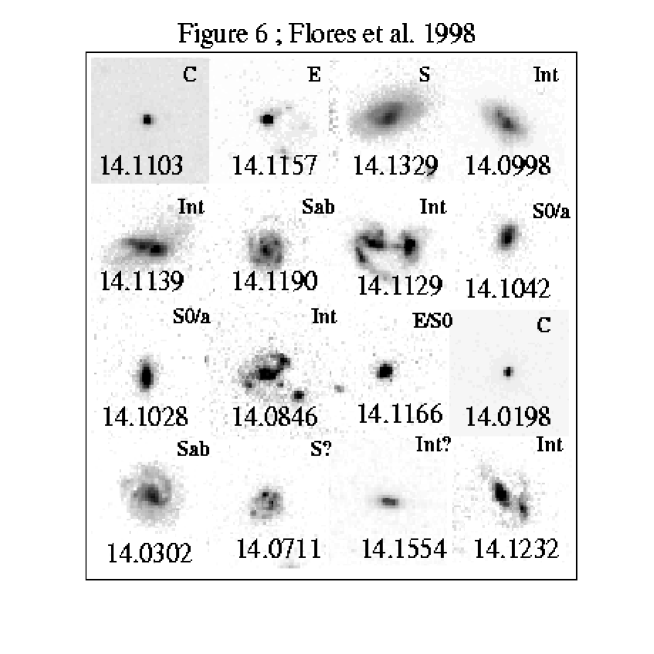
Figure 6 displays a mosaic of HST images of optical counterparts with 22.5 of 15m sources. For each source the CFRS name is indicated as well as its morphological classification by either Brinchmann et al. (1997) or us.
Two sources are unresolved by the HST (one QSO and one HII region, 14.1103). Six galaxies (37%) are found in strongly interacting systems, four (25%) are E/S0 galaxies and four (25%) are disk-dominated galaxies. Most of the 14 resolved sources show irregularities which might be interpreted as pre- or post-merging events.
4 Spectral energy distributions and object classifications
4.1 SEDs of local galaxies: toward a template data base
Several groups have been gathering multi-wavelength observations of
local galaxies
(Spinoglio et al. 1995; Schmitt et al. 1998). The main limitations
of the data sets are the
assumed aperture corrections and possible AGN variability. SEDs of galaxies
in the same class often show large differences, especially in the infrared.
This is especially true for Seyfert 2 galaxies which show a wide range of
colors in the near and far IR (Spinoglio et al. 1995). This large dispersion
motivated us to
use mean SEDs of local galaxies to compare with distant sources, so as to
avoid biases for or against a given class of galaxies. For
example, some Seyfert 2 galaxies may be misclassified as starbursts,
but the effect on global quantities would be compensated by
true starburst galaxies which are misclassified as Seyfert 2
galaxies.
However average properties can be affected by a single object with extreme
properties. For example, in the Schmitt et al. (1998) sample,
the average radio luminosities for elliptical and spiral galaxies
appears to be overestimated because of the
large radio powers of NGC 1316 and of NGC 598, respectively. Indeed the mean
values are significantly
( 8 times) larger than those derived from the much larger and more complete
sample of local ellipticals of Wrobel and Heeschen (1991). Using the median
rather than the mean
would provide a value in much closer agreement with Wrobel and Heeschen, and
also provide a SED for spirals which follows the radio-far infrared
correlation (Condon 1992). In the following we will use only median points
for determining the SED of local templates.

Another concern is whether using local templates to analyze the
properties of distant sources is appropriate. We have
compared the two samples of local galaxies which have been classified
and studied at several wavelengths.
The Schmitt et al. sample has been mainly selected from the IUE
archives and the Spinoglio
et al. sample from the 12m faint IRAS catalogue. Our 15 micron sample
has been selected at the wavelengths 15/(1+z) microns and 0.835/(1+z) microns,
so that both local samples are
a priori appropriate for use as templates for our sources.
The two local samples show
somewhat different properties in their SEDs, especially concerning
the average IR properties of Seyfert 2 galaxies.
The Schmitt et al. galaxies are bright
infrared galaxies and include most of the starburst and AGN templates
used by Genzel et al. (1998) to compare with ultraluminous IRAS galaxies.
Conversely, the Spinoglio et al. sample includes galaxies varying over a 4 to 5
magnitude range of luminosities in the infrared, and their average SEDs are
mostly dominated by fainter galaxies. Figure 7 shows the distribution of
luminosities for
the VLA/ISOCAM/CFRS objects. Rest frame luminosities at 7 have been
interpolated from broad band observations at 0.835, 2.2, 6.75 and 15, and
are available for most objects, except those detected only at radio
wavelengths. At z 0.5,these galaxies have luminosities comparable to
those of the Schmitt et al. galaxies, and are 1.5 to 2.5 magnitudes brighter
than the mean magnitude of the Spinoglio et al. galaxies.
It is reasonable to think that the discrepancies at IR wavelengths
between the Spinoglio et al. and Schmitt et al. galaxies are mainly
due to the large IR luminosity differences.
The large dispersions displayed by individual Schmitt et al. galaxies in each
class (especially for Seyfert 2 galaxies), ensure that this local sample is
the most appropriate one for comparison with the intrinsically bright distant
galaxies.
4.2 Classifications of the 15m-radio galaxies from their SEDs
According to Schmitt et al.(1997), the UV to optical range constitutes
the best discriminator between Seyfert 2 and SBH or
SBL (starburst with low extinction) galaxies. Seyfert 2 galaxies
are generally early-type spirals, with UV colors typically bluer than those of
spirals (see e.g. Kennicutt 1992). Figure 8 shows the color distribution of
the radio-15m samples. In the (B-K, 2800Å -B) diagram, their colors
are reasonably well fitted by Bruzual and Charlot (1995) models, except
for three objects which are either a QSO or a Seyfert 1 galaxy.
They display a range of colors which are well fitted by
starburst and spiral templates. The same conclusion can be drawn from the
(B-7m, 2800Å -B) diagram, with a few
objects having B-7 colors consistent with those of Seyfert 2 templates.
The latter are likely to be associated with hot dust, and
have redder optical-MIR colors than starbursts. In summary,
most of the galaxies detected at 15m have colors from the UV to the MIR
consistent with those of star-forming objects: starburst and spiral galaxies.

SEDs for the 27 extragalactic 15m-radio
sources with z 1 have been constructed, using the observed
fluxes at visible
(BAB , VAB and IAB magnitudes), near-IR (KAB when
available), MIR (6.7m, Flores et al, 1998; 15m, Table 1) and
radio wavelengths (1.4 GHz and 5 GHz from Fomalont et al., 1985),
and shifted to rest wavelengths. Each SED has then been
compared to the average SED of well-known local objects
(a sample of 59 galaxies, Schmitt et al., 1997). The latter
include E (ellipticals), Sp (spirals),
SBH (highly reddened starbursts), SBL (low extinction starbursts),
Seyfert 2 and LINERs. Schmitt et al. (1997) also provided
standard deviations of the mean, which allows us to optimize the comparison.
In order to classify the SEDs, we have performed Monte Carlo simulations, assuming independent variations of our flux measurements within Gaussian error bars. In each of the 5000 Monte Carlo sets, every object SED has been fitted to template SEDs spanning all the classes defined by Schmitt et al , providing a value weighted by the standard deviations of the mean given by those authors. Because galaxies often show properties intermediate between one class and another (see Figure 8), we also defined a hybrid class which consists of a linear superposition of starburst and spiral SED templates, with the contribution of the spiral SED varying from 10% to 90% in 10% steps. This hybrid class describes the current mix of old and young stellar populations in a galaxy. We have not defined other hybrid classes such as the Seyfert 2 + starburst class, as Schmitt et al. have found that these two populations have rather similar radio to infrared properties. 27 objects were successfully classified with this technique (the averaged-weighted is less than or equal to one) except for seven (Table 3). Among the latter, four are unambiguously powerful AGN as evidenced from their optical spectra (see Figure 5 and Hammer et al, 1995), including a QSO (14.1303) and Seyfert 1 galaxies (14.0573, 14.1302 and 14.1567), and one is a HII region (14.1103). The 1 sigma dispersion around the value for each fit gives an idea of the reliability of our classification scheme (Figure 9).

4.3 Final classification of the z 1 15m-radio sources
Among the 27 objects selected either at radio or 15 microns, we find seven
ambiguous cases, generally in the classes between Seyfert 2 and S + SBH
(Table 3). Table 4
summarizes all the informations derived from their optical spectra and
radio observations (spectral index and
imagery). For 3 objects, emission lines or radio properties remove the
ambiguity of the classification: 14.0779 shows a low ionization spectra and
both 14.1028 and 14.1041 have negative radio spectral indexes and radio
emission extending much beyond their optical sizes).
The validity of our classification scheme is illustrated in Figure 8, which
emphasizes the relevance of the (B-7m, 2800A-B) color-color diagram
as a diagnostic diagram
for distinguishing starbursts from AGN.
In that diagram, starbursts lie in a well defined color-color region,
while AGN-powered sources are around the starburst region. The object
with the smallest (B-7m) color is 14.9025 which is classified as a Liner.

Five galaxies, all within the 15m sample, are classified as pure SBHs.
They are generally radio sources,
and were classified by Hammer et al. (1995) as being star-forming S+A objects.
Figure 10 displays their SEDs on which is superposed the SBH SED from
Schmitt et al. The interpolated luminosity at
the 60m
bump and the 60m luminosity derived from the radio-FIR correlation
(, Franceschini et al. 1994) agree to
within 20% on average.
Nine objects,
seven of which are in the 15m sample, are classified
as the superposition
of a starburst with a spiral SED (Figure 11). For all of them but one
(14.0846), the starburst component dominates, providing more than 70%
of the object bolometric luminosity (see Table 3). Only half of these objects
are detected at radio wavelengths (Figure 7), so they have likely
lower star formation rates than pure SBHs.
It has been widely argued that powerful starbursts such as those
discovered by IRAS could contain an AGN which can contribute to
their infrared luminosities (Sanders et al, 1988). In addition to the fact that
their energy distributions and colors are typical of those of starbursts, it is
unlikely that the starbursts described here are significantly
contaminated by an AGN,
because:
-their infrared luminosities ( 2 , see Table 4)
are lower than those of the ultra-luminous IRAS galaxies. Local
galaxies with those luminosities are mainly star-forming galaxies (Lutz et al,
1998).
-their radio spectral indices range from 0.4 to 1, between the observed
frequencies of 1.4
and 5 GHz. This implies a thermal to non-thermal energy ratio in the rest
frame of 0 to 0.2, in good agreement with the starburst population studied by
Condon (1992).
-their radio angular sizes ( 2 arcsec) are always in agreement with their
optical sizes, as expected if star formation was distributed over the galaxy.
-five of them have z 0.7 and their spectra from CFRS have
[OIII]5007 and emission lines; they all show low ionization spectra,
with prominent [OII]3727 line, and for all but one, no [OIII]5007 line.
Figure 12
shows the sum of the five spectra, which reveals a red spectrum with
1 and 0.05. These
galaxies undoubtedly have emission-line spectra typical of HII regions,
not of AGN.


Six objects, three of which are in the 15m sample, are classified as
Seyfert 2 galaxies and
four, two of which are in the 15m sample,
are powerful AGN (Seyfert 1 and
QSO). Their SEDs are shown in Figure 13 as well as that of the radio Liner
14.9025, on which are superposed Schmitt et al. templates or radio-quiet
QSO SEDs from Sanders et al (1989).
The two remaining objects are 14.1103, an HII galaxy, and 14.0820, an
elliptical or a spiral galaxy with moderate star formation activity
(=16 Å). The object 14.1103 (z=0.21) is detected
at 15m but not at radio wavelengths,
and its SED is consistent with that of a local HII region.
This is in agreement with the absence of an old stellar
component as noted by
Tresse et al. (1993) from the very large equivalent width
( 2500 Å). A HST image (Figure 6) shows an unresolved object,
giving a diameter less than 250 pc. We are probably witnessing
here a compact system undergoing one of its very first bursts of
star formation: is not detected while
is very prominent. This galaxy shows spectral properties
similar to those of a primordial galaxy
according to Tresse et al. (1993). Those authors
derived a low heavy-element abundance ( 0.05 the solar value) and a large
effective temperature (T50 000K based on the
/ ratio).
5 Global UV and IR luminosities
5.1 Global UV luminosity
values have been interpolated from and (or ) colors, using a grid of models with exponentially decreasing SFR (=1 Gyr, Bruzual and Charlot, 1995) and a Salpeter IMF (dN(m)/dm=-2.35 over m=0.1-100 ). These calculations are found to be rather independent of the exact value of , except for very small values ( 0.1 Gyr). We have calculated the total L2800 (see Table 5) in the CFRS 1415+52 field. It is based on 143 galaxies which have been spectroscopically identified and are representative of the 558 galaxies in the field (see Lilly et al, 1995b). Converted to a luminosity density, this value is in excellent agreement (to within 6%) with that found for the whole CFRS field (Lilly et al, 1996). This is consistent with the Poisson error of 8% for the 143 representative galaxies.
5.2 Global infrared luminosity
5.2.1 Interpolated infrared luminosities
Infrared (8-1000m) luminosities are interpolated from our MIR and radio flux measurements, by using for each object the template from Schmitt et al. (1997) with the smallest . The template gives 5 to 7 points within the wavelength range of interest, and errors can be estimated for each object using our Monte Carlo simulations. Our quoted errors take into account flux measurements errors (13% on average) as well as uncertainties in our classification scheme (5% on average). The interpolated infrared luminosity for each object along with its associated error is given in Table 4.
5.2.2 Global infrared luminosity from galaxies of the 15m and radio samples
Galaxies detected at 15m and/or at radio wavelengths have infrared
luminosities in the range of 5 to 2 (Table 4),
comparable to those of typical local starbursts and Seyfert 2 galaxies
(Genzel et al. 1998). These should be compared to their 2800Å luminosities
which range from 4 to 2 and
are not very different from those of galaxies not detected at 15m
and at radio wavelengths. Thus, taking into account only the UV luminosity
of the 15m and radio galaxies which are luminous
infrared sources would lead to severe underestimates
of their actual star formation rates. Nearly half of the global infrared
luminosity of 15m and radio galaxies is coming from 7 sources
(4 SBHs and 3 Seyfert 2). These are detected at both wavelengths,
except for the Seyfert 2 galaxy 14.0937.
Estimates of infrared luminosities of these bright galaxies should thus
not be affected strongly by source count biases or modelling
uncertainties.
Accounting for the global luminosity is slightly complicated by the current observational status of the data. Hammer et al. (1995) and recent follow-up work have nearly completed the redshift identifications of the radio Jy sources. Among the 45 22.5 15m sources which are not detected at radio wavelengths, only 16 possess a redshift from the CFRS. The latter have not been selected a priori for their infrared properties, and can be considered as representative of the whole sample. In the calculation of the global luminosity, we have assumed two different scaling factors: 1 for luminous galaxies detected at radio wavelengths, and 45/16 = 2.8 for the less luminous galaxies undetected in radio, with an additional statistical error of 25%. Table 5 presents the different values of the global luminosities at 2800Å and in the infrared, after excluding powerful AGN (QSO and Seyfert 1). At IR wavelengths, Seyfert 2 contribute to more than a third of the global luminosity.
5.2.3 Global infrared luminosity from galaxies undetected at 15m and at radio
We consider here the subsample of the 49 galaxies which possess a redshift,
are not detected at 15 m or radio wavelengths,
and have been observed at K. This subsample can be taken as
representative of the 489 22.5 galaxies not detected
at 15m or at radio wavelengths in the CFRS 1515+52 field.
For these galaxies, we use BVIK photometry and their 15 m and radio
upper limits to
investigate their SEDs. We found that 19 of them have SEDs consistent
with those of local template SEDs for SBH galaxies and 16 with local
template SEDs for SBL galaxies. The relatively large fraction of SBLs
(starbursts with low extinction) is compatible with the fact that they
are not detected in the MIR range. Other objects have
their SEDs consistent with those of local template SEDs for E/S galaxies
(9 objects) or AGN galaxies (5 objects). The fraction of AGN is in reasonable
agreement with Hammer et al. (1997) who find that
8% of all galaxies in the field
at z 0.5, are Seyfert 2 galaxies as indicated by their emission
line ratios.
Figure 14 displays four examples of fits
for these objects. All objects but four have been reasonably classified by
this method. The 4 remaining objects have been finally classified as starbursts.

5.2.4 Infrared luminosity density related to star formation and uncertainties
The luminosity density of star-forming galaxies may be simply estimated
by summing up the contribution of all starburst galaxies (SBH, SBL and S+SBH)
identified in the field. Uncertainties which include errors in source counts,
flux errors and uncertainties in the identification, would come from
our Monte-Carlo simulations.
However several complications could affect the
validity of such a calculation. First, the origin of the UV and
infrared light from Seyfert 2 galaxies is unclear, and can be
attributed either to the AGN or to star formation or to both.
Indeed Seyfert 2 galaxies show
a wide range in their infrared properties, and few color diagrams
are able to distinguish them from starbursts. Contamination
of the luminosity density by AGN is potentially the most serious problem
for any estimate of the star formation density. Second,
cirrus can contribute to the infrared luminosity, and
this is likely the case for the objects classified as S+SBH.
It is often assumed that the 60m luminosity of apparently quiescent
early-type galaxies is related to cirrus excited by the emission of the
underlying stellar population (Sauvage & Thuan, 1992).
This is however disputed by Devereux and Hameed
(1997) who present some counter-examples,
and argued that young stars can be an
important source of the FIR light of early-type galaxies. One
may wonder however about the exact nature of early-type galaxies
with a significant
population of young stars embedded in dust. Might they not be equivalent to our
S+SBH galaxies? In that case, the cirrus contribution to
the infrared luminosity of these galaxies
cannot be significant as the starburst
component contribute to most of their bolometric luminosities.
Recall that former estimates of the SFR co-moving density from the UV light are uncertain, because:
-
1.
they include contributions at 2800Å from AGN and old stellar populations.
-
2.
they do not account for the UV light reprocessed by dust into FIR radiation.
We wish here to take into account the deficiencies mentioned above and
calculate upper and lower limits to the luminosity density related to
star formation. The upper limit is obtained with the following assumptions:
First, the 15m and radio fluxes of all objects not detected at those
wavelengths are set equal to their detection limit. This provides
an upper limit to their infrared flux.
Second, the 2800Å and 60m luminosities of AGN-classified objects are
assumed to be powered by star formation.
Third, the infrared luminosities of S+SBH galaxies are assumed to be only
coming from star formation.
The lower limit is obtained with the following assumptions:
First, all objects not detected at 15m and at radio wavelengths have
zero extinction, and hence the star formation rate estimated
at infrared wavelengths equals that estimated at UV wavelengths.
Second, the 2800Å and 60m luminosities of AGN and of
quiescent (E) galaxies are assumed to be related respectively to the
active nucleus and to the old stellar component.
Third, the infrared luminosities of S+SBH galaxies are assumed to be related
to both cirrus and star formation, in the proportion of
the ratio of the bolometric luminosities of the two components.
Table 5 displays the global luminosities in the CFRS 1415+52 field, as derived from UV (2800Å ) and infrared (8-1000m) fluxes, for the sample of objects detected either at 15m or at radio wavelengths, and for that containing objects not detected at both wavelengths. The AGN contributions are given in the upper limit case. They can attain non negligible values ( 20%), including at UV wavelengths. This represents a major uncertainty for the SFR densities derived from UV fluxes. The errors take into account uncertainties in source counts, flux measurements errors and uncertainties in the classification scheme.
6 Estimation of the cosmic star formation rate
6.1 Star formation density derived from the UV light density
The star formation history has been estimated by various
authors (see Madau et al. 1996; Lilly et al. 1996;
Hammer et al. 1997)
on the basis of the CFRS and/or the HDF surveys, using star formation
rates derived from 2800Å or fluxes.
Since the UV light is dominated by emission from more or less massive stars,
the total SFR as derived only from the flux at 2800Å is somewhat uncertain,
as the extrapolation to the low mass end () of
the IMF is not constrained. Moreover
Hammer et al. (1997) have suggested that dust and metallicity can
severely affect these estimates and mask the true evolution of the cosmic
star formation rate.
We adopt in the calculation of
the star formation rate (SFR) from the UV light the calibration
of Madau et al (1998) and Kennicutt (1998), assuming a Salpeter (1955) IMF with
mass limits 0.1 and 100 :
| (3) |
6.2 Star formation density derived from the infrared light density
The SFR can also be inferred from infrared luminosities, assuming that they
result mostly from dust heating by young stars, in the optically thick limit.
The SFR calibration depends mainly on the
burst duration and on the IMF slope at both high and intermediate mass ranges.
Following Kennicutt (1998) we adopt the same IMF as that assumed to calculate
the SFR derived from UV light and:
| (4) |
The above equation is based on the models of Leitherer & Heckman (1995) for a continuous burst with age 10-100 Myr. Condon (1992) calibrated the SFR from the non-thermal radio luminosity (), assuming the Galactic relation between and the radio supernova rate. He then derived the calibration from the FIR-radio correlation, showing that 2/3 of the UV-optical emission is re-emitted between 40 and 120 microns (see also Helou 1988). After rescaling his value by assuming a Salpeter IMF (0.1-100 ), Condon (1992) obtains:
| (5) |
The difference between the two authors is at the 28% level, in agreement
with the Kennicutt uncertainty estimate of 30% on his calibration,
after comparison with other models (Hunter et al, 1986, Lehnert & Heckman,
1996, Meurer et al, 1997).
The key parameter in these estimations is the star formation rate of massive stars (typically 5 ), which are mainly responsible for the UV continuum, the non-thermal radio continuum and FIR luminosities re-radiated by dust. The ratio calculated in the following, is essentially independent of the IMF slope, and in particular of any extrapolation towards low stellar masses.
6.3 Star formation density missed by UV observations
We aim to calculate here the cosmic SFR from the infrared emission,
and compare it with that derived
from the UV emission. We first consider the ”directly observed”
SFR, based on observations of the
22.5 galaxies, as presented by Lilly et al. (1996).
In section 5.1, we have calculated the total
contributed by all galaxies with 22.5 and .
In section 5.2, we have computed the total
from those galaxies with either 250 Jy or
16 Jy and from CFRS galaxies not
detected at 15m and at radio wavelengths.
We have calculated the ratio accounting for all galaxies
not classified as powerful AGN. It ranges from 2.5 0.95 in the lower
limit case, to 5.4 1.9 when galaxies undetected at 15m and
in radio have their
fluxes at these wavelengths equal to the detection limit. These values can
however be affected by uncertainties on the calibration of the SFR in the
UV and FIR wavelength ranges. Nevertheless the values we find for
and show some consistency, since for all galaxies,
is larger than . These ratios
give extinctions ranging from =0.49 to 0.87, if we assume a standard
galactic extinction law. If the true SFR density is given
by the FIR estimation, then
from 35% to 85% of the global SFR co-moving density for z 1
are not taken into account when only the UV flux density is considered.
Figure 15 shows the co-moving SFR density evolution with lookback time
(for =50 km and =0.5). The VLA-ISO-CFRS
points (filled dots) represent the average values of the upper and lower
limits defined above. Since there is no evidence for a change in the
extinction for z 0.5 as compared to for 0.5 z 1,
we have adopted the same redshift bins as those used in previously
deriving the SFR from the UV fluxes. VLA-ISO-CFRS data are 2.91.3
larger than former UV estimated values, even though latter were accounting for
all sources, including strong AGN. The error bars are accounting for
incompleteness errors (Lilly et al, 1996) as well as uncertainties in
the determination of the SFR density at IR wavelengths.

Error bars in Figure 15 are very large mostly because we have assumed
that the blue galaxies undetected at 15m and at radio wavelengths
have no extinction (lower limit case), or have flux densities
equal to the detection limits
(upper limit case), both of which are clearly unrealistic assumptions.
It is interesting to check whether our average value makes sense.
Starbursts detected by both ISOCAM and the VLA are rare. They have large
extinctions ranging from
= 1.5 to 2, and show red continua (Figure 12). Tresse & Maddox
(1998) predict
an extinction of 1 mag at 2800Å (or = 0.48) for the blue field
galaxy population
at z 0.3. If the same value holds on average for blue galaxies
up to z = 1,
we can predict in principle the infrared luminosity of the field galaxy
population not detected at 15m and at radio wavelengths. For them,
Table 5 gives an
average value = 196 in the field.
According to equation 3, this
corresponds to a global of 980 .
Adopting the Tresse & Maddox extinction estimate, the global infrared
luminosity would be equal to 1445 (equation 4). This is
in very good agreement with the average value in the fourth column of
Table 5, and adds more confidence in the VLA-ISO-CFRS average values shown
in Figure 15.
These average values imply that the stellar mass formed since z = 1 would be 3.3 , slightly larger than the estimation of the present day stellar mass of 3 (Cowie et al., 1996; Glazebrook et al., 1995). Of course, the uncertainties on the SFR estimations are large, and our lower estimate is still consistent with the present day stellar mass. However we believe that this will constitute a serious problem, when uncertainties will be lowered by larger and deeper surveys at infrared and radio wavelengths. The problem gets worse if one accounts for the additional star formation at z 1. There may be two ways out. First, half of the SFR density comes from 10% of the field galaxies, those detected at 15m and at radio wavelengths. These objects with large SFR (especially those with 100 ) may have IMFs which significantly deviate from the Salpeter law. Alternatively, the local stellar mass density may have been systematically underestimated.
7 Comparison with the HDF/ISOCAM surveys
The number densities of faint MIR and radio sources found in the CFRS 1415+52 field and in the HDF appear to be a reasonable agreement. However our results are not consistent with those derived for the HDF by Rowan Robinson et al. (1997). The HDF is 18.5 smaller in area than the CFRS 1415+52 field, and from our results, we would expect 0.3 starburst with SFR larger than 100 , as compared to the four starbursts with SFRs from 500 to 1010 claimed by Rowan-Robinson et al. (1997). No simple explanation can account for this discrepancy of more than one order of magnitude. The calibration of the by Rowan-Robinson et al(1997) differs slightly from ours (their proportionality factor in equation 4 is 2.6 instead of our 1.7 ). We simply stress that:
- a)
-
our source detection and identification procedures are robust (see also Flores et al, 1998), while source identifications can be difficult in the HDF, since several galaxies in the HDF can lie within a single ISOCAM pixel.
- b)
-
Rowan Robinson et al. (1997) have used a three-component model (a stellar component giving rise to the UV to MIR emission plus cirrus and starburst components giving rise to the MIR to radio emission) to fit galaxy SEDs. This type of model has several degrees of freedom, including the relative energy ratio between the different components. The number of free parameters is larger than the number of available data points (1-3) in the MIR to radio wavelength range.
- c)
-
Among the twelve HDF galaxies whose SEDs were fitted by Rowan Robinson et al. (1997), five have limits on their radio luminosities which are significantly lower than the starburst model predictions (see their Figure 1).
Instead of force-fitting the data points by multiple-parameter starburst models, we propose here a more conservative empirical approach of fitting SEDs of galaxies with with SED templates of well-studied local galaxies (see Schmitt et al. 1997). The fits are generally quite good, especially for starburst (SB) SEDs which are consistent with the standard radio-FIR correlation. A pure starburst has its energy distribution dominated mostly by star formation. Its SED includes massive star light with or without extinction at UV wavelengths, reemission of the absorbed UV light at MIR and FIR wavelengths, and starburst thermal emission and synchrotron radiation from supernova remnants at radio wavelengths. Locally, Schmitt et al. (1997) show that starbursts, when compared to normal spirals or ellipticals, have a smaller spread in their SEDs from FIR to radio wavelengths. There is no evidence that these properties change significantly in the redshift range 0 .
Strong starbursts (with SFRs larger than 70 )
should be detected by deep radio surveys to Jy levels, such as those by
Fomalont et al. (1992) in the CFRS 1415+52 field,
or by Fomalont et al. (1997)
in the HDF. The fact that these are not detected in the HDF at radio
wavelengths casts some doubts on the large SFRs derived by Rowan Robinson
et al. (1997) for objects without radio counterparts.
As for the 3 radio sources with 16Jy and z 1 which are
found in the HDF (Fomalont et al, 1997), one (ISOHDF 12 36 46 + 62 14 06,
z=0.96) is found by Rowan-Robinson et al. (1997) to have the
highest SFR (1010 ) in their sample.
It is at z=0.96, has an elliptical morphology, is undetected at 15 m
(as most of the elliptical galaxies of the Hammer et al. (1995)
radio sample), and shows highly ionized emission typical of a Seyfert galaxy
(MgII2799, [NeV]3426 and [NeIII]3868).
It is likely a Seyfert 1 galaxy since the MgII line is broad, and
its radio emission shows some variability (Richards et al. 1998).
It is doubtful that its emission is powered by star formation.
To derive FIR luminosities (and hence SFRs) requires complete information from UV to radio wavelengths. It seems reasonable to use templates based on well-known local objects, especially for the most powerful star-forming galaxies.
8 Conclusions
Observations of distant field galaxies have been obtained with ISOCAM down
to unprecedented flux levels at 6.75m (S150Jy) and at
15m (S250Jy). We have attempted to make our samples at both
those wavelengths as complete as possible, by a careful reduction of the
data. That the samples are complete is suggested by the good positional
correlation between source identifications at 6.75m,
15m and radio wavelengths.
Source densities are comparable at 6.75m (1944 S150Jy sources
per square degree, Flores et al. 1998),
15m (2808 S250Jy sources per
square degree, this paper) and
5 GHz (1440 S16Jy sources per square degree,
Fomalont et al, 1991). Star-forming objects contribute respectively,
50%, 73% and 26% of the extragalactic counts at 6.75m,
15m and 5 GHz. This suggests that the 60m luminosity
density is strongly dominated by star-forming galaxies.
The fraction of z 1 objects is
found to be 32%, 43% and 40% of the extragalactic counts
at 6.75m, 15m and 5 GHz, respectively. The 15m survey is
found to be rather efficient in selecting high-redshift objects, since sources
with 22.5 and 250 Jy
have a median redshift of 0.76 as compared to 0.59 for the whole CFRS.
The 15m survey, combined with radio and optical data, allows to
identify the most powerful star-forming objects (with larger than
100 ) in the field, at least
up to z = 1. Four such objects (0.7%) are found
among the 578 22.5 galaxies,
and they contribute to 18% of the SFR density. From their
UV or emission line properties, these objects cannot be
distinguished from galaxies with more modest rates of star formation.
If we correct for extinction, assuming that their optical
spectra from 2500 to 4000Å is reddened by the standard galactic
extinction curve (with derived from the to
ratio), they would appear as
young starbursts with a moderate population of A stars (=
3.5Å in the combined spectrum). The 15m sample contains highly
reddened young starbursts as
well as a larger number of galaxies (S+SB) with lower SFRs, which all contain a
significant population of A stars (S+A galaxies). This is consistent with the
scenario of strong starburst episodes followed by the last phases of the burst,
where the IR emission is still high due to dust heating by intermediate-mass
stars (M= 1-3 , Lisenfeld et al, 1997).
Combination of 15m and radio samples probably gives a good
representation of the galaxy population in a very deep 60 m survey. Interpolated infrared (8-1000 m) luminosities
based on fits of galaxy SEDs by local templates from radio to UV
wavelengths, imply that 75% (-40%,10%)
of the star formation rate density
for is hidden by dust. No evidence has been found for an evolution
of that fraction in the above redshift range. The global opacity of
the Universe up to z = 1 ranges from = 0.5 to 0.85.
A subsample of sixteen 15m galaxies observed by the HST indicates
that more than a third of the star formation hidden by dust is associated with
interacting galaxies or mergers.
Estimates of the SFR from UV fluxes carry some uncertainties because of
two main reasons, one related to the UV light reprocessed by dust into FIR
radiation, and the other, to the probably important contribution of AGN
light at UV wavelengths. In spite of the small statistics of the sample
considered here,
our work allows a first glimpse of the true SFR density for .
From our careful data analysis, and the use of multi-wavelength data from
radio to UV, we believe that the true SFR density lies within the
region delimited by the still large error bars in Figure 15. Our average
value, 75% of the star formation rate density hidden by dust, is
consistent with:
- a one mag absorption at 2800Å for the blue galaxy population
(see Tresse & Maddox, 1998), and,
- less than 4% of the galaxies are highly reddened, detected at
15m and at radio wavelengths and contribute to 50% of the global IR
luminosity density.
Although our values are lower by a factor 2.8 than those of Rowan Robinson et al. (1997), they might be too high when the corresponding stellar mass formed since z = 1 is compared to the present-day stellar mass density. This could raise an important question about the universality of the IMF, especially in the high SFR galaxies detected by ISOCAM and the VLA, and described in this paper. Studies of other CFRS fields with the same multi-wavelength technique are needed to improve the source statistics, determine more accurately the SFR density, and study in more detail its redshift evolution.
Acknowledgments:
We thank Marc Sauvage and David Elbaz for useful discussions. We are also grateful to David Schade who made available the HST images of the CFRS 1415+52 field in stamp format. Comments and criticisms from an anonymous referee has led us to greatly improve the manuscript.
References
- (1) Brinchmann, J., Abraham, R., Schade, D., et al. ,1997, ApJ, 499, 112.
- (2) Bruzual, G. and Charlot, S. 1995.
- (3) Cesarsky, C.J., Abergel, A., Agnese, P. et al, 1996, A & AL, 315, 32.
- (4) Clements, D., Puget J., Lagache G., et al, 1998, astro-ph/9809054.
- (5) Condon, J.and Roderick J., 1988, AJ, 96, 30.
- (6) Condon, J., 1992, ARA&A 30 575.
- (7) Connolly A., Szalay A., Dickinson M., SubbaRao M., Brunne R., 1997, ApJL, 486, 11.
- (8) Cowie, L., Hu, E. Songaila, A., and Cohen, J., 1996, ApJ, 112, 839.
- (9) Désert, F. X., Puget,J., Clements, D. L., et al. 1998, A&A, to appear.
- (10) Devereux N. and Hameed S., 1997, AJ113, 599.
- (11) Devereux N. and Young J., 1991, ApJ, 371, 515.
- (12) Edelson R. and Malkan M., 1986, ApJ, 308, 59.
- (13) Elbaz, D., Aussel, H., Baker, A., Cesarsky, C. et al, astro-ph/9807209
- (14) Flores, H., Hammer, F., Desert, F.X., et al.,1998, A&A, to appear.
- (15) Fomalont, E.B., Windhorst, R.A., Kristian, J.A. and Kellerman, K.I., 1991, AJ, 102, 1258.
- (16) Fomalont, E.B., Kellermann, K., Richards, E.,et al., 1997, ApJL, 475, 5.
- (17) Franceschini A. , Mazzei P., Zotti G. and Danesse L., 1994, ApJ, 427, 140.
- (18) Franceschini A., Toffolatti L., et al, 1991, A&ASS, 89, 285.
- (19) Hammer F., Crampton, D., Lilly, S., Le Fèvre, O., Kenet, T., 1995, MNRAS, 276, 1085.
- (20) Hammer F., Schade, D., Crampton, D., Lilly, S., Le Fèvre, O., 1996, in ”Science with the HST II”, Proceedings of a workshop held in Paris, Dec. 4-8, 1995, ed. Benvenuti et al, P. 101.
- (21) Hammer F., Flores H., Lilly S., Crampton D., Le Fèvre O., Rola C., Mallen-Ornelas G., Schade D. and Tresse L., 1997, ApJ, 480, 59.
- (22) Helou G., Khan I., Malek L. and Boehmer L. 1988, ApJS 68, 151.
- (23) Hunter J. Sandford M., Whitaker R. and Klein R. 1986, ApJ 305, 309.
- (24) Genzel R., lutz D., Sturn E., el al, 1997, astro-ph/9711255.
- (25) Groth E., Kristian J., Lynds R., et al., 1994, BAAS, 185, 5309.
- (26) Gallagher J., Bushouse, H., Hunter, 1989, AJ, 97, 700.
- (27) Gallego J., Zamorano, J., Aragon-Salamanca, A., Rego, M., 1995, ApJ, 455, 1.
- (28) Glazebrook K., Peacok J., Miller L., Collins C., 1995, MNRAS, 275, 169
- (29) Glazebrook K., Blake C., Economou F., et al, 1998, astro-ph/9808276.
- (30) Kennicutt, R. 1992, ApJ, 388, 310.
- (31) Kennicutt, R. Jr., 1998, to appear in ApJ, astro-ph/9712213.
- (32) Kessler M.F., Steinz, J.A., Anderegg, M.E. et al., 1996, A&AL, 315, 27.
- (33) Lehnert M. and Heckman T., 1996, ApJ 472, 546.
- (34) Leitherer M. Fergunson H. and Heckman T., 1995, AAS 186, 3004.
- (35) Lilly S., Le Fèvre O., Crampton D., Hammer F., and Tresse L., 1995, ApJ 455, 50.
- (36) Lilly, S.J., Hammer, F., Le Fèvre, O., Crampton, D., 1995, ApJ, 455, 75.
- (37) Lilly S., Le Fèvre O., Hammer F., Crampton, D., 1996 , ApJL 460, L1.
- (38) Lisenfeld U.,Volk H. and Xu C., 1996, astro-ph/9605118.
- (39) Lutz D., Genzel R., Rigopoulou D., et al, 1998, to appear in ApJ, astro-ph/9808330.
- (40) Madau P., Ferguson H. and Dickinson M., et al., 1996, MNRAS, 283, 1388.
- (41) Madau P., Pozzetti L. and Dickinson M., 1998, ApJ, 498, 106.
- (42) Meurer G., Heckman T., Lehnert M. et al, 1997, AJ 114, 54.
- (43) Moshir M., “IRAS Faint Source Survey, Explanatory supplement” version 1, 1989.
- (44) Osterbrock, D., 1989, “Astrophysics of gaseous Nebulae and Active Galactic Nuclei”, University Science Books.
- (45) Puget J. and Léger, 1989 ARAA, 27, 169.
- (46) Puget J., Léger A. and Boulanger, F., 1985, A&AL, 142, 9.
- (47) Puget J., et al, 1998, in preparation
- (48) Richards E., Kellermann K., Fomalont E. et al, 1998, AJ 116, 1039.
- (49) Rowan-Robinson, M., Mann, R., Oliver, S., et al., 1987, MNRAS.
- (50) Salpeter E., 1955, ApJ 121, 161.
- (51) Sauvage M. and Thuan T.X., 1992 ApJL, 396, 69.
- (52) Scoville and Young J., 1983, ApJ 265 148.
- (53) Sanders D., Soifer B., Elias J, et al, 1988, ApJ328, 35.
- (54) Sanders D., Phinney E., Neugebauer G., 1989, et al., ApJ, 347,29.
- (55) Schade D., Crampton D., Hammer F., Le Fèvre, O., Lilly S.J., 1996, MNRAS, 278, 95.
- (56) Schmitt H., Kinney A., Calzetti D. and Storchi-Bergmann T., 1997, AJ, 114, 592.
- (57) Spinoglio L. and Malkan M. 1989, ESA IRSA 343.
- (58) Spinoglio L, Malkan M., Rush B. et al, 1995, ApJ 453, 616.
- (59) Tresse L., Hammer F., Le Fevre O. and Proust D. 1993, A&A 277, 53.
- (60) Tresse L. and Maddox ,1998, ApJ495, 691.
- (61) Wrobel J. and Heeschen D., 1988, ApJ, 335, 677.
| ISO– | CFRS | z1 | IAB | VAB | KAB | d3 | P4 | Flux5 | Error | ||
|---|---|---|---|---|---|---|---|---|---|---|---|
| Catalogue 1: Objects with S/N 4 & 0.02 | |||||||||||
| 0 | 14:17:41.8 | 52:28:23.3 | 14.1157 | 1.150 | 20.54 | 22.45 | – | 0.65 | 0.0000007 | 1653. | 57. |
| 5 | 14:17:41.9 | 52:30:23.2 | 14.1139 | 0.660 | 20.20 | 21.49 | 18.92 | 2.94 | 0.0003837 | 562. | 48. |
| 9 | 14:17:40.4 | 52:28:21.1 | 14.1192 | — | 23.49 | 24.40 | – | 0.92 | 0.012702 | 399. | 58. |
| 13 | 14:17:52.0 | 52:25:32.8 | 14.0855 | — | 20.92 | 22.60 | – | 0.72 | 0.000998 | 487. | 69. |
| 32 | 14:17:56.6 | 52:31:58.6 | 14.0711 | — | 21.44 | 22.29 | 20.26 | 1.50 | 0.006552 | 274. | 54. |
| 42 | 14:18:20.9 | 52:25:53.0 | 14.0098 | star | 14.66 | 16.44 | – | 1.53 | 0.000029 | 362. | 69. |
| 43 | 14:17:42.6 | 52:28:46.3 | 14.1129 | — | 21.05 | 22.35 | 20.30 | 0.57 | 0.000694 | 209. | 52. |
| 44 | 14:17:34.9 | 52:27:51.0 | 14.1329 | 0.375 | 19.52 | 20.60 | – | 1.89 | 0.0002947 | 347. | 52. |
| 51 | 14:17:24.3 | 52:30:24.0 | 14.1567 | 0.479 | 19.79 | 20.04 | 18.62 | 2.99 | 0.006937 | 459. | 57. |
| 84 | 14:17:45.8 | 52:30:31.2 | 14.1028 | 0.988 | 21.57 | 23.84 | 19.69 | 1.52 | 0.0074637 | 295. | 50. |
| 145 | 14:18:07.1 | 52:28:37.3 | 14.0446 | — | 20.00 | 21.33 | – | 0.31 | 0.000089 | 314. | 54. |
| 206 | 14:18:13.4 | 52:31:47.3 | 14.0272 | 0.668 | 20.51 | 21.70 | 19.12 | 1.51 | 0.003157 | 297. | 55. |
| 233 | 14:17:58.5 | 52:27:14.8 | 14.0663 | 0.743 | 20.88 | 22.34 | – | 2.51 | 0.002081 | 288. | 56. |
| 282 | 14:18:18.9 | 52:29:05.4 | 14.0138 | star | 15.77 | 16.80 | 15.43 | 5.66 | 0.000985 | 214. | 53. |
| 294 | 14:17:47.0 | 52:29:11.9 | 14.0998 | 0.430 | 20.58 | 21.84 | 19.06 | 2.44 | 0.0086947 | 245. | 53. |
| 303 | 14:17:46.4 | 52:33:50.8 | 14.1006 | — | 20.66 | 21.74 | – | 2.12 | 0.007003 | 270. | 53. |
| 308 | 14:17:26.7 | 52:32:20.9 | 14.1511 | — | 20.71 | 21.61 | – | 0.78 | 0.000990 | 284. | 61. |
| 369 | 14:18:4.0 | 52:27:47.6 | 14.9154 | 0.812 | 21.57 | 23.06 | – | 3.25 | 0.0004897 | 304. | 51. |
| Catalogue 2: Objects with S/N 4 & 0.02 | |||||||||||
| 8 | 14:17:23.8 | 52:27:49.3 | 14.1598 | — | 19.84 | 21.00 | – | 8.87 | 0.061772 | 367. | 73. |
| 24 | 14:17:23.7 | 52:34:33.7 | 14.1582 | — | 22.78 | 23.44 | – | 3.92 | 0.123123 | 341. | 77. |
| 138 | 14:17:26.3 | 52:32:51.5 | 14.1527 | — | 23.00 | 24.24 | – | 5.54 | 0.268762 | 252. | 62. |
| 139 | 14:18:18.3 | 52:29:16.3 | 14.0150 | — | 22.23 | 24.19 | 19.98 | 1.64 | 0.014691 | 284. | 57. |
| 160 | 14:17:37.4 | 52:31:41.9 | 14.1278 | — | 22.08 | 28.36 | 20.31 | 11.04 | 0.448282 | 401. | 55. |
| 190 | 14:17:54.1 | 52:33:56.2 | 14.0779 | 0.578 | 22.01 | 23.10 | – | 2.94 | 0.039091 | 255. | 53. |
| 195 | 14:17:24.6 | 52:30:40.1 | 14.1569 | — | 20.61 | 21.65 | 19.51 | 7.05 | 0.071948 | 364. | 61. |
| 258 | 14:17:41.1 | 52:30:22.3 | 14.1166 | 1.015 | 22.46 | 23.88 | 20.46 | 5.24 | 0.166123 | 188. | 47. |
| 258 | 14.1178 | 9.999 | 22.47 | 24.66 | 20.24 | 6.38 | 0.237751 | 188. | 47. | ||
| 278 | 14:17:42.9 | 52:28:00.8 | 14.1103 | 0.209 | 22.33 | 22.64 | – | 7.84 | 0.306807 | 235. | 55. |
| 278 | 14.1145 | — | 22.64 | 25.72 | – | 7.72 | 0.365875 | 235. | 55. | ||
| 278 | 14.1091 | — | 22.02 | 22.79 | – | 10.70 | 0.412821 | 235. | 55. | ||
| 278 | 14.1125 | — | 22.62 | 25.75 | – | 8.45 | 0.415531 | 235. | 55. | ||
| 296 | 14:17:56.0 | 52:32:55.9 | 14.0741 | — | 23.00 | 23.16 | – | 6.09 | 0.314943 | 207. | 49. |
| 296 | 14.0743 | — | 21.65 | 22.74 | – | 10.58 | 0.320898 | 207. | 49. | ||
| 304 | 14:17:27.3 | 52:32:09.6 | 14.1489 | — | 20.91 | 20.54 | – | 9.14 | 0.147525 | 284. | 61. |
| 307 | 14:17:47.9 | 52:34:06.6 | 14.0975 | — | 21.21 | 23.19 | – | 7.45 | 0.126166 | 252. | 55. |
| 325 | 14:18:12.5 | 52:32:48.4 | 14.0291 | — | 22.19 | 24.51 | – | 3.88 | 0.077093 | 225. | 51. |
| 361 | 14:17:49.9 | 52:33:43.2 | 14.0909 | 0.978 | 22.34 | 24.30 | – | 2.12 | 0.026649 | 248. | 56. |
| 372 | 14:18:02.7 | 52:27:59.6 | 14.0557 | — | 21.63 | 22.51 | – | 3.57 | 0.042434 | 225. | 52. |
| 421 | 14:17:52.5 | 52:35:13.4 | 14.9907 | — | 22.95 | 19.41 | – | 7.78 | 0.447372 | 259. | 55. |
| 434 | 14:17:44.1 | 52:25:50.5 | 14.1070 | — | 20.86 | 21.33 | – | 5.82 | 0.060281 | 277. | 65. |
| 440 | 14:17:39.3 | 52:28:46.1 | 14.1232 | — | 22.06 | 23.19 | 20.05 | 3.91 | 0.070782 | 245. | 55. |
| 440 | 14.1212 | — | 20.20 | 20.65 | 20.30 | 8.87 | 0.081572 | 245. | 55. | ||
| 457 | 14:17:52.1 | 52:30:49.8 | 14.0846 | 0.989 | 21.81 | 23.15 | 20.34 | 2.97 | 0.034073 | 250. | 50. |
| Catalogue 3: Objects with S/N 4 & without optical counterpart in IAB | |||||||||||
| 021 | 14:17:23.2 | 52:32:58.3 | — | — | — | — | — | — | 1.0000000 | 270. | 62. |
| 202 | 14:17:57.3 | 52:32:29.8 | — | — | — | — | — | — | 1.0000000 | 209. | 49. |
| 288 | 14:17:53.6 | 52:33:44.6 | — | — | — | — | — | — | 1.0000000 | 231. | 55. |
| 439 | 14:17:54.7 | 52:32:54.9 | — | — | — | — | — | — | 1.0000000 | 248. | 53. |
| Catalogue 4: Objects with 4 S/N 3 & 0.02 | |||||||||||
| 171 | 14:18:16.1 | 52:29:39.2 | 14.0198 | 1.603 | 20.04 | 20.21 | 19.86 | 1.52 | 0.002196 | 211. | 56. |
| 183 | 14:17:30.9 | 52:33:44.0 | 14.1400 | star | 15.61 | 16.13 | – | 5.59 | 0.000845 | 208. | 60. |
| 228 | 14:17:23.3 | 52:30:33.4 | 14.1609 | star | 18.93 | 20.83 | 18.30 | 2.54 | 0.002518 | 193. | 61. |
| 243 | 14:17:35.9 | 52:32:46.6 | 14.1302 | 0.548 | 20.85 | 21.72 | – | 3.19 | 0.018359 | 188. | 55. |
| 310 | 14:18:15.0 | 52:31:22.2 | 14.0227 | 0.772 | 20.84 | 22.08 | 19.47 | 3.42 | 0.020906 | 196. | 53. |
| 326 | 14:17:53.5 | 52:25:51.5 | 14.0818 | 0.899 | 21.02 | 22.14 | – | 2.74 | 0.010601 | 165. | 54. |
| 3516 | 14:17:40.7 | 52:33:57.9 | 14.9504 | — | 23.90 | 99.99 | – | 8.44 | 0.0059867 | 228. | 59. |
| 354 | 14:17:47.8 | 52:32:52.8 | 14.0968 | — | 23.39 | 24.88 | – | 1.07 | 0.015834 | 172. | 54. |
| 396 | 14:18:18.2 | 52:33:04.9 | 14.0151 | — | 17.92 | 18.19 | – | 1.93 | 0.000647 | 185. | 53. |
| 408 | 14:17:40.5 | 52:27:14.7 | 14.1190 | 0.754 | 20.99 | 22.49 | – | 0.95 | 0.0018377 | 185. | 56. |
| 427 | 14:17:59.7 | 52:26:01.4 | 14.0645 | — | 22.44 | 24.40 | – | 9.72 | 0.0008247 | 247. | 67. |
| 449 | 14:17:42.7 | 52:32:21.6 | 14.1117 | — | 20.79 | 21.15 | – | 3.77 | 0.024364 | 213. | 54. |
| 475 | 14:17:53.9 | 52:31:37.0 | 14.0820 | 0.976 | 21.69 | 24.27 | 19.37 | 11.82 | 0.0128677 | 203. | 53. |
| Catalogue 5: Objects with 4 S/N 3 & 0.02 | |||||||||||
| 137 | 14:17:23.9 | 52:25:54.1 | 14.1597 | — | 23.05 | 25.95 | – | 4.89 | 0.224187 | 284. | 93. |
| 174 | 14:17:45.3 | 52:29:47.6 | 14.10421 | 0.722 | 21.49 | 23.38 | 19.79 | 3.67 | 0.040133 | 197. | 50. |
| 183 | 14:17:30.8 | 52:33:54.2 | 14.1403 | — | 21.48 | 24.21 | – | 4.96 | 0.071532 | 208. | 60. |
| 228 | 14:17:23.7 | 52:30:29.7 | 14.1591 | — | 22.76 | 23.65 | 21.60 | 5.51 | 0.225442 | 193. | 61. |
| 243 | 14:17:36.0 | 52:32:55.4 | 14.1300 | — | 23.25 | 24.15 | – | 5.65 | 0.328192 | 188. | 55. |
| 276 | 14:18:12.7 | 52:31:41.8 | 14.0287 | — | 22.29 | 24.19 | 19.98 | 7.56 | 0.281069 | 175. | 51. |
| 277 | 14:17:24.7 | 52:26:56.2 | 14.1554 | — | 21.90 | 23.07 | – | 5.51 | 0.120360 | 240. | 76. |
| 341 | 14:17:23.9 | 52:32:28.0 | 14.1576 | — | 22.33 | 23.83 | – | 9.93 | 0.444487 | 214. | 64. |
| 341 | 14.1596 | — | 24.21 | 26.44 | – | 4.52 | 0.422721 | 214. | 64. | ||
| 367 | 14:17:25.7 | 52:31:32.2 | 14.1533 | — | 22.42 | 23.19 | 21.81 | 7.46 | 0.299945 | 177. | 54. |
| 377 | 14:17:40.8 | 52:34:13.0 | 14.1170 | — | 21.83 | 23.92 | – | 5.14 | 0.100134 | 233. | 60. |
| 384 | 14:17:42.6 | 52:29:54.3 | 14.1120 | — | 22.60 | 23.57 | 20.78 | 6.25 | 0.251090 | 187. | 51. |
| 396 | 14:18:17.7 | 52:33:02.6 | 14.0157 | — | 22.35 | 23.01 | – | 7.03 | 0.258736 | 185. | 53. |
| 399 | 14:18:05.8 | 52:32:10.2 | 14.0477 | — | 23.01 | 24.73 | – | 4.36 | 0.177522 | 179. | 53. |
| 408 | 14:17:40.3 | 52:27:20.6 | 14.1195 | — | 22.67 | 24.42 | – | 5.85 | 0.235036 | 185. | 56. |
| 424 | 14:18:12.3 | 52:29:45.4 | 14.0302 | — | 20.87 | 22.20 | 19.22 | 5.07 | 0.046449 | 191. | 50. |
| 426 | 14:18:19.9 | 52:30:47.2 | 14.0112 | — | 23.53 | 24.86 | 20.61 | 6.04 | 0.433874 | 160. | 53. |
| 442 | 14:17:38.5 | 52:34:43.2 | 14.1252 | — | 21.91 | 21.79 | – | 10.02 | 0.347868 | 221. | 69. |
| 449 | 14:17:43.3 | 52:32:19.5 | 14.1100 | — | 24.46 | 24.37 | – | 2.75 | 0.220019 | 213. | 54. |
| 474 | 14:17:31.7 | 52:29:11.0 | 14.1393 | — | 22.23 | 23.67 | 21.28 | 2.42 | 0.031712 | 160. | 52. |
| Catalogue 6: Objects with 4 S/N 3 & without optical counterpart in IAB | |||||||||||
| 231 | 14:17:33.4 | 52:34:21.1 | — | — | — | — | — | — | 1.0000000 | 209. | 59. |
| 268 | 14:17:31.4 | 52:25:37.5 | — | — | — | — | — | — | 1.0000000 | 224. | 70. |
| 348 | 14:18:06.3 | 52:25:32.0 | — | — | — | — | — | — | 1.0000000 | 193. | 67. |
| 359 | 14:17:23.0 | 52:28:59.2 | — | — | — | — | — | — | 1.0000000 | 234. | 73. |
| 483 | 14:17:29.9 | 52:29:21.3 | — | — | — | — | — | — | 1.0000000 | 167. | 53. |
| Total | 41 | 37 | 78 |
| # | 33 | 22 | 55 |
| with z | 17 | 9 | 26 |
| # | 4 | 10 | 14 |
| No id | 4 | 5 | 9 |
| LW2 detection | 10 | 7 | 17 |
| radio detection | 5 | 5 | 101 |
| CFRS | E | Sp | LI NER | Seyfert2 | SBL | SBH | Hybrid | Class | ||||||||
|---|---|---|---|---|---|---|---|---|---|---|---|---|---|---|---|---|
| Hyb SB+S Clas | Er | Er | Er | Er | Er | Er | Er | %SBH+%S | ||||||||
| 14.0227 | 12.69 | 1.24 | 3.18 | 0.59 | 2.47 | 0.81 | 0.97 | 0.27 | 2.21 | 0.78 | 0.37 | 0.31 | 0.19 | 0.13 | 9+1 | SB+S |
| 14.0272 | 12.11 | 1.69 | 4.45 | 0.93 | 2.54 | 0.88 | 1.16 | 0.45 | 1.58 | 0.60 | 0.41 | 0.32 | 0.29 | 0.20 | 8+2 | SB+S |
| 14.0276 | 4.22 | 0.31 | 0.75 | 0.22 | 0.75 | 0.18 | 0.51 | 0.17 | 4.10 | 0.85 | 1.32 | 0.20 | 0.15 | 0.12 | 8+2 | SB+S |
| 14.0573 | Seyfert 1 | |||||||||||||||
| 14.0663 | 8.11 | 0.61 | 1.51 | 0.70 | 1.58 | 0.26 | 0.59 | 0.04 | 2.18 | 0.84 | 0.47 | 0.06 | 0.51 | 0.10 | 9+1 | SBH |
| 14.0727 | 11.90 | 0.95 | 4.07 | 1.25 | 2.89 | 0.38 | 1.41 | 0.30 | 0.70 | 0.30 | 0.55 | 0.16 | 0.23 | 0.19 | 8+2 | SB+S |
| 14.0779 | 16.16 | 2.25 | 21.11 | 18.57 | 6.07 | 1.31 | 0.55 | 0.17 | 1.73 | 0.54 | 0.63 | 0.30 | 1.40 | 0.67 | 9+1 | Seyfert 2 /SBH |
| 14.0818 | 13.20 | 0.89 | 3.0 | 6 0.15 | 4.10 | 0.54 | 1.17 | 0.22 | 2.27 | 2.17 | 0.48 | 0.32 | 0.23 | 0.11 | 8+2 | SB+S |
| 14.0820 | 2.94 | 2.21 | 0.62 | 0.19 | 1.69 | 1.85 | 2.13 | 0.22 | 16.92 | 4.31 | 6.59 | 0.99 | 0.64 | 0.26 | 1+9 | S |
| 14.0846 | 8.94 | 0.74 | 2.17 | 0.22 | 3.65 | 1.16 | 0.45 | 0.19 | 4.85 | 3.24 | 0.83 | 0.29 | 0.35 | 0.22 | 4+6 | SB+S /Seyfert2 |
| 14.0854 | 3.46 | 0.43 | 0.73 | 0.22 | 0.94 | 0.40 | 0.21 | 0.10 | 6.47 | 1.27 | 1.42 | 0.11 | 0.06 | 0.13 | 8+2 | SB+S /Seyfert2 |
| 14.0909 | 5.13 | 0.97 | 1.51 | 0.33 | 1.55 | 0.24 | 0.15 | 0.01 | 6.36 | 1.05 | 1.67 | 0.21 | 1.46 | 0.56 | 4+6 | Seyfert 2 |
| 14.0937 | 15.61 | 9.20 | 3.63 | 0.72 | 10.81 | 4.20 | 1.53 | 0.16 | 12.68 | 6.98 | 8.53 | 3.37 | 2.79 | 1.11 | 1+9 | Seyfert 2 |
| 14.0998 | 7.89 | 1.75 | 4.42 | 4.22 | 1.42 | 0.19 | 0.86 | 0.18 | 2.92 | 0.23 | 0.51 | 0.22 | 0.31 | 0.20 | 6+4 | SB+S |
| 14.1028 | 3.13 | 0.43 | 0.86 | 0.31 | 0.66 | 0.16 | 0.25 | 0.12 | 6.23 | 0.41 | 1.47 | 0.15 | 0.54 | 0.24 | 4+6 | Seyfert 2 /SB+S |
| 14.1041 | 23.07 | 6.23 | 33.67 | 72.26 | 6.21 | 1.72 | 1.45 | 0.11 | 1.59 | 0.93 | 7.34 | 3.11 | 1.81 | 1.08 | 8+2 | Seyfert 2 /SB+S |
| 14.1042 | 8.29 | 0.75 | 3.01 | 1.18 | 1.43 | 0.16 | 0.45 | 0.13 | 4.01 | 0.25 | 0.95 | 0.18 | 0.38 | 0.15 | 8+2 | SB+S /Seyfert2 |
| 14.1103 | HII | |||||||||||||||
| 14.1129 | 13.09 | 2.76 | 2.77 | 0.63 | 3.53 | 1.99 | 0.97 | 0.47 | 1.23 | 0.70 | 0.54 | 0.28 | 0.49 | 0.31 | 7+3 | SB+S |
| 14.1139 | 8.83 | 0.24 | 2.05 | 0.12 | 1.69 | 0.09 | 0.66 | 0.08 | 1.36 | 0.05 | 0.28 | 0.06 | 0.81 | 0.07 | 9+1 | SBH |
| 14.1190 | 8.57 | 0.79 | 1.34 | 0.27 | 1.59 | 0.58 | 0.80 | 0.21 | 2.01 | 0.94 | 0.37 | 0.17 | 0.45 | 0.13 | 9+1 | SBH |
| 14.1302 | Seyfert 1 | |||||||||||||||
| 14.1303 | QSO | |||||||||||||||
| 14.1329 | 18.24 | 1.11 | 8.25 | 0.13 | 3.01 | 0.11 | 3.29 | 0.10 | 3.47 | 0.14 | 2.91 | 0.42 | 4.62 | 0.63 | 9+1 | SBH /Seyfert2 |
| 14.1567 | Seyfert 1 | |||||||||||||||
| 14.9025 | Liner | |||||||||||||||
| 14.9154 | 25.58 | 0.27 | 6.54 | 0.18 | 12.43 | 0.23 | 1.52 | 0.08 | 12.15 | 0.23 | 5.43 | 0.12 | 5.47 | 0.19 | 4+6 | Seyfert 2 |
| 15m-Radio | no-detected 15m -Radio | CFRS1415+52 | ||||
| L2800 | LIR | L2800 | LIR | L2800 | ||
| Upper limit | 296 | 1778607 | 21729 | 2161214 | 24635 | 3939821 |
| AGN contrib. | 41 | 680291 | 17 2 | 84 27 | 213 | 724318 |
| ”old stars” contrib | 10 | 115 28 | 25 3 | 44 16 | 263 | 159 44 |
| Lower limit | 245 | 984288 | 17524 | 511 71 | 19929 | 1495359 |